2020 Global Food Outlook
Trends,Alternatives, and Choices
A 2020 Vision for Food,Agriculture, and the Environment Initiative
International Food Policy Research Institute
Mark W. Rosegrant Michael S. Paisner
Siet Meijer Julie Witcover
Copyright © 2001 International Food Policy Research Institute.All rights reserved. Sections of this report may be reproduced without the express permission of but with acknowledgment to the International Food Policy Research Institute.
Contents
Preface v
Introduction
1
Recent Trends in Food Supply and Demand
2
The World to 2020: Baseline Scenario
4
Alternative Futures
8
AL FOOD OUTLOOK
Preface
G
overnment officials and representatives of aid agencies are continually making decisions about how to spend their resources. It is easy to lose sight of the fact that each decision to be made represents a fork in the road, and each investment is a step in the direction of a future that will bring a healthy, sustainably produced diet to more people—or to fewer.This report shows just how, and how much, certain policy decisions and social changes will affect the world’s future food security. It projects the likely food situation in 2020 if the world continues on more or less its present course, and it then shows how alternative choices could produce a different future. Even rather small changes in agri-cultural and development policies and investments, it turns out, can have wide-reaching effects on the number of poor and undernourished people around the world. A world of less poverty, greater food security, and a healthier environ-ment is possible, but it will not come about without explicit policy steps in that direction.
2020 Global Food Outlook is the latest in a series of world food projections based on a model developed at IFPRI beginning in 1992.The model has been updated and expanded periodically since then as a way of painting an ever-clearer picture of the global food situation in 2020. More details about the simulations in this report are available in a comprehensive monograph titled Global Food Projections to 2020: Emerging Trends and Alternative Futures.
Our thanks go to Rajul Pandya-Lorch for her intellectual support and editorial guidance during the preparation of this report and to Heidi Fritschel for editorial assistance.
The experience of the 1990s shows that using short-term trends in global markets to make judgments about long-term food security is next to useless. Indeed, year-to-year changes in prices and production—and the influence that these changes have on the attention devoted to the global food situation—may contribute to long-term food problems by encouraging complacency during periods of strong harvests.To understand the future of food supply and demand and food security, it is essential instead to focus on long-term forces, such as income growth, population growth, and technological
change in agriculture driven by investments in agricul-tural research, irrigation, and roads.
Throughout recent short-term changes in markets, the long-term forces have consistently pointed to clear causes for concern.The world’s population is expected to grow from 6 billion people in 2000 to 7.5 billion people in 2020.Availability of land for farming is on the decline, and water for agriculture and other uses is increasingly scarce.Together these and other forces will challenge the capacity of the world’s food production system.
AL FOOD OUTLOOK
C
oncern about the world’s future food security seems to run in cycles. In the mid-1990s world cereal prices rose dramatically as cereal stocks fell sharply, and some observers foresaw a starving 21st century world unable to meet growing food demands from a deteriorating natural resource base.Worries eased in the late 1990s as global cereal production hit record levels in response to high prices and falling stocks, while declining incomes due to the East Asian economic crisis reduced the demand for food commodities. As cereal prices plummeted in response, the policy focus in much of the world shifted from concern over long-term food supply and demand problems to concerns about subsidy provision to financially distressed farmers.Introduction
IMPACT:A Model of the World’s Food
We projected world food supply and demand, trade, prices, and food security to the year 2020 based on an updated version of IFPRI’s International Model for Policy Analysis of Agricultural Commodities and Trade (IMPACT). IMPACT covers 36 countries or country groups and 16 commodities, including all cereals, soybeans, roots and tubers, meats, and dairy products (accounting for virtually all of the world’s food and feed production and consumption).The model is specified as a set of country-level demand and supply equa-tions linked to the rest of the world through trade. Food demand is a function of commodity prices, per capita income, and population growth. It includes fresh and processed food. Feed demand is a function of livestock production, feed prices, and feeding efficiency. Crop production is determined by the area and yield response functions. Area is projected as a function of crop price, investment in irrigation, and estimated rates of loss of land to urbanization and land degradation. Crop yield is a function of crop price, input prices, investments in irrigation, and yield growth due to technological change. Growth in productivity due to tech-nological change is in turn estimated by its component sources including advances in management research and, in the case of food crops, plant-breeding research. Other sources of growth considered in the model include private-sector investments in agricultural research and development, agricultural extension and education, markets, infrastructure, and irrigation.1
T
he world has experienced an unprecedented increase in population during the past century, with a billion people added every decade during the last three decades alone. Dramatic shifts in production and consumption of food have accompanied this population explosion, including a surge in grain production, a spec-tacular rise in meat production and consumption, and the emergence of an increasingly vital role for interna-tional trade (Figure 1). High-yielding varieties of wheat and rice swept across much of Asia during the 1970s and early 1980s, easing fears of imminent famine. Cereal yields have risen more modestly in recent years, but they have still outstripped gains in other crops such as cassava, potatoes, and beans.Recent Trends in Food Supply and Demand
Cereal grain production kept pace with rising popu-lations in some nations, such as India. Many other coun-tries turned increasingly to imports to feed their people, either because domestic production was too low or because income rose far faster than population, escalating demand for food and feed grain.Argentina, Australia, Europe, and North America responded with
a flood of exports.The volume of cereals traded inter-nationally more than doubled over 30 years to more than 250 million tons by the late 1990s. During part of this period, particularly in the early 1980s, government subsidies to farmers helped fuel cereal production in Western Europe and North America. Such subsidies led to a glut of grain, driving down food prices on world
markets and leading to the emergence of Western Europe as a significant net exporter of grain. In the late 1980s and the 1990s, however, North America and Western Europe partially reduced subsi-dies (and revised the form of subsidy to less directly influence production decisions), and growth in production of cereals slowed.
Livestock consumed a growing share of cereal production. Rising incomes in many parts of the developing world fueled a boom in meat consumption, particularly of poultry. Starting from very low levels, per capita consumption of meat in the developing world more than doubled from 1967 to 1997, with even more spec-tacular increases in the consumption of poultry. Nevertheless, a typical person in the developing world still consumes only a third as much meat, on average, as a typical person in the developed world.
Defying consistent predictions to the contrary, both India and China have managed to satisfy the bulk of their own cereal market demands—though in the case of India, this situation has been due in large part to slow income growth and policies that raised food prices and
Population 300 250 200 150 100 50 0 1966 = 100
Figure 1 Population and global food production indices, 1966–1998
1966 1970 1975 1980 1985 1990 1995 1998
SOURCE: FAOSTAT at www.fao.org
Cereal Production Meat Production 120 100 80 60 40 20 0 Millions
Figure 2 Malnourished children under age 5, 1970–1997
1970 1975 1980 1985 1990 1995 1997
West Asia/North Africa Latin America Sub-Saharan Africa
East Asia South Asia
SOURCE: 1970–1995, L. Smith and L. Haddad, Overcoming Child Malnutrition in Developing Countries: Past Achievements and Future Choices, 2020 Vision Discussion Paper 30 (Washington, D.C., IFPRI, 2000); 1996–1997, IFPRI IMPACT
extrapolations.
2020 GLOB
AL FOOD OUTLOOK
AL FOOD OUTLOOK
depressed food demand.Worldwide, prices for maize, rice, and wheat have each declined by 50 percent or more over the last 20 years, and consequently food has been available to satisfy the market demand for these commodities. Meeting demand, however, does not neces-sarily mean assuring food security.When people lack the money to buy this food, their needs are not translated into market demand.
Food insecurity remains persistent but not neces-sarily because of shortfalls in global food production. Significant improvements have been made—the propor-tion of children under the age of five who suffer from malnutrition fell sharply from 45 percent in the late 1960s to 31 percent in the late 1990s. However, because of population growth, the absolute number of malnour-ished children has fallen much less sharply, from 187 million to 167 million children during this period. East Asia has led the way in tackling child malnutrition, while progress has been difficult to sustain in South Asia, which significantly lowered the number of malnourished chil-dren during the 1970s but experienced an upturn during the first half of the 1980s (Figure 2).The situation is bleakest in Sub-Saharan Africa, the only region in which both the number and proportion of malnourished chil-dren has been consistently rising in recent years. In a world that has experienced astounding advances in knowledge and growth during the past century, one-third of all children in Sub-Saharan Africa continue to go to bed hungry and have their mental and physical devel-opment compromised by the ravages of hunger.
W
ill hunger persist for tens of millions of children for the foreseeable future? Will the Earth’s natural resource base be able to keep up with food demand from a steadily rising world population? The base-line scenario described here gives our best estimate of the most likely world food situation in 2020 if govern-ments make no major changes in their agricultural and economic policies and investgovern-ments and if population grows at the rate given in the United Nations’ medium projection.This scenario suggests that although overall global food security may improve somewhat in the next two decades, millions of children will remain hungry and in some regions food insecurity will be dire.The World to 2020: Baseline Scenario
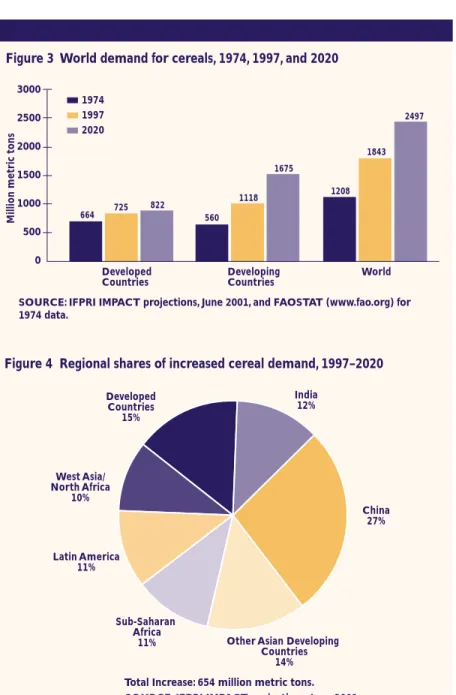
Although developing countries will account for most of the increase in global demand for cereals, growth in their demand for cereals is not as rapid as it once was.As population growth slows and people in developing countries diversify their diets away from cereals because of rising prosperity and changing dietary preferences, growth in cereal demand in the developing world is projected to decline from 2.3 percent a year in 1974–97 to 1.3 percent a year in 1997–2020. Nevertheless, the absolute increase in the demand for cereals during 1997–2020 is expected to be as large as the increase in demand during the preceding 23 years (Figure 3). Developing countries in Asia, because of their larger and more urbanized populations and rapid economic growth, will account for half of the increase in global demand for cereals, with China alone accounting for one-quarter (Figure 4).
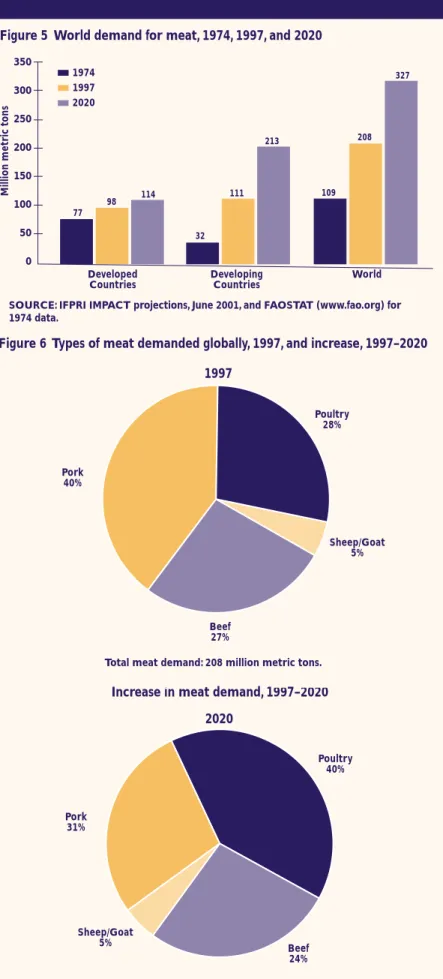
The world’s appetite for meat will jump enormously.Worldwide, demand for meat is forecast to rise by more than 55 percent (Figure 5) between 1997 and 2020, with most of the increase occurring in developing countries. China alone will account for more than 40 percent of this increase, compared with India’s 4 percent. Even though demand for meat will double in South Asia, Southeast Asia, and Sub-Saharan Africa, per capita consumption of meat will remain far below levels in the developed world.This gap suggests that
3000 2500 2000 1500 1000 500 0
Million metric tons
1974 1997 2020
Figure 3 World demand for cereals, 1974, 1997, and 2020
Developed Countries Developing Countries World 664 560 1118 1208 1843 1675 2497 725 822
SOURCE: IFPRI IMPACT projections, June 2001, and FAOSTAT (www.fao.org) for 1974 data.
Figure 4 Regional shares of increased cereal demand, 1997–2020
Developed Countries 15% India 12% China 27% Sub-Saharan Africa 11% Latin America 11% West Asia/ North Africa 10%
Other Asian Developing Countries
14%
SOURCE: IFPRI IMPACT projections, June 2001. Total Increase: 654 million metric tons.
2020 GLOB
AL FOOD OUTLOOK
AL FOOD OUTLOOK
people in these regions will have the potential to consume considerably more meat.
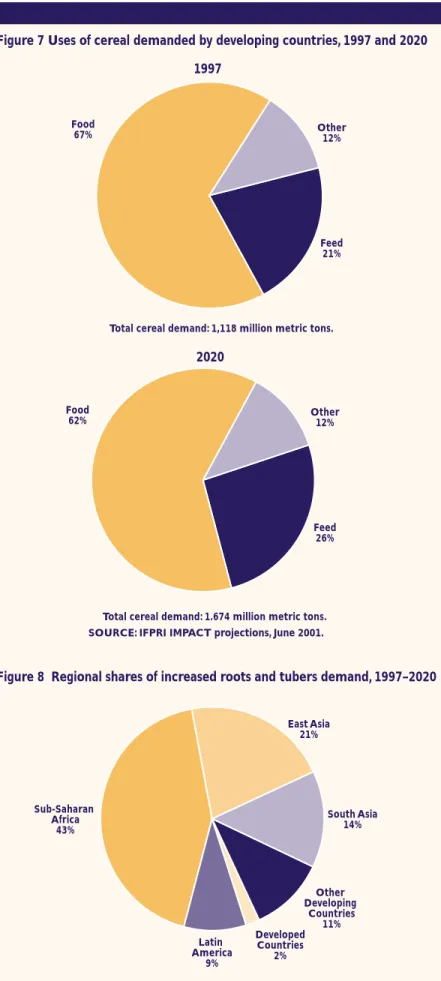
Poultry will account for 40 percent of the global increase in demand for meat to 2020, far higher than the 28 percent it accounted for in 1997, reflecting a dramatic shift in taste from red meat to chicken (Figure 6).To fuel the explosive rise in demand for meat, farmers will increasingly need to grow cereal crops— particularly maize—for animal feed rather than for direct human consump-tion (Figure 7).
People in developing countries will also increase their demand for other staple food commodities. In many parts of Sub-Saharan Africa, roots and tubers, especially cassava, sweet potatoes, and yams, are a major source of sustenance. In the late 1990s, they accounted for 20 percent of calories consumed in the region, and even more in the diets of the poor. In much of Asia and Latin America, roots and tubers are an important supple-mental source of carbohydrates, vitamins, and amino acids in food systems domi-nated by other commodities. Between 1997 and 2020 total demand for roots and tubers in the developing world will increase by 55 percent (248 million tons). Sub-Saharan Africa is projected to account for 43 percent of this increased demand, indicating that roots and tubers will continue to play a large role in people’s diets there (Figure 8). Asia will also account for a significant amount of the total increase, with East Asia accounting for 21 percent and South Asia 14 percent.
Even though growth in cereal demand is slowing, farmers in developing countries will not be able to keep pace. In most of the developing world, expansion of crop area will be severely limited. In parts of Asia, almost all the suitable land is already under cultivation, cities are encroaching on prime agricultural land, and land degra-dation is becoming an increasingly serious problem. Sub-Saharan Africa and Latin
350 300 250 200 150 100 50 0
Million metric tons
1974 1997 2020
Figure 5 World demand for meat, 1974, 1997, and 2020
Developed
Countries DevelopingCountries World
77 32 111 109 208 213 327 98 114
SOURCE: IFPRI IMPACT projections, June 2001, and FAOSTAT (www.fao.org) for 1974 data.
Figure 6 Types of meat demanded globally, 1997, and increase, 1997–2020
Pork 40% Poultry 28% Sheep/Goat 5% Beef 27%
Total meat demand: 208 million metric tons.
1997 Pork 31% Sheep/Goat 5% Beef 24% Poultry 40% 2020
Increase in meat demand, 1997–2020
are projected to bring another 20 million hectares of cereal production under the plow between 1997 and 2020, and farmers in Latin America, 8 million hectares, but the rest of the developing world will account for only another 13 million hectares.
Because new agricultural land will be scarce, increasing cereal production will require increasing productivity—that is, getting greater cereal yields from a given hectare of land. But increases in yields are slowing for all cereals and in nearly all regions. In Sub-Saharan Africa yields are projected to recover from past stagnation (Figure 9). But yield growth rates in most of the world have been slowing since the early 1980s. In the developed world the slowdown was primarily a result of policy measures, as North American and
European governments drew down cereal stocks and scaled back farm-price support programs in favor of direct payments to farmers. In Eastern Europe and the former Soviet Union economic collapse and subsequent economic reforms further depressed productivity. In developing countries, particularly in Asia, the slow-down in cereal productivity growth stemmed partly from growing water shortages, slowing public investment in crop research and irrigation infrastruc-ture, and heavy use of fertilizers, water, and other inputs (which means that it takes ever more inputs to sustain yield gains).These forces are expected to further slow growth in cereal yields worldwide from 1.6 percent a year in 1982–97 to 1.0 percent a year in 1997–2020.
Greater yields will also be needed to increase production of roots and tubers throughout the developing world, and the area planted to roots and tubers will actu-ally shrink significantly in the developed world. In Sub-Saharan Africa, however, expansion of cultivated area will account for a projected 27 percent of additional roots and tubers production there.
By 2020, with developing countries unable to fully meet their cereal demands from their own production, international
Figure 7 Uses of cereal demanded by developing countries, 1997 and 2020
Total cereal demand: 1,118 million metric tons.
1997 Food 67% Other12% Feed 21% Food 62% Other12% Feed 26%
SOURCE: IFPRI IMPACT projections, June 2001. Total cereal demand: 1.674 million metric tons.
2020
Figure 8 Regional shares of increased roots and tubers demand, 1997–2020
SOURCE: IFPRI IMPACT projections, June 2001. Developed Countries 2% East Asia 21% Sub-Saharan Africa 43% Latin America 9% South Asia 14% Other Developing Countries 11% 2020 GLOB AL FOOD OUTLOOK 6
2020 GLOB
AL FOOD OUTLOOK
trade will play a larger role in providing food to many regions of the globe. Fortunately, cereal producers in the Americas and in Europe appear ready and able to meet this demand.The United States will become an even more domi-nant force in agricultural markets, while Europe will continue to be a major agri-cultural exporter (Figure 10). Net cereal imports by developing countries will more than double to 2020 with Asian nations, particularly China, boosting their imports enormously. However, countries that falter economically, leaving them unable to muster enough foreign exchange to pay for adequate food imports, will become increasingly vulnerable to food shortages.
Sharp falls in food prices over the last two decades were a great benefit to the poor, who spend a large share of their income on food. But international cereal prices are projected to decline only slightly during the next two decades, a significant break from past trends (Figure 11). Shocks to agriculture, particularly failure to meet farmers’ needs for water and other inputs, could push food prices up significantly.
Unfortunately, the prospects for reducing child malnutrition are mixed. Overall, the number of malnourished chil-dren is expected to continue its gradual decrease, from 166 million in 1997 to 132 million in 2020 (Figure 12).The number of China’s malnourished children will fall by half, while India will experience slower improvement and will remain home to a third of all malnourished children in the developing world. Sub-Saharan Africa, with its combination of high population growth and lagging economic performance, will be caught in an increasingly perilous situa-tion.The number of malnourished chil-dren there is forecast to increase by 6 million, or 18 percent, compared with 1997. Sub-Saharan Africa is likely to remain a “hot spot” of hunger and malnu-trition for years to come.
4 3 2 1 0
Figure 9 Cereal yield growth rates by region, 1967–2020
East Asia South Asia Southeast Asia Latin Ameri ca Sub-Saharan Africa West Asia/ Nor th Africa De veloped countries 1967–82 1982–97 1997–2020 P e rcent per y ear
Figure 10 Net trade in cereals by region, 1997 and 2020
1997 2020
-75 -50 -25 0 25 50 75 100 125
USA EU15
West Asia/North Africa Latin America Sub-Saharan Africa China
Southeast Asia South Asia
Million metric tons
300 250 200 150 100 50 0 US$/Metric ton 1997 2020
Figure 11 Cereal prices by crop, 1997 and 2020
Wheat Maize Rice Other Coarse
Grains 100 80 60 40 20 0
Figure 12 Malnourished children by region, 1997 and 2020
South Asia Southeast Asia
in America Africa West Asia/
orth Africa China
1997 2020
Alternative Futures
Sub-Saharan Africa:
A Troubled Region
In projections of the future, Sub-Saharan Africa’s problems stand out in stark and troubling fashion.As already noted, Sub-Saharan Africa is the only region in which the number and percentage of children who are malnourished is expected to rise, rather than fall, over the next 20 years. Most disturbing, however, is that even this baseline projec-tion rests on assumpprojec-tions that may prove optimistic. One key assumption is that production of most crops will increase at healthy rates over the next two decades.African farmers have, in fact, increased production at even more rapid rates during the past decade.They have done so mainly by cultivating more land and not, for the most part, by using more fertilizer, better practices, or improved
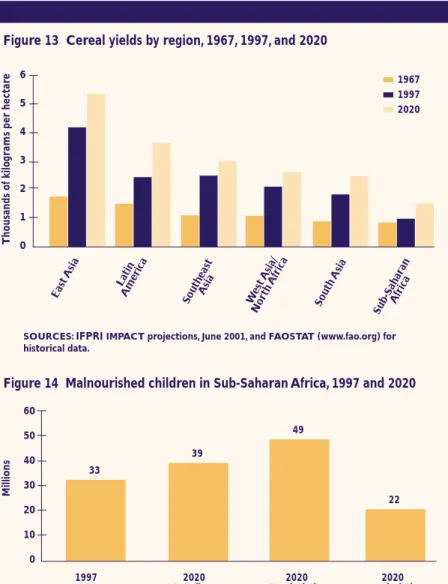
vari-eties of crops.As a result, although crop yields in Sub-Saharan Africa were nearly equal to those in South Asia in the 1960s, they are now far lower, and the gap is even greater between Sub-Saharan Africa and other developing regions (Figure 13).
Future increases will have to come increasingly from more intensive production on existing agricultural land. More intensive agricultural production will have to be accompanied by measures to maintain and replenish the soil to prevent agricultural areas from becoming degraded and better rural infrastructure to allow increased produc-tion to reach consumers in larger towns and cities.All of this will require more enlightened policies and substantial investment in agricultural inputs, such as fertilizer and irri-gation, as well as in roads, clean water, and education.
What if such efforts falter? What if, perhaps because of political turmoil or the toll exacted by the AIDS epidemic or simple lack of polit-ical will to make needed investments and policy reforms, the projected increases in both crop area and yields were cut in half and social indicators such as female life expectancy and access to education and sanitation fell significantly? The results under such a scenario would be tragic. Because agriculture is such an important part of the region’s economy, per capita income would fall, instead of rising slightly as in the baseline projection. Sub-Saharan Africa’s net food import bill in 2020 would jump from US$6.5 billion in the baseline to US$11 billion. Per capita calorie consumption would decline by 11 percent compared with the 2020 baseline level, and the blow would fall with greatest impact on children.The number of malnourished children would increase to 49 million, a 50 percent increase over the level in 1997 (Figure 14).To make matters worse, such high levels of food imports may be economically and politi-cally unsustainable. If African nations lack the foreign exchange to pay for these imports, food shortages and malnutrition would be even more catastrophic.
What kinds of transformations—in economic and agricultural growth, educa-tion, and health—will be necessary to allow Sub-Saharan Africa to battle
child-6 5 4 3 2 1 0
Figure 13 Cereal yields by region, 1967, 1997, and 2020
East Asia Southeast Asia Sub-Saharan Afric a Latin America South Asia
SOURCES: IFPRI IMPACT projections, June 2001, and FAOSTAT (www.fao.org) for historical data. West Asia/ Nor th A frica 1967 1997 2020 Thousands of kilo
grams per hectar
e 60 50 40 30 20 10 0 Millions 22
Figure 14 Malnourished children in Sub-Saharan Africa, 1997 and 2020
1997
SOURCE: IFPRI IMPACT projections, June 2001.
2020 Baseline Scenario 2020 Pessimistic Scenario 2020 Optimistic Scenario 49 39 33 2020 GLOB AL FOOD OUTLOOK 8
AL FOOD OUTLOOK
hood malnutrition as effectively as the rest of the devel-oping world is projected to do? Reversing the tide in Sub-Saharan Africa enough to reduce the number of malnourished children in 2020 by one-third, from 33 to 22 million, would require an increase in total investments on roads, irrigation, clean water, education, and agricul-tural research of US$76 billion, to US$183 billion, between 1997 and 2020 compared with the baseline. Crop yields would have to grow at an annual rate of around 3 percent. Even more significantly, total gross domestic product (GDP) would have to grow at an annual rate of 8 to 10 percent.
Such rates of growth, while spectacular, are not unprecedented.They occurred in Asia during the Green Revolution. It is unlikely, however, that Sub-Saharan Africa will follow the same path as Asia toward rapid agricultural growth, because Sub-Saharan Africa faces different constraints. Agroclimatic constraints to production are more difficult than in much of Asia, the cost of exploiting water is higher, and transportation and communications infrastructure is far more limited than it was when the Green Revolution began in Asia. Still, the costs of not making the necessary investments in Sub-Saharan Africa will be tremendous, not only to the region but also to the rest of the world. Sub-Saharan Africa is one of the last two bastions of hunger and malnutrition (South Asia is the other), and without progress here, the world will make only a small dent in the global burden of malnutrition.
Asian Giants Not Likely to
Disrupt World Food Markets
It is often suggested that India and China, home to more than a third of the globe’s people, hold the fate of global food security in their hands. Shifts in food production or consumer behavior in these countries, it is alleged, could produce enormous shifts in demand for food on global markets, with effects reverberating throughout the world.
What would happen, for instance, if rapid growth in incomes caused Indians to consume more meat, as income growth has done in other parts of the world? A simulation of these events, however, proves surprisingly reassuring. If, for instance, the average Indian responded to growing prosperity by eating more meat, per capita meat consumption in India could reach 18 kilograms in 2020, similar to levels in Indonesia and Pakistan and more than twice the projections for India in the baseline scenario. Consumption of meat in China has grown at
fact, prove self-limiting. Rising demand for meat would have to be met both by increased domestic production and by expanded imports of meat.The demand for cereal for livestock feed would put additional pressure on both domestic cereal production and cereal imports. Meat imports in 2020 would rise to 1.8 million metric tons (compared with 0.2 million metric tons in the baseline), and cereal imports to 26 million metric tons instead of 6 million metric tons in the baseline.
The surprising aspect of this scenario, however, is how little it would affect international prices for cereals or meat. International food markets appear resilient enough to accommodate India’s increasing demands. Under this scenario, beef prices on international markets would decline only by 2 percent between 1997 and 2020, rather than by 4 percent in the baseline scenario; wheat prices would decline by 3 percent, rather than by 8 percent; and maize prices would rise by 5 percent, instead of falling by 1 percent.
But other vulnerabilities also exist in India and the other Asian giant, China. Some observers believe that both countries will have great difficulty expanding agricul-tural production further, because of degraded land, water shortages, and growing competition with cities and industry for land and water.They believe that environ-mental degradation, unsustainable groundwater extrac-tion for irrigaextrac-tion, and slowing agricultural investments could result in a sharper decline in agricultural growth than envisioned in the baseline scenario.What would be the impact on world food markets if yields and cultivated area in India and China increased only half as rapidly as expected? Some of the effects of this slowdown in production would tend to offset each other. Food short-ages would produce higher prices, bringing on a partial rebound in food production.The agricultural slowdown also would depress economic growth and with it demand for food, particularly meat.
Even so, both India and China would be forced to turn increasingly to food imports. China’s cereal trade deficit in 2020 would nearly double from 48 million metric tons under the baseline scenario to 89 million metric tons, while India would shift from near self-suffi-ciency under the baseline scenario to imports of 30 million. India’s small agricultural trade surplus in 1997 would give way to a deficit of US$9.1 billion in 2020, while China’s agricultural trade deficit would soar to US$33.5 billion.Yet even rising imports of this magnitude would not throw international cereal or meat markets into disarray or provoke devastating price increases.
Slowing agricultural growth in India and China would leave 2 million more children malnourished in 2020 in each of these two Asian giants, compared with the base-line scenario. In addition, this result assumes that China and India would be willing and able to finance an enor-mous increase in food imports. Should these countries resist such a growing dependence on foreign suppliers and attempt instead to protect and promote domestic production, domestic food prices could increase dramati-cally, further worsening child malnutrition.
Easing Population Growth’s
Burden on Young Children
Ever since Malthus, many have regarded rapid population growth as one of the great underlying causes of hunger and environmental destruction.Yet birthrates have been declining in recent years, pushing estimates of future popu-lation growth downward. If popupopu-lation grows at rates lower than projected under the baseline, what would be the impact on the world food situation? The United Nations’ (UN) low estimate of population growth results in a total world population of 7 billion people in 2020, rather than the oft-quoted medium projection of 7.5 billion—the number used in the baseline scenario. Replacing the UN medium population growth assumptions with its low popu-lation growth assumptions in the model shows how slower population growth is likely to affect food security.
In the low population growth scenario, the number of malnourished children under the age of five in the developing world declines dramatically (Table 1). Not only is the population under five smaller, but per capita consumption of calories is higher thanks to lower food prices and higher per capita incomes resulting from lower population growth. Under this scenario per capita kilocalorie consumption increases by 88 kilocalories above baseline levels.The number of malnourished
children in the developing world is projected to drop by an additional 29 million, to 102 million malnourished children in 2020.
While this number is still unacceptably high, a 28 percent decline in child malnourishment is truly remark-able. It reveals the extent to which high population growth in impoverished regions adds millions of children to popu-lations that are already highly food stressed and unable to cope with the additional burden. South Asia stands out in this analysis: under the low population growth scenario, child malnutrition in that region drops 25 percent (16 million children) below baseline 2020 levels. Slower popu-lation growth does not cure all ills, by any means. In Sub-Saharan Africa, the number of malnourished children would still increase slightly between 1997 and 2020, from 33 million to 34 million, but the increase would be far less than projected under the baseline scenario.
Feeding People and
Feeding Livestock
The high levels of meat demand in developed countries and the rapid growth in meat demand in developing countries have caused concern that diverting cereals to feed livestock leads to an inadequate cereal supply for direct human consumption.Would improving feeding efficiencies (the amount of cereal required to produce a kilogram of edible meat) or dramatically reducing meat consumption in devel-oped countries release cereals for human food consump-tion and significantly raise nutriconsump-tional status in developing countries?
From 1967 to 1982, feed ratios were constant: as meat production increased, demand for feed increased by a directly proportionate amount. Since then, however, meat producers have required substantially less feed for each additional kilogram of meat produced.The reasons are many.The most important have probably been
Millions of malnourished children
REGION SOUTH ASIA SOUTHEAST ASIA EAST ASIA SUB-SAHARAN AFRICA LATIN AMERICA
WEST ASIA/NORTH AFRICA DEVELOPING COUNTRIES LOW UN PROJECTION 47.6 10.3 6.2 33.7 1.5 3.0 102.3 MEDIUM UN PROJECTION 63.3 14.0 8.5 39.3 2.5 4.0 131.5 DIFFERENCE 15.7 3.7 2.3 5.6 1.0 1.0 29.2
Table 1—Child malnutrition under low and medium population projections, 2020
2020 GLOB
AL FOOD OUTLOOK
10
SOURCE: IFPRI IMPACT projections, June 2001. .
AL FOOD OUTLOOK
changes in genetics and in livestock management, including hormone use. In addition, poultry, which convert feed into meat more efficiently than livestock, have accounted for an increasing share of meat production.
Some of these phenomena are declining in impor-tance. Consumers in Europe and North America are increasing their demand for lean meat. Leaner animals are inherently less efficient converters of feed into meat. In addition, meat production in some developing countries is shifting rapidly toward commercial enterprises, which rely more heavily on cereal feed than do backyard or small-scale producers. Baseline projections for the future, therefore, assume that demand for feed will match meat production more closely than it has in recent years.
It is possible, however, that technological changes not accounted for in the baseline scenario would cause feed ratios to fall more rapidly, continuing the trend of recent years. Under such a scenario, meat production would become cheaper and consumers would eat more of these meats. In addition, total demand for grain would fall because animals would eat less feedgrain.The price of maize, instead of holding steady, would fall by 28 percent relative to the 2020 baseline scenario.
This shift in grain prices then would set off a cascade of consequences.As demand for animal feed grows more slowly, international flows of more affordable grain— particularly maize—would shift away from countries in East and Southeast Asia that import large amounts of animal feed.The grain would flow instead toward South Asia and Sub-Saharan Africa, where these cereals are mainly eaten by people. Net imports of cereals into Sub-Saharan Africa and South Asia would increase by 89 and 81 percent, respectively, compared with the baseline scenario.The less grain is demanded to feed animals in East Asia and the Middle East, the more grain is available for consumers, particularly in Africa and South Asia.
Finally, in a surprising connection between different corners of the global economy, the change in feed ratios has an effect on the number of malnourished children.A reduction of 3 million malnourished children relative to the baseline scenario is not huge, compared to a global total of 129 million malnourished children, but it is note-worthy.The effect is most significant in Sub-Saharan Africa, the region with the most entrenched difficulties. Because maize, the most important source of animal feed, is heavily used for food in Africa, less demand for animal feed would translate directly into more food avail-able for people. Under this scenario, there would be 1.6 million fewer malnourished children in Sub-Saharan Africa
Reduced demand for meat in developed countries would affect food consumption in developing countries primarily through prices. Reduced demand for meat will directly reduce the world price of meat, making meat more affordable for consumers in developing countries.This reduced meat demand and drop in meat prices will also cause a direct reduction in meat production in both developed and developing countries, which will reduce the demand for cereals for animal feed. Reduced demand for feedgrains will in turn cause a drop in prices of cereals, inducing an increase in food demand for cereals.
A 1999 study using IMPACT explored in detail the impact of a decline in per capita meat demand in devel-oped countries by one-half between 1993 and 2020.2
It found that 2020 prices for beef, pork, sheep and goat meat, and poultry would be 22–31 percent lower than in the baseline.The effects of reduced meat demand in developed countries on cereal prices are, however, much less pronounced. Prices for maize and other coarse grains—commonly used for feed—would be 11 percent and 10 percent lower, respectively, in 2020 than in the baseline scenario. Prices of wheat and rice would only be 5 percent and 1 percent lower, respectively.The effects on wheat and rice are particularly small because although these grains are the primary staple cereals in developing countries, they make up only a small share of animal feed. Reduced demand for maize and other coarse grains for livestock feed in developed countries does not translate into greatly reduced prices for rice and wheat in devel-oping countries.
With the price changes that stem from cutting per capita meat consumption by half in developed countries, each person in the developing world would on average consume about 13 percent more meat and 1.5 percent more cereal than under the baseline scenario. Falling meat production in developing countries would lead to a decline of 33 million metric tons in feed demand.This decline would offset the 13 million metric tons increase in food demand, leading to a slight drop in total demand for cereals in developing countries compared with the baseline. Because of lower cereal prices, developing-country farmers would produce 27 million metric tons less cereals than under the 2020 baseline, and cereal imports would increase by 11 million metric tons.
In the end, people in developing countries would consume only 40 additional calories per capita in 2020 as a result of reduced meat consumption in developed countries.The number of malnourished children in devel-oping countries would decline by 3.6 million children in
Productivity Growth and Food Prices
As already described, crop yields have been growing ever more slowly around the world. Many yield gains in recent decades have resulted from one-time advances, such as higher crop planting density, multiple harvesting, introduction of strains with greater fertilizer responsive-ness, and better management practices. Crop yields may be approaching their physical limitations in some high-yield systems, primarily in developed countries, and the maximum yield potentials of rice and maize have changed little over the past three decades.
Environmental constraints add a layer of uncertainty to any prediction regarding future yields of intensively culti-vated crops. Some of the world’s most productive agri-cultural areas now suffer environmental repercussions from intensive use of fertilizer, irrigation, and pesticides.
What would happen if a combination of increased environmental problems and reduced investment in agri-cultural research caused crop yields to grow more slowly than in the baseline? Alternatively, what if the world food situation seized the attention of governments, interna-tional organizations, and private firms, unlocking resources for agricultural research and irrigation such
that crop yields increased more rapidly than in the base-line projection?
The low-yield scenario assumes that irrigation does not grow at all and that yield growth rates for meats, milk, and all crops decline by 50 percent from the baseline level in the developed world and by 40 percent in the developing world.The high-yield scenario assumes that irrigated area expands by 1 percent per year over the baseline growth rate and that yield growth rates rise by 20 percent from the baseline level in the developed world and by 40 percent in the developing world.
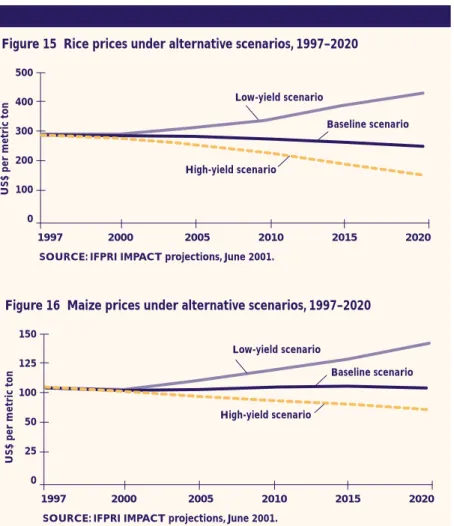
With slower growth in yields, supplies of food would be unable to keep pace with population and income growth at prevailing prices. Food would become scarce, resulting in sharply higher prices. In the low-yield scenario, rice would be 46 percent more expensive in 2020, compared with baseline projections, and maize prices 34 percent higher (Figures 15 and 16).
Conversely, faster growth in yields would produce abun-dant food and falling prices. Maize prices would fall by 30 percent compared with the baseline, and rice prices would fall by 47 percent.
Changes in the growth of crop yields have dramatic effects on international cereal prices. Rice prices are particularly sensitive to slower yield growth because of the high proportion of rice produced in the developing countries that are most affected under this scenario. How fast investments in agricultural research and infrastructure grow over the next few decades—and thus how fast crop yields grow—will fundamentally determine the price of food for the poor.
Trade Liberalization
Is Important
Most governments have been unwilling to turn food production over to the forces of the free market.They intervene in agricul-ture in countless ways to promote domestic food production, to keep domestic food prices low, or to reduce dependence on foreign suppliers. Many experts have demanded at least the partial abolition of these measures, arguing that they produce inefficiencies that leave most people worse off. Reducing agricultural trade distortions has been a major thrust of recent trade negotiations.
Low-yield scenario 500 400 300 200 100 0
US$ per metric ton
Figure 15 Rice prices under alternative scenarios, 1997–2020
1997 2000 2005 2010 2015 2020
SOURCE: IFPRI IMPACT projections, June 2001.
Baseline scenario High-yield scenario Low-yield scenario 150 125 100 50 25 0
US$ per metric ton
Figure 16 Maize prices under alternative scenarios, 1997–2020
1997 2000 2005 2010 2015 2020
SOURCE: IFPRI IMPACT projections, June 2001.
Baseline scenario
High-yield scenario
2020 GLOB
AL FOOD OUTLOOK
AL FOOD OUTLOOK
It is possible to simulate many of the effects of removing all agricultural subsidies and trade barriers, at least on agricultural production.Although this simulation does not capture the possible effects of trade liberaliza-tion on other parts of the economy, such as industry, it can provide some hints regarding the potential impor-tance of trade liberalization.
Because most subsidies and trade barriers promote higher domestic production, full trade liberalization would generally cause agricultural production to fall somewhat, especially in the developed world. Full liberalization would cause moderate increases in world cereal prices above the projected baseline level in 2020.World rice prices would increase the most, by 14 percent above the base-line level in 2020, followed closely by wheat and maize, with price increases of 8 and 9 percent, respectively. Meat prices would respond to full trade liberalization with even sharper price increases above baseline levels in 2020, with sheep and goat prices rising 19 percent and beef prices rising 18 percent. Pork and poultry are less affected, with price increases of 13 percent for both commodities.
More important, trade liberalization would generate significant net economic benefits.Taking into account the benefits to producers and consumers and the tax savings resulting from removals of subsidies, liberalizing trade for the 16 commodities included in the model would generate global benefits of US$35.7 billion in 2020 (Table 2). Both developed regions and developing regions
benefit, with the former gaining US$14.2 billion and the latter US$21.5 billion.Although these gains are not large compared with GDP, in many regions they are significant compared with the value of agricultural production. In proportion to their agricultural sectors, the biggest gainers would be Japan and South Korea (the latter is included in Other East Asia in the table). But the biggest absolute gains would be in Sub-Saharan Africa, at US$4.4 billion, or 10 percent of the value of production of the commodities examined here.This gain arises partly because African farmers face less competition from subsi-dized exports from Europe and other developed coun-tries. It also, however, results from the removal of taxes that most African governments impose on food produc-tion and consumpproduc-tion.These taxes tend to discourage investment by farmers and make food more expensive for consumers.
This simulation captures only a portion of the poten-tial effects of trade liberalization. If removing trade barriers stimulated overall economic growth by boosting industrial production, it would also have large effects on agriculture and food consumption.
Policy Choices Make a Big Difference
Most people, if given a moment to think about it, probably could assemble a reasonable list of the factors that deter-mine how much food humankind has available to eat. Some of these forces are not under human control, such as the
REGION/COUNTRY World Developed countries United States Europe (EU-15) Japan Developing countries Latin America
West Asia/North Africa Sub-Saharan Africa China
Other East Asian countries India
Other South Asian countries
TOTAL VALUE (BILLIONS OF US$) 35.7 14.2 4.3 4.2 3.0 21.5 3.0 2.3 4.4 3.6 2.4 2.1 1.3 SHARE OF VALUE OF AGRICULTURAL PRODUCTION (%) 3.0 3.0 2.5 3.0 22.3 3.0 2.1 5.9 10.4 1.3 36.7 1.9 3.3 SHARE OF GDP (%) 0.07 0.04 0.03 0.03 0.04 0.14 0.07 0.13 1.03 0.11 0.18 0.14 0.36
Table 2—Effects of global trade liberalization on welfare, 2020
weather. Many others are, at least to a degree.They include the speed of population growth, the level of investment in technologies that allow increased food production, and the ability of farmers to take advantage of available methods for growing food.
But how much of a difference do these humanly controlled factors make? Put another way, how would the world be different in 2020 as a result of a concentrated effort to improve the global food situation? How different would that be from a world in which govern-ments, civil society, the private sector, and indeed all stakeholders devoted little attention to such issues? Compare two alternative futures, an optimistic scenario characterized by increased attention to key drivers of food security and a pessimistic scenario char-acterized by relative neglect of these key drivers. In the first, economic growth accelerates by 25 percent, compared with the baseline projection, and population growth rates decline.The number of people with access to clean water and the number of women with access to secondary education both increase by 10 percent. Depending on the region, agricultural yields increase between 10 and 20 percent faster than anticipated by the baseline scenario.The area of irrigated land increases substantially.
The second alternative foresees a reversal of these developments. Instead of accelerating, economic growth slows, while populations grow more rapidly.Access to clean water and to education declines.Agricultural yields slow down, and no additional land is irrigated.
Global cereal production in the more optimistic scenario increases by 5 percent relative to the baseline scenario, whereas it decreases by 4 percent in the pessimistic scenario. Moreover, in the first scenario, food
becomes much cheaper. Rice, for instance, falls in price by 44 percent compared with the 2020 baseline projection. In the pessimistic scenario, by contrast, its price rises by 45 percent.These shifts in food production and prices reverberate through world food markets. If food produc-tion should increase substantially,Asian countries would become less dependent on imports for their food supplies because they would be able to grow more of their own food. Sub-Saharan Africa, on the other hand, would import more, because food would become more affordable. If food production stagnated, on the other hand, South Asia’s net imports of food would rise by 90 percent. Sub-Saharan Africa would increasingly become priced out of world food markets; the region’s consumers would need just as much food but would not have the income to buy it.
The most dramatic result of this simulation is also the most vital for humanity.The two alternatives for the future show enormous differences in the ability of fami-lies to feed their children. Under the optimistic
scenario, the number of malnourished children in devel-oping nations would decline from 166 million in 1997 to 94 million in 2020, well below the 132 million of the baseline scenario. In China, this number would drop by 80 percent over two decades. Latin America could virtually eliminate the scourge of malnutrition. In Sub-Saharan Africa, where childhood malnutrition is now on the rise, progress would be less dramatic but still substantial. Instead of increasing, as predicted by base-line estimates, the number of malnourished children would decrease by 3 million (Figure 17).The central causes of this improvement in child malnutrition are threefold: broad-based and rapid agricultural produc-tivity and economic growth, reduction in population
growth rates, and increased investment in education and health. Each factor accounts for about one-third of the improvement in childhood malnutrition.
The pessimistic scenario, on the other hand, depicts a slowly unfolding catastrophe. Instead of substantial declines in childhood malnutrition over the next 20 years, the problem would become worse, especially in Sub-Saharan Africa, where the number of malnourished chil-dren would increase from 33 million to 49 million. On a global scale, the developing countries would be home to 178 million malnourished children, compared with 94 million in the optimistic scenario.This is the human price of economic and agricul-tural failure. 100 80 60 40 20 0
Figure 17 Malnourished children in 1997 and 2020 under alternative scenarios
South Asia Southeast Asia
Latin Am
erica Sub-Saharan
Africa West Asia/ Nor
th Africa
SOURCE: IFPRI IMPACT projections, June 2001.
China 1997 2020 Baseline Scenario 2020 Optimistic Scenario 2020 Pessimistic Scenario Millions 2020 GLOB AL FOOD OUTLOOK 14
W
hat will it cost to generate the modest levels of agricultural production growth and human welfare improvement envisioned by the baseline scenario? Investments by developing countries in five key sectors—irrigation, rural roads, agricultural research, clean water provision, and education—are projected to total US$579 billion between 1997 and 2020 (Table 3).These investments are certainly feasible.To put them into context, if total government expenditures in the developing world stayed constant at 1997 levels, the investments foreseen in the baseline scenario would amount to just 3.6 percent of total government spending by developing countries from 1997 to 2020.The Cost of Food Security
The economic burden represented by these invest-ments, however, varies significantly from region to region. South Asia and Latin America will have the highest total expenditures, at US$148 billion and US$140 billion respectively. Whereas Latin America’s annual investment will represent just over 2 percent of its total 1997 government spending, South Asia’s investments will represent 11 percent. Sub-Saharan Africa’s investment requirements, totaling US$107 billion between 1997 and 2020, will represent a sizeable 18.6 percent of 1997 government spending on an annual basis. China will require investments totaling US$41 billion to achieve baseline results.
Of the five sectors, irrigation will account for 30 percent of the total investment, with agricultural research and rural roads accounting for another 21
percent each (Table 4). Education’s share in investment is the lowest, 13 percent. Rural road construction will be particularly important in Sub-Saharan Africa and Latin America, where it will represent 35 percent and 26 percent of total investment in the five investment sectors, respectively, because road construction will be required to support relatively rapid area and crop yield growth in these regions. Even with these relatively high levels of investment, Sub-Saharan Africa will still have an extremely underdeveloped transportation system, and further improvements will remain essential despite their expense.
Education will represent 27 percent of total invest-ment expenditures in West Asia and North Africa under the baseline in large part because of rapid population growth. Clean water, representing 15 percent of total
REGIONS
Latin America
West Asia/ North Africa Sub-Saharan Africa South Asia India Southeast Asia China Developing Countries BASELINE 140.4 80.5 106.9 148.2 110.5 52.6 41.4 578.9 OPTIMISTIC 179.1 112.3 133.3 198.4 137.8 69.7 83.5 802.4 PESSIMISTIC 75 52 63.9 70.3 54.5 27.1 26.8 322.7 BASELINE 2.2 2.8 18.6 11.1 10.3 4.2 1.5 3.6 OPTIMISTIC 2.9 3.9 23.2 14.9 12.8 5.6 3.0 4.9 PESSIMISTIC 1.2 1.8 11.1 5.3 5.1 2.2 1.0 2.0 Percent ANNUAL INVESTMENT AS % OF 1997 GOVERNMENT EXPENDITURE Billions of US$
Table 3— Total projected investments, baseline, optimistic, and pessimistic scenarios, 1997–2020
SOURCE: Government expenditures are from World Bank 2000.
Billions of US Dollars
2020 GLOB
AL FOOD OUTLOOK
16
investment expenditures across the developing world, is projected to account for 35 percent of China’s expendi-tures between 1997 and 2020.Agricultural research will account for particularly large shares of China’s and West Asia and North Africa’s total investment expenditures at 35 percent and 31 percent, respectively, and relatively high shares of Southeast Asia’s and Latin America’s total investment expenditures at 27 percent and 26 percent, respectively. Public agricultural research will account for only 7 percent of Sub-Saharan Africa’s total investment expenditures between 1997 and 2020.
Total investment under the pessimistic scenario declines to US$323 billion, a decline of 44 percent from the baseline level (Table 3).This savings comes at the cost of leaving an additional 46 million children malnourished in 2020. It is possible—indeed, it is necessary, for the health of millions of people—to do even better.The alternative future outlined in the previous section as the optimistic scenario can be achieved if governments and the private sector make a concerted effort to finance significantly larger investments.The optimistic scenario would require a total investment amounting to a 39 percent increase over baseline projections, or US$802 billion between 1997 and 2020.
In the optimistic scenario, the largest single additional investment is in irrigation. Spending on irrigation would almost double compared with the baseline, amounting to US$343 billion between 1997 and 2020. Spending on education would increase by 36 percent from the baseline scenario, with the increases concentrated in Latin America and Sub-Saharan Africa. Investment in rural roads would increase by an additional 7 percent, with larger increases projected in Sub-Saharan Africa.
The most important result of this simulation is not the exact distribution of the incremental investments among these different areas. Equally impressive results can be achieved by investing additional money in roads or agricultural research, for instance, rather than in irriga-tion. Indeed, in combating childhood malnutrition, invest-ments in education and clean water are among the most important factors, in addition to efforts devoted narrowly toward increases in agricultural production.
What this simulation shows is that even this opti-mistic future can be achieved. It illustrates the total investments required to make significant, even dramatic, improvements in the world food situation.These invest-ments represent less than 5 percent of government expenditures in the developing world over the next 20 years.This relatively modest level of commitment would increase food security for millions more people than the business-as-usual baseline scenario.
REGION/COUNTRY
Latin America
West Asia/North Africa Sub-Saharan Africa South Asia India Southeast Asia China Developing countries IRRIGATION 44.8 17.9 28.1 61.3 42.5 18.6 3.2 174.6 RURAL ROADS 36.7 7.3 37.9 27.4 23.5 3.9 6.8 120.3 EDUCATION 12.1 21.5 15.7 14.5 10.5 6.8 2.4 75.9 CLEAN WATER 9.8 8.5 17.3 27.0 18.4 9.4 14.4 86.5 NATIONAL AGRICUL-TURAL RESEARCH 37.0 25.3 8.0 18.0 15.6 14.1 14.6 121.7 TOTAL INVEST-MENTS 140.4 80.5 106.9 148.2 110.5 52.6 41.4 578.9
Table 4—Investments in food security under the baseline scenario, 1997–2020
AL FOOD OUTLOOK
T
he world’s decision makers face a fork in the road.This report shows some of the key policy andinvest-ment decisions that are likely to lead the world in the direction of food security for all and other
decisions likely to lead to increased poverty and malnutrition. Steps toward a future of global food security will have enormous payoffs worldwide, offering all people a higher quality of life and greater economic potential. In contrast, if decision makers fail to reform key policies or make adequate investments—or even if they reduce policy efforts slightly from those described in the baseline scenario—the costs in terms of human misery and wasted potential will be enormous.
Conclusion
One theme echoed throughout this report is intense concern over the future prospects for Sub-Saharan Africa.The pessimistic scenario described earlier, in fact, reflects a future that many experts see as the most likely outcome for Sub-Saharan Africa. Deteriorating natural resources, stagnant technologies, and rising population densities are common features of the rural landscape throughout much of the Sub-Saharan Africa and will be alleviated only with a major structural transformation from subsistence agriculture to a commercialized and highly productive agricultural economy capable of
supporting a growing urban population. Equally important are investments in social services, such as education and health, and broad-based economic growth.Without education and health services, few positive changes are possible or sustainable.Without economic growth in
rural areas as well as in the towns and cities, those who want to or are forced to leave subsistence agriculture will find few opportunities. Sub-Saharan Africa cannot afford to fall further behind in overcoming threats to the health and well-being of its children, but its leaders have shown little sense of urgency and commitment to the challenge of rural development to date.
Better policies and increased investments—not only in Sub-Saharan Africa, but also throughout the developing world—can greatly improve food security for millions of people.The future world will reflect, in profound ways, the choices made by national governments, nongovern-mental organizations, and private companies now and in the coming decades.Those choices will build the world that we will face in 2020.
2020 GLOB
AL FOOD OUTLOOK
18
Notes
1. For details on the methodology, see Mark W. Rosegrant, Michael S. Paisner, Siet Meijer, and Julie Witcover, Global Food Projections to 2020: Emerging Trends and Alternative Futures (Washington, D.C.: International Food Policy Research Institute, 2001).
2. Mark W. Rosegrant, N. Leach, and Roberta V. Gerpacio,“Alternative Futures for World Cereal and Meat Consumption,” Proceedings of the Nutrition Society 58, no. 2 (1999): 219–234.
About the Authors
Mark W. Rosegrant is a senior research fellow in the Environment and Production Technology Division of the International Food Policy Research Institute (IFPRI). Michael S. Paisner is a research assistant at the Carnegie Endowment for
International Peace. Siet Meijer is a senior research assistant in the Environment and Production Technology Division of IFPRI. Julie Witcover is a graduate student at the University of California, Davis.


(NN=2,2 '-bipyridine or 1,10-phenanthroline)](data:image/gif;base64,R0lGODlhAQABAIAAAP///wAAACH5BAEAAAAALAAAAAABAAEAAAICRAEAOw==)