MPRA
Munich Personal RePEc Archive
What blows in with the wind?
Dakshina G. De Silva and Robert P. McComb and Anita R.
Schiller
Texas Tech University
2. December 2013
Online at
http://mpra.ub.uni-muenchen.de/51915/
What blows in with the wind?
Dakshina G. De Silva
yRobert P. McComb
zAnita R. Schiller
xDecember 2, 2013
Abstract
The shift toward renewable forms of energy for electricity generation in the electricity generation industry has clear implications for the spatial distribution of generating plant. Traditional forms of generation are typically located close to the load or population centers, while wind and solar-powered generation must be located where the energy source is found. In the case of wind, this has meant signi…cant new investment in wind plant in primarily rural areas that have been in secular economic decline. This paper investigates the localized economic impacts of the rapid increase in wind power capacity at the county level in Texas. Unlike Input-Output impact analysis that relies primarily on levels of inputs to estimate gross impacts, we use traditional econometric methods to estimate net localized impacts in terms of employment, personal income, and property tax base. While we …nd evidence that both direct and indirect employment impacts are modest, signi…cant increases in per capita income accompany wind power development. County and school property tax rolls also realize important bene…ts from the local siting of utility scale wind power.
JEL Classi…cation: H23, H72, Q42, Q48, R11.
Keywords: wind energy, industry growth, per capita income, tax base.
1
Introduction
The State of Texas produces more wind generated electricity than any other state in the United States. With 12,214 megawatts (MW) of installed wind generation capacity at year-end 2012, Texas has more than twice the production capacity of California, the second largest wind power producing state with 5,544 MW of installed capacity. Over 20 percent of the total installed wind generation capacity of 60,007 MW in the United States at the end of 2012 was located in Texas. The growth of this industry
We would like to thank Geo¤rey Hewings, Xiaoyi Mu, and participants at the Western Economic Association International, 2013 Annual Conference for valuable comments and suggestions. We also would like thank the Texas Workforce Commission for providing the data and the Texas Tech UniversityWind Science and Engineering Research Center for their ongoing research support.
yDepartment of Economics, Lancaster University Management School, Lancaster University, Lancaster, LA1 4YX, UK (e-mail: [email protected]).
zCorresponding author: Department of Economics, Texas Tech University, MS: 41014, Lubbock, TX 79409-1014, (e-mail: [email protected]).
xCentre for Energy, Petroleum and Mineral Law and Policy, Graduate School of Natural Resources Law, Policy and Management, University of Dundee, Nethergate, Dundee, DD1 4HN, UK (e-mail: [email protected]).
in Texas has taken place almost entirely during the last decade. In year 2001, Texas had only 898 MW of installed wind capacity.1
Di¤erences in the spatial distribution of the di¤erent types of utility-scale electricity generation imply a corresponding change in the spatial distribution of employment (at the point of generation) and, possibly, income. Thermal generation, the dominant form of electricity generation, is typically located close to load centers, i.e., more populous areas; whereas wind generation must necessarily be located where the wind resource is found. A casual glance at a wind resource map suggests that these wind resource-rich regions tend to be more rural, exhibiting relatively low population densities. By and large, inland wind resources are found across the Great Plains and along the Eastern Slope of the Rocky Mountains. This has meant, among other things, a sharp uptick in …xed plant in some windy rural areas and increased investment in transmission capacity to exploit the wind resources and deliver the energy to urban consumers.
In this paper, we investigate the localized economic e¤ects of wind power development in Texas. By restricting the analysis to a single state, we have a consistent means by which to consider changes in property tax bases and rates. Rather than relying on an input-output modeling methodology to extrapolate outcomes, we consider the localized spillover e¤ects on other industrial employment, per capita personal income, and changes in county property tax bases and rates using standard regression analysis. We seek to determine what, if any, persistent local bene…ts accrue to the residents of the counties in which the wind power generation is located. Unlike previous research in this area, we conduct an analysis that seeks to observe the nature of employment growth in terms of its industrial composition and the likely inter-industry spillovers. While others have investigaed the e¤ects of natural resource windfalls on the local provision of public goods, no previous e¤ort, to our knowledge, has examined the e¤ects of the such windfalls on county and school tax rates.2
1To scale the size of the wind industry in the U.S., it is noted that wind generated electricity accounted for 3.5
percent of all electricity consumed nationwide in 2012. Shares of state generation depend on capacity as well as market size. Thus, while Texas generates more wind power than any other state, wind generated electricity represented only 7.4 percent of electricity delivered in the state in 2012 (9.2 percent on the Electrical Reliability Council of Texas, ERCOT, grid), ranking Texas at number 11 among all states by this measure.
2See Aragon and Rud (2009), Caselli and Michaels (2013), Michaels (2011), and Naritomi, Soares, and Assunção
We …nd that, at best, direct and indirect employment e¤ects are modest while increases in per capita county personal income can be important. This result implies that gains in personal income come from sources other than wage income such as net lease income for farmers and ranchers. As expected, we …nd that the value of county property tax bases increasesd with increases in installed wind capacity. This appears to enable county governments to reduce tax rates and bene…ts school districts through increased school tax revenues at constant tax rates.
Although we …nd that property tax bases increase with the construction and operations phases of utility scale wind plants, we are unable to observe whether or not the increases in tax capacity result in higher levels of local public goods provision or improvements in the quality of the schools.3 It
should also be noted that, since the utility-scale wind developments are non-locally owned, the lion’s share of bene…ts will accrue outside the locality while many of the costs are borne locally. The e¤ects on (non-migratory) avian populations, noise pollution, degradation of the landscape, and reductions in agricultural and tourism activities that accompany utility scale wind development are detrimental to the welfare of the local residents. The long-term consequences for land-use and the landscape will depend on the disposition of the turbines and their foundations when their economic life is over. We do not correct our impact analysis to take these costs into consideration.
While production technologies and supply chains are clearly quite di¤erent between the di¤erent means of generating electricity, it is not obvious how the substitution of wind power generation for generation by other energy sources will in‡uence overall employment and income in the electricity generation sector. For example, employment in thermal generation of electricity includes activities in fuel extraction, processing and transportation while no fuelper se is required for wind generation. Comparing macro-level employment and income e¤ects from the shift to renewable forms of electricity generation is complex and beyond the scope of this paper.
Of course the substitution of renewable energy sources for fossil fuels provides environmental ben-e…ts in terms of reduced emissions of carbon dioxide, sulfur dioxide, and mercury. These are for the
3In a strand of literature that looks at the e¤ects of resource windfalls on government behavior, Caselli and Michaels
(2013) look at o¤shore oil royalties to municipalities in Brazil. While they …nd that municipalities report higher levels of spending commensurate with the windfalls, the actual provision of public goods and infrastructure appears to change very little, if at all.
most part global bene…ts. Moreover, wind power does not require water to generate electricity, a big advantage in Texas and the Southwest. No e¤ort is made to quantify the broader environmental value of substituting wind power for gas or coal-powered generation nor is any attempt made to establish the e¤ect on market prices of electricity of mandated changes in the electrical generation portfolio.
The paper is organized as follows. Section 2 provides a discussion of the economic and institutional context with a brief literature review. Section 3 describes the model and data that are used to estimate the localized economic impacts. Section 4 contains the results of the estimations and Section 5 provides a brief discussion and conclusions.
2
The Economic and Institutional Context
The growth in wind power in Texas, as in the United States, appears to have resulted primarily from the presence of the high quality wind resource, improvements in turbine performance, and the assured, ex ante availability of the federal Production Tax Credit (PTC) that was enacted in 2006.4
Since installed capacity in Texas has already exceeded the requirements of the state’s 2025 Renewable Portfolio Standard (RPS), the RPS does not help to explain the rapid increase in capacity.5 Nor
does the creation of tradable Renewable Energy Certi…cates (RECs) in 1999 provide much help. The acceleration in wind development occurred after the price of RECs collapsed in early 2006 from over $10 to around $3 per MWh.
Although the Texas Legislature does not explicitly refer to the economic development impact of installing wind capacity in West Texas in the bills that enacted and expanded the state’s RPS, it has nevertheless been widely recognized as a signi…cant bene…t mostly as a consequence of growth in school and property tax base. Employment considerations are important in rural counties that have been losing jobs and population for decades. Activities that bring new vitality to these communities are of course particularly welcome in these rural areas. For this reason, wind developers in Texas have met little local resistance to siting the turbine …elds.
4Gulen, et al. (2009), Wiser et al. (2007).
5The original RPS passed in 1999 mandated 2000 MW by 2009. In 2005, the RPS was amended to mandate 5,880
The State of Texas has also encouraged the development of wind power in the state by extending and deepening the transmission infrastructure and ensuring a receptive regulatory environment with a competitive electricity market. Indeed, continued growth of wind power has rather been constrained by the lack of high voltage transmission from the areas with high quality wind resources to the load centers in the eastern half of Texas within the grid operated by the Electrical Reliability Council of Texas, or ERCOT. The potential for expansion of productive capacity encouraged the Texas Public Utility Commission (PUC) in collaboration with ERCOT to move forward with the construction of high voltage transmission lines to connect the wind resources in …ve designated Competitive Renewable Energy Zones (CREZs) in West Texas (primarily in the Texas Panhandle and Trans-Pecos regions) to load centers in East Texas and to relieve east-west congestion. The so-called CREZ transmission line build-out is scheduled for completion in 2013 and, while reducing present curtailments, should bring a substantial amount of additional wind power onto the ERCOT grid as construction of the transmission lines is completed.
The electricity system in Texas is unique in the United States insofar as the main Texas interconnec-tion, operated by ERCOT, has no synchronous ties to either the Eastern or Western Interconnections.6 Since the ERCOT grid is wholly contained within the state, and has no AC ties to grids outside the state, ERCOT is exempt from most federal regulatory authority –primarily that vested in the Federal Electricity Regulatory Commission (FERC). But not all of Texas falls within the ERCOT domain. Most of the Panhandle and much of the South Plains is within the Southwest Power Pool (SPP) while the corner of the state that contains El Paso is in the grid operated by the Western Electricity Co-ordinating Council (WECC). Looking at a map of wind development in the state, the e¤ects of this anomaly are clear. That is, much of the eind energy development has taken place along the edges of the ERCOT boundary closest to the wind resources in the South Plains and Panhandle regions, and has been slow to develop in the regions (most notably the Panhandle) with higher quality wind resources due to the lack of market and interconnection. Transmission from the Panhandle of Texas
6ERCOT has 5 DC ties of which 2 interconnect with the Eastern Interconnection through the SPP and 3 are located
along the Texas-Mexican border. ERCOT also maintains a diesel generator in Austin for the event a "dark start" is ever necessary.
to the principal SPP load centers in Oklahoma City and Kansas City has been limited. For most of the utility-scale wind generation facilities located outside the ERCOT grid, dedicated transmission lines have been built to deliver the power into ERCOT.7 An interesting facet of this has been that
none of the wind power generated in utility-scale facilities located in the non-ERCOT regions that have transmission connections to ERCOT is delivered locally or to entities in the SPP. This is because a wind generator that delivers power into both ERCOT and another interconnection would imply a de facto ERCOT synchronous tie to a non-ERCOT grid and thus bring ERCOT under FERC authority. To underscore the e¤ect of the ERCOT boundary and the rural nature of the location of the wind generation, seven counties along the northwestern edge of the ERCOT region, Borden, Coke, Fisher, Nolan, Runnels, Scurry, and Taylor, combined in 2012 to host 3,836 MW of wind generation capacity, or nearly one-third of the total state capacity. Excluding Taylor County, in which Abilene is located, the combined total employment in 2012 in the other six counties was 23,828 according to the Texas Workforce Commission.
Further to this point, most of the areas where wind power development has occurred are rural with predominantly (pre-wind power) agricultural economies. Even for counties within the ERCOT grid, local demand for electricity is typically a fraction of the locally generated wind power. Wind power development has occurred with the purpose of export of the electricity from the regional economy and has not measurably displaced regional generation capacity for local consumption. Employment e¤ects from the substitution of wind generated electricity for thermally generated electricity, if they occur, would be mostly observed in the eastern portion of the state.
Based on the authors’experience in West Texas, there is a popular view that development of wind power brings signi…cant local economic bene…ts. An online article originally published in 2009 by WorldWatch Institute entitled “In Windy West Texas, An Economic Boom” describes the economic impact of wind power in Sweetwater, TX, a city in Nolan County where extensive wind development has occurred. The article states, “The wind industry boom has stimulated job growth across the
7Xcel Energy has purchased wind power for delivery in the SPP from Texas generators in the Panhandle region: the
Wildorado Wind Ranch (161 MW) located in Potter/Randall/Oldham Counties, Spinning Spur (161 MW) located in Oldham County, and White Deer (80 MW) in Carson County. None of the electricity from these three plants has been delivered into ERCOT.
entire local economy. Some 1,500 construction workers are engaged in Nolan County’s …ve major wind energy projects. Building permit values shot up 192 percent in 2007 over 2001 values. Sales tax revenues increased 40 percent between 2002 and 2007. The county’s total property tax base expanded from $500 million in 1999 to $2.4 billion this year.” The article quotes Jacque McCoy, the executive director of the Sweetwater Chamber of Commerce, “I’ve seen us in good times and not so good times. The wind energy has just revitalized Sweetwater, Texas, and really all of Nolan County.”
The notion that large scale wind development in relatively rural counties will have a signi…cant localized economic impact is indeed persuasive. Brown et al. (2012) suggest several avenues by which wind power development can a¤ect its local economy. Five of the eight ways they suggest seem relevant to the Texas context. 1) Wind generation provides a direct source of employment. This employment may be associated with the construction phase of the project and, thus, be temporary; or it may be permanent jobs associated with ongoing O&M once the turbines are fully commissioned. 2) Both construction and operations activities may generate demand for locally produced/distributed inputs. 3) Landowners who lease land to situate the turbines enjoy lease income. It is important to recognize that this land typically has alternative agricultural uses and thus the lease income needs to be viewed as the net income bene…t, presumed positive, after correcting lease revenues for the foregone agriculturally-derived income. Denholm et al. (2009) report that wind turbines displace on average 0.74 acres of land per MW of installed capacity; Reategui and Hendrickson (2011) reference a 2008 DOE report that found that wind power uses between 2-5% of the total land area. Moreover, it seems intuitively likely that forward and backward localized linkages in these agricultural economies are stronger and more developed for the agricultural land-use than for wind power. 4) The turbines contribute to the local property tax base and yield increased tax revenues ceteris paribus to local tax jurisdictions. 5) The localized consumption spending from the increases in personal income that accrue to workers and landowners can provide a boost to local retail and service providers.
Most of the recent economic impact studies of wind energy in the literature have utilized input-output modeling methodologies to estimate gross impacts and have been based on the state-level as impact study area (Tegen (2006), Lantz and Tegen (2011), Keyser and Lantz (2013)). These studies, by
and large, have used the JEDI (Jobs and Economic Development Impact) model, a spread-sheet based input-output model developed by a private contractor for the National Renewable Energy Laboratory (NREL). JEDI utilizes the Minnesota IMPLAN database and enables the user to conduct impact analyses for a given scale of wind power development.8 The limitations of input-output modeling are
well known and become more problematic as the study area decreases in size and industrial diversity. State-level impact analyses re‡ect the greater industrial diversity and potential for in-area sourcing of inputs than would be the case in a county-level analysis. Aside from the assumptions of constant returns to scale, …xed-input proportions technologies in all industries and perfectly elastic factor responses, a signi…cant amount of project-speci…c knowledge and familiarity with the local industrial base and sourcing patterns is necessary to calibrate the models’parameters for credible results to emerge from the exercise. The shelf” JEDI model is based on state-level multipliers. Use of the “o¤-the-shelf” model, i.e., no adjustments for the actual local production and sourcing of requisite specialized inputs, labor market conditions, sales margins, etc., can readily lead to over-stated impacts.
Slatteryet al(2011) estimate economic impacts for two large utility-scale wind projects in Texas at both the state-level and the smaller area (contained in Texas) of the region within 100 miles of each of the two wind developments. At the state level in Texas, as they note, growth in wind power equipment manufacturing and specialized construction …rms has increased the potential for more Texas-based value-added in the wind development supply chain. They use JEDI –but adjust the model parameters to re‡ect speci…c information they obtained for each project– to consider two wind plants, Horse Hollow (735.5 MW), in Nolan/Taylor Counties, and Capricorn Ridge (662.5 MW), in Coke/Sterling Counties. Nolan/Taylor Counties are both more populous and industrially diversi…ed than the very rural Coke/Sterling Counties. State-level estimates of the impacts normalized to the MW unit do not of course di¤er much between the two projects. Their estimates of the smaller region gross impacts di¤er somewhat in terms of induced impacts as a result of the di¤erent industrial pro…les of the two counties. During each of the projected 20 years of the operations phase, they estimate 128 (.174/MW)
8http://www.nrel.gov/analysis/jedi/about_jedi.html The JEDI model has been expanded to include economic impact
FTE’s for Horse Hollow and 97 (.146/MW) FTE’s for Capricorn Ridge.
Reategui and Henderson (2011) conduct an economic impact analysis that looks at …ve speci…c wind projects in Texas using JEDI, with results scaled to 1000 MW of installed capacity over the statewide study area. Their estimates of local shares of construction and input costs thus refer to Texas rather than the smaller locality of the project. Even with this broader impact area, the authors estimate that 80 percent of the project construction cost is sourced from out-of-state. Of total O&M costs, they estimate that 14.1 percent goes toward labor/personnel costs. Their results suggest that between 140 and 240 localized jobs are associated with 1000 MW of wind power during the operation phase of a project. This estimate of the county-level employment impact would depend on how their estimate of 100 local jobs in equipment and supply chain sectors is allocated between the state-level (non-local county) and the county level. Consistent with other estimates, they found that annual land lease payments average approximately $5,000 per MW such that 1000 MW of wind generates about $5 million per year in lease income for farmers and ranchers and the present value (for project life of 20 years) of property tax payments is around $7 million per 1000 MW of wind development.9
The impression that emerges from looking at economic impact analyses for wind projects is that there are important localized e¤ects on employment and income, at least in the construction phases. For the many reasons enumerated above, however, one should view these results in the proper context. First and foremost, these projects do not attempt to measure net localized e¤ects, i.e., correct for declines in employment and income in other sectors as wind development attracts workers and (poten-tially) increases wages. Studies conducted by industry advocates, in particular, must be approached with caution since they emphasize gross e¤ects. For example, in the WorldWatch Institute article quoted above, they quote a study released by the West Texas Wind Energy Consortium that found that an estimated 1,124 of Nolan County’s 14,878 residents, or nearly 8 percent, have jobs directly related to wind energy. This …gure includes employment in all wind-related industries, i.e., it includes construction, manufacturing, service sectors, etc. Nevertheless, this translates to about 15.6 percent of the establishment-based 2012 employment in Nolan County.
A casual look at Nolan County employment totals, however, suggests there may have indeed been crowding out of other activities. According to the Texas Workforce Commission, the total employment in Nolan County increased from 6,972 in 2000 to 7,195 in 2012, or about 223 employed persons.10
This represents growth of a little more than 3 percent, compared to growth in total employment in Texas (including Nolan County) of 18.6 percent. This is of course an unconditional comparison, but nevertheless providesprima facie evidence of a modest net e¤ect of the wind power industry on overall county employment relative to a substantial gross e¤ect. A back of the envelope calculation (that ignores income and welfare considerations) leads to a simple conclusion that some 1200 jobs in pre-wind power employment must have been lost between 2000 and 2012. Whether this re‡ects wind energy employment that is crowding out or saving the day for Nolan County would require an analysis that is not the immediate subject of this paper.
Some skepticism toward a substantial net positive long-run impact from development of the wind resource may be warranted. In a cross-country comparison over the period 1970-1990, Sachs and Warner (1997) …nd a negative association between countries’growth rates and their ratios of natural resource exports to GDP. In lieu of the input-output modeling methodology, Brown et al. (2012) conduct an econometric analysis as a means of measuring thenetcounty-level economic impact of wind power in the central United States. They regress changes in county per capita income and employment on changes in MW per capita of installed wind capacity between 2000 and 2008 in 1009 counties located across the Great Plains. Their results lead them to conclude that for every MW of installed wind power capacity, total county personal income increased by $11,150 and county employment increased by 0.482 jobs over the eight year period. From this, they inferred a median increase of 0.22% in total county personal income and 0.4% in employment in counties with installed wind power. These conclusions are based on coe¢ cient estimates that were only weakly statistically signi…cant. They note that their
1 0This seems reasonable for new direct employment in wind power production if all else were unchanged. Nolan
County has something on the order of 2000 MW of installed capacity which, according to Reategui and Hendrickson’s conclusion, should result in 280-480 jobs during the operations phase of the wind turbines. The West Texas Wind Energy Consortium is reported by the WorldWatch Institute as having estimated 0.13 jobs per MW in the operations phase of the project, or slightly less than Reategui and Hendrickson. At $5000/MW in lease revenue, this represents $10 million per year in lease income to landowners.
results are in line with input-output derived estimates.
There is no doubt that utility-scale wind development represents signi…cant new …xed plant and, thus, increases in the county property tax rolls. This should translate into increased property tax revenues, at constant tax rates, in the tax jurisdictions where the wind plant is located. However, much of the literature that looks at levels of local public goods following …scal windfalls at the local or municipal level …nds that the …scal bene…ts fail to reach the local population. Caselli and Michaels (2013) report that oil revenues accruing to Brazilian municipalities appear to increase local spending levels but actual changes in real social expenditures and household income are much more modest and, in fact, may not even occur. There is also the question of the "‡ypaper e¤ect" if one thinks of these natural resource-based …scal windfalls as having some equivalence to a permanent increase in transfers from either the state or federal government.11 In the absence of a ‡ypaper e¤ect, or some partial e¤ect,
the new revenue streams to county governments and school districts should result in tax reductions. However, Olmsted, Denzau, and Roberts (1993) …nd that Missouri school districts tended to increase operating budgets so as to o¤set the reductions in debt payments that occurred as debt issues were retired. As a result, even though debt service declined, total revenue needs did not and tax rates were left unchanged. A windshield survey in the newly developed wind resource counties of West Texas would probably lead most people to conclude that school districts have recently undertaken a large amount of construction and renovation of school and related facilities that would not have otherwise occurred (at this scale). By the same token, it seems quite likely that investments in rural school infrastructure have been lagging behind their urban counterparts in Texas and allocating new resources in these districts is quite justi…ed.
We now turn as well to the econometric modeling of the economic impacts of wind power in Texas. We consider, in turn, industry employment spillovers, personal income, and impacts on the total assessed value of the county property tax base and tax rates.
1 1Hines and Thaler (1995) attribute the term "‡ypaper e¤ect" to Arthur Okun, and it describes the tendency for …scal
transfers from the federal government to state or local governments to often result in commensurate increases in local spending, i.e., the transfer tends "to stick."
3
Data and Estimations
The matter of direct localized employment impacts seems reasonably well established in the input-output literature. That is, direct local employment during the operations phase of a wind plant is on the order of 0.13 - 0.14 jobs per MW, or 130-140 jobs per 1000 MW. This is in fact a veri…able outcome if private employment records were made available. Total net localized e¤ects are another matter. Predicted outcomes from input-output modeling are gross e¤ects and determined by the model’s parameters and input levels. County-level net e¤ects are observableex post through empirical means. This point is made by Brown et al (2012) who empirically estimate the e¤ect on total county employment, …nding that the sum of the direct, indirect, and induced e¤ects is about three times the direct employment impact.12 This in turn suggests measurable spillover e¤ects in other industries in
the counties in which large scale wind plant is located.
3.1
Data
Our primary data for the number of establishments and average payrolls by industry are compiled from the Quarterly Census of Employment and Wages (QCEW) for Texas. Prior to 2007, the QCEW data were not publicly available. The authors were provided the QCEW data for Texas for the years 1998-2006 by the Texas Workforce Commission. There were changes to the QCEW industry con…guration in 2007. We are assuming that industry de…nitions remain consistent at the two-digit level. Wind energy capacity by county and year of commissioning were available from ERCOT in the Capacity, Demand and Reserves Report for 2012 and from the Xcel Energy corporate website.13
Texas general fund county property tax rates were taken from the County Information Program, Texas Association of Counties, from data supplied by the Texas Comptroller of Public Accounts. Our property and school district level taxable values (assessed property value or total tax base) and tax rates are gathered from the Texas Education Agency. Note that the school districts do not correspond
1 2In the language of impact analysis, direct localized employment would the jobs of the on-site (in-county) workers
at the turbine facility or its management o¢ ces, indirect employment would the workers engaged in wind power supply chain jobs, and induced employment is the localized e¤ect of the spending of wages, salaries, lease revenue, etc., in the county. Induced employment would be observed, for example, in the hospitality industries, retail, services, etc.
to county divisions. However, all school districts are contained within a single county and all area of all the counties are within a school district. We only observe total installed wind capacity at the county level. Since we are unable to observe exact locations of the turbines, we can not apportion them across the school districts within any given county. Therefore, although we can observe property tax base values at the districtt-level, we aggregate all school districts in a county to report school district variables at the county-level. Thus, school tax rates are averaged to county-level by the weighted average of the individual ISD tax rates using school district shares of total county level tax receipts as weights. This method of aggregation will result in an under-estimation of property tax base impacts at the level of the school districts in which the turbines are actually sited and an over-estimation for those districts without wind power that are located in a wind county. A concomitant to this issue is that the e¤ect of using the average tax rate for the districts in a county will also tend to over or under-estimate actual rates for the speci…c school districts in wind counties. County level annual personal income, unemployment rates, and populations are compiled from the U.S. Department of Commerce Bureau of Economic Analysis and the Bureau of Labor Statistics.
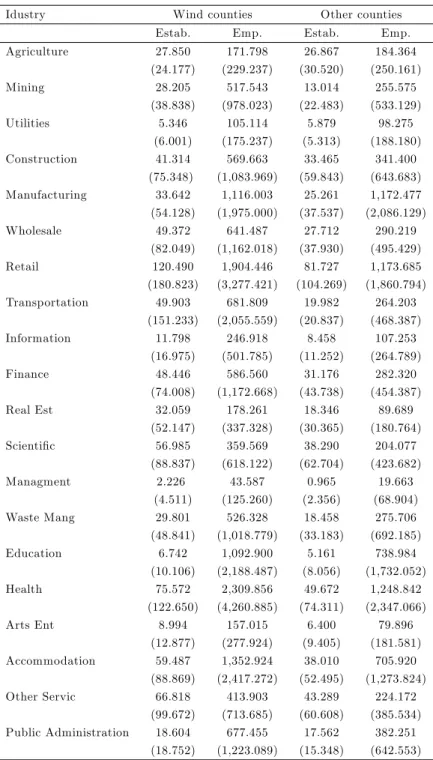
Table 1 presents two digit NAICS industry level data for wind energy generation counties and subset of the counties in TX. We believe the acuity of the analysis is enhanced if we narrow the comparison between wind and non-wind counties to those counties that had some degree of similarity at the the beginning of the study period. Since wind development has taken place in the relatively rural counties, it would be innappropriate to compare outcomes between the relatively static rural counties and the urban counties that have enjoyed substantial population and employment growth over the period from factors unrelated to wind power. Speci…cally, we exclude counties with populations less than 421 or greater than 200,347 in 2001 (the largest wind county by population) or per capita personal income less than $13,865 or greater than $30,804 in 2001 (the highest value among the wind counties). This restriction reduces the number of counties used in the anlaysis from 254 to 222. The excluded counties are the more populous counties found along the I-35 corridor (the Dallas-Fort Worth, Austin/San Antonio, and Houston metropolitan areas), the (Rio Grande) Valley region of Texas, El Paso, Lubbock, and Midland. One county, Loving County, with a 2001 population of 72, failed meet
Table 1: Number of establishments and employees by industry
Idustry Wind counties Other counties Estab. Emp. Estab. Emp. Agriculture 27.850 171.798 26.867 184.364 (24.177) (229.237) (30.520) (250.161) Mining 28.205 517.543 13.014 255.575 (38.838) (978.023) (22.483) (533.129) Utilities 5.346 105.114 5.879 98.275 (6.001) (175.237) (5.313) (188.180) Construction 41.314 569.663 33.465 341.400 (75.348) (1,083.969) (59.843) (643.683) Manufacturing 33.642 1,116.003 25.261 1,172.477 (54.128) (1,975.000) (37.537) (2,086.129) Wholesale 49.372 641.487 27.712 290.219 (82.049) (1,162.018) (37.930) (495.429) Retail 120.490 1,904.446 81.727 1,173.685 (180.823) (3,277.421) (104.269) (1,860.794) Transportation 49.903 681.809 19.982 264.203 (151.233) (2,055.559) (20.837) (468.387) Information 11.798 246.918 8.458 107.253 (16.975) (501.785) (11.252) (264.789) Finance 48.446 586.560 31.176 282.320 (74.008) (1,172.668) (43.738) (454.387) Real Est 32.059 178.261 18.346 89.689 (52.147) (337.328) (30.365) (180.764) Scienti…c 56.985 359.569 38.290 204.077 (88.837) (618.122) (62.704) (423.682) Managment 2.226 43.587 0.965 19.663 (4.511) (125.260) (2.356) (68.904) Waste Mang 29.801 526.328 18.458 275.706 (48.841) (1,018.779) (33.183) (692.185) Education 6.742 1,092.900 5.161 738.984 (10.106) (2,188.487) (8.056) (1,732.052) Health 75.572 2,309.856 49.672 1,248.842 (122.650) (4,260.885) (74.311) (2,347.066) Arts Ent 8.994 157.015 6.400 79.896 (12.877) (277.924) (9.405) (181.581) Accommodation 59.487 1,352.924 38.010 705.920 (88.869) (2,417.272) (52.495) (1,273.824) Other Servic 66.818 413.903 43.289 224.172 (99.672) (713.685) (60.608) (385.534) Public Administration 18.604 677.455 17.562 382.251 (18.752) (1,223.089) (15.348) (642.553) Standard deviations are in parentheses.
Table 2: Regression variables
Variables All Wind counties Other counties Number of Counties 222 31 191
Construction phase 0.010 0.073 0.000 (0.098) (0.261) (0.000) Wind energy capacity 19.680 135.417 0.000
(107.604) (249.594) (0.000) Taxable value 501.322 914.219 434.308 (in millions of $) (796.628) (1,462.753) (598.521) Property tax rate 0.536 0.510 0.540
(0.160) (0.141) (0.163) School revenue 20.561 24.539 19.908 (in millions of $) (25.360) (28.977) (24.655) School tax rate 1.305 1.305 1.305
(0.186) (0.173) (0.188) Average daily attendance 5,360.226 7,507.205 5,011.763
(7,488.689) (12,218.867) (6,331.293) Unemployment rate 5.783 5.600 5.823 (2.044) (1.743) (2.091) Population 27,099.448 37,243.261 25,943.962 (36,472.121) (54,286.283) (32,953.749) Average wage ($) 23,395.954 23,206.943 23,426.631 (16,142.080) (15,854.779) (16,188.206) Average income ($) 23,968.644 24,854.357 23,824.889 (4574.246) (5,738.567) (4339.081) MSA central county 0.279 0.387 0.262
(0.449) (0.487) (0.440) MSA outlying county 0.185 0.194 0.183
(0.388) (0.395) (0.387) Standard deviations are in parentheses.
the minimum values.14
One observes that wind counties, on average, have only a slightly higher number of establishments and employees than the average control county. The largest disparities are in the wholesale, retail, scienti…c, transportation, and health sectors. The similarities between wind counties and non-wind counties are clearer when looking at Table 2. Average wind county population, income, and wages are the same for practical purposes. However, there are contrasting di¤erences are in the value of the property tax base and school revenues. Taxable value and school revenues are higher by about $500 million and $5 million respectively in wind counties compared to non-wind counties. Also, we observe that wind generation counties average daily school attendance is higher by about 2,500 pupils compared to the other counties in the analysis. Finally, average wind generation capacity in wind counties is about 135 MW.
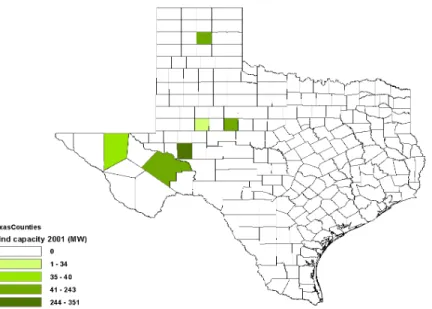
Panel A in Figure 1 represents the distribution of wind generation capacity in 2001. In total, there were only 6 counties with about 900 MW in total capacity. In Panel B we show wind generation capacity by county in 2012. As can be seen, it has increased to 32 counties with total capacity in excess of 12,000 MW. In Figure 2, we show some summary plots depicting the relationship between taxable property value, wind capacity, and property tax rates in the top two panels and school revenues, school tax rates, and wind capacity in the bottom two panels. We see that total taxable property value is increasing in wind generation capacity while property tax rates (and school tax rates) are decreasing in wind energy generation capacity. However, one should be cautious in interpreting these observations as they are summary plots.15
3.2
Empirical Analysis
3.2.1 Industry E¤ects
As noted, we disaggregate county employment in Texas using annual establishment and employment data by industry within the 20 industrial categories of the NAICS-2 as reported by the Texas Workforce
1 4Excluded counties areBell, Bexar, Brazoria, Cameron, Collin, Dallam, Dallas, Denton, El Paso, Fort Bend, Galveston,
Hansford, Harris, Hemphill, Hidalgo, Je¤erson, King, Loving, Lubbock, Maverick, McLennan, Midland, Montgomery, Nueces, Rockwall, Sherman, Starr, Tarrant, Travis, Williamson, Zapata, and Zavala.
1 5These summary plots are done by l…t command in stata. l…t calculates the prediction foryfrom a linear regression
Figure 1: Wind energy generation counties in Texas
Panel A: Wind energy capacity in 2001
Figure 2: Taxable value, property tax rate, school tax rate, and wind energy capacity
Commission. We are aware of the changes to the NAICS industrial categories that occurred during the course of the decade. However, substantive changes at the NAICS-2 level of aggregation are insigni…cant. We seek evidence of how the localized employment impact of wind development is distributed across the industrial landscape. We look at both the numbers of employed persons and the numbers of establishments in each industrial category in a subset of all wind and non-wind energy generation counties in Texas as described before.
We specify two models for each outcome variable that consider the county changes between 2001 and 2011. One version treats the changes in number the annual average number of establishments and the other treats changes in annual employment by industry over that period. The observed di¤erences in the outcome variables are regressed,inter alia, on the total change in wind power capcity in each county during the shorter period 2001-2010. This method is intended to capture only the persistent e¤ects –those e¤ects observed duirng the …rst full calendar year following the last year of wind power plant commissioning–and to avoid the temporary localized e¤ects associated with the projects’construction phases. While the transient construction impact may be of some interest, it is di¢ cult to observe with much precision using the QCEW. The problem arises because the QCEW data are establishment-based. Since the bulk of the construction activity relies on specialized construction …rms, and few of these …rms are local establishments, the recorded construction employment e¤ects would largely be associated with the external locality in which the employing establishments are located.
We consider the following empirical model:
yc;j;T t1 = 0+ 1 wc;T t1+ x0c;T t1 + z
0
c;j;T t1 +m
0
c +"c;j (1)
Our dependent variable (y) is either the di¤erence in number of establishments or employees between 2001 and 2011 by NAICS-2 per county. Our independent variables can be categorized into four groups: county-level wind capacity (w), county characteristics that vary with time as such as unemployment rate and population, (x) industry characteristics such as industry speci…c county-level wages (z), and county characteristics that do not vary with time such as MSA central or peripheral county (m). The term"c;j is the error.
T able 3: Regression results for 10 y ear change in n um b er of establishmen ts P a n e l A V a ri a b le s N u m b e r o f … rm sc;j ;T 10 t1 A g ri c u lt u re M in in g U ti li ti e s C o n st ru c t. M a n u fa c t. W h o le sa le R e ta il T ra n sp o rt In fo rm a ti o n F in a n c e W in d e n e rg y -0 .4 5 0 * 0 .6 5 7 0 .0 5 5 -0 .2 1 5 -0 .0 8 4 -0 .1 9 4 0 .1 4 2 0 .7 1 7 0 .0 5 9 0 .1 8 2 c a p a c it yc;T 10 t1 (i n 1 0 0 M W ) (0 .2 2 9 ) (0 .4 5 8 ) (0 .0 8 5 ) (1 .5 9 7 ) (0 .2 1 7 ) (0 .4 5 5 ) (0 .7 8 4 ) (0 .9 5 3 ) (0 .2 0 8 ) (0 .6 7 3 ) U n e m p lo y m e n t -0 .3 6 5 -1 .3 4 6 * * -0 .0 1 0 -1 .1 7 3 0 .1 9 1 -0 .6 2 9 -0 .7 9 2 -1 .8 1 9 * -0 .0 4 6 -0 .3 6 5 ra tec;T 10 t1 (0 .4 7 6 ) (0 .5 4 5 ) (0 .1 0 4 ) (1 .4 8 7 ) (0 .3 1 7 ) (0 .5 0 1 ) (0 .7 9 4 ) (1 .0 4 8 ) (0 .1 8 7 ) (0 .6 1 2 ) P o p u la ti o nc;T 10 t1 -0 .0 3 4 0 .4 0 9 * 0 .0 7 9 * * * 4 .7 5 0 * * * 0 .7 6 5 * * * 1 .9 9 9 * * * 3 .7 6 4 * * * 2 .0 1 4 * 0 .4 4 3 * * * 1 .8 8 2 * * * (i n 1 ,0 0 0 ) (0 .0 9 3 ) (0 .2 1 6 ) (0 .0 2 4 ) (0 .8 1 5 ) (0 .1 4 1 ) (0 .2 3 1 ) (0 .2 9 1 ) (1 .1 0 3 ) (0 .0 5 5 ) (0 .2 4 6 ) W a g e sc;j ;T 10 t1 1 .0 6 6 1 .0 9 7 * * 0 .8 3 8 * * * -2 .7 4 1 * 1 .6 6 0 * * * 0 .6 5 9 0 .7 2 8 2 .2 3 1 * * * 0 .1 4 1 1 .0 6 9 (i n 1 0 ,0 0 0 ) (0 .9 0 5 ) (0 .4 7 2 ) (0 .0 9 6 ) (1 .5 1 3 ) (0 .4 3 1 ) (0 .4 6 7 ) (1 .6 5 3 ) (0 .4 7 3 ) (0 .1 2 1 ) (0 .7 8 5 ) M S A c e n tr a l c o u n tyc 4 .9 3 8 * 8 .9 8 0 * * * 1 .6 3 1 * * * 4 8 .8 8 5 * * * 6 .0 1 5 * * * 1 0 .2 4 0 * * * 2 1 .5 5 5 * * * 7 .3 5 0 * 4 .1 9 6 * * * 1 9 .3 1 7 * * * (2 .6 5 8 ) (2 .8 3 3 ) (0 .4 7 9 ) (7 .4 9 3 ) (1 .6 4 0 ) (2 .3 1 5 ) (3 .8 3 1 ) (4 .2 3 9 ) (0 .8 2 5 ) (3 .1 2 7 ) M S A o u tl y in g c o u n tyc -0 .2 2 2 1 .6 9 3 -0 .2 0 5 1 2 .1 8 8 * * 2 .6 3 7 1 .1 4 5 1 .6 7 2 -1 .1 6 3 0 .3 1 1 -0 .0 1 9 (2 .0 5 7 ) (2 .3 2 1 ) (0 .4 5 1 ) (5 .1 8 9 ) (1 .6 2 2 ) (2 .0 9 5 ) (2 .5 2 1 ) (4 .8 1 2 ) (0 .5 9 4 ) (1 .6 8 1 ) O b se rv a ti o n s 2 2 2 2 2 2 2 2 2 2 2 2 2 2 2 2 2 2 2 2 2 2 2 2 2 2 2 2 2 2 R 2 0 .0 3 2 0 .2 0 3 0 .4 4 4 0 .7 1 2 0 .4 8 9 0 .7 4 0 0 .8 3 5 0 .4 1 4 0 .6 1 4 0 .6 9 3 P a n e l B R e a l E st a te S c ie n ti … c M a n a g . W a st e M n g . E d u c a ti o n H e a lt h C a re A rt s E n t A c c o m m o d . O th e r P u b li c a d m . W in d e n e rg y 0 .0 5 8 0 .3 6 0 -0 .0 4 9 -0 .2 0 4 -0 .0 8 9 -0 .0 7 7 0 .2 0 4 1 .4 0 7 -0 .2 1 1 -0 .5 1 0 c a p a c it yc;T 10 t1 (i n 1 0 0 M W ) (0 .2 9 3 ) (1 .1 4 6 ) (0 .0 8 0 ) (0 .5 2 7 ) (0 .1 3 9 ) (0 .9 1 0 ) (0 .1 4 7 ) (1 .0 0 0 ) (0 .8 5 7 ) (0 .3 6 4 ) U n e m p lo y m e n t 0 .0 4 8 -0 .4 6 8 -0 .0 1 1 -0 .0 7 8 -0 .0 7 2 -1 .4 7 6 -0 .1 0 1 -1 .6 8 3 -1 .3 7 7 -0 .0 9 7 ra tec;T 10 t1 (0 .4 2 5 ) (0 .8 0 0 ) (0 .0 8 1 ) (0 .5 4 8 ) (0 .1 9 9 ) (0 .9 4 2 ) (0 .1 3 4 ) (1 .2 8 0 ) (1 .1 1 7 ) (0 .3 6 6 ) P o p u la ti o nc;T 10 t1 1 .3 4 1 * * * 3 .6 3 9 * * * 0 .1 3 0 * * * 1 .7 6 9 * * * 0 .4 7 0 * * * 3 .0 4 2 * * * 0 .5 0 4 * * * 1 .3 7 0 * 3 .1 5 9 * * * 0 .4 2 7 * * * (i n 1 ,0 0 0 ) (0 .2 1 2 ) (0 .4 2 5 ) (0 .0 4 6 ) (0 .2 3 3 ) (0 .0 6 6 ) (0 .4 2 2 ) (0 .0 6 0 ) (0 .7 0 6 ) (0 .5 9 0 ) (0 .0 8 5 ) W a g e sc;j ;T 10 t1 0 .2 4 8 -0 .2 6 3 0 .0 6 2 * 0 .3 8 8 0 .7 4 8 * * 1 .2 4 8 -0 .1 3 4 -3 6 .0 4 6 * * * 0 .4 3 9 1 .5 1 2 * (i n 1 0 ,0 0 0 ) (0 .4 2 5 ) (0 .5 6 5 ) (0 .0 3 2 ) (0 .2 4 1 ) (0 .3 5 6 ) (1 .0 9 5 ) (0 .2 4 8 ) (4 .4 3 2 ) (3 .0 9 0 ) (0 .7 8 2 ) M S A c e n tr a l c o u n tyc 1 0 .9 7 8 * * * 2 0 .9 6 0 * * * 1 .8 8 1 * * * 1 5 .2 4 3 * * * 4 .9 6 1 * * * 2 7 .6 5 1 * * * 4 .3 3 5 * * * 1 3 .6 8 4 * * 2 6 .8 3 2 * * * 8 .2 4 6 * * * (1 .7 7 4 ) (3 .8 9 7 ) (0 .4 6 7 ) (2 .6 7 4 ) (0 .9 4 6 ) (4 .8 9 7 ) (0 .7 3 8 ) (5 .4 6 4 ) (4 .9 9 8 ) (1 .8 3 9 ) M S A o u tl y in g c o u n tyc -0 .6 1 2 2 .1 0 7 -0 .2 9 0 3 .3 4 1 * 0 .9 4 8 3 .8 7 9 0 .4 7 6 -4 .2 3 1 0 .1 7 8 2 .5 4 3 (1 .2 5 1 ) (3 .0 9 8 ) (0 .2 5 7 ) (1 .7 2 0 ) (0 .8 1 1 ) (2 .8 1 2 ) (0 .5 6 4 ) (4 .8 5 6 ) (3 .0 2 6 ) (1 .5 6 9 ) O b se rv a ti o n s 2 2 2 2 2 2 2 2 2 2 2 2 2 2 2 2 2 2 2 2 2 2 2 2 2 2 2 2 2 2 R 2 0 .7 2 1 0 .7 7 1 0 .3 7 8 0 .7 2 2 0 .6 0 9 0 .7 2 8 0 .6 8 9 0 .5 0 9 0 .6 2 7 0 .3 3 2 R o b u st st a n d a rd e rr o rs in p a re n th e se s * * * p < 0 .0 1 , * * p < 0 .0 5 , * p < 0 .1
T able 4: Regress ion results for 10 y ear change in n um b er of emplo y ees P a n e l A V a ri a b le s N u m b e r o f e m p lo y e e sc;j ;T 10 t1 A g ri c u lt u re M in in g U ti li ti e s C o n st ru c t. M a n u fa c t. W h o le sa le R e ta il T ra n sp o rt In fo rm a ti o n F in a n c e W in d e n e rg y -1 0 .7 9 6 4 .9 6 4 -2 .1 4 5 9 .9 4 2 3 3 .1 9 3 * * 0 .5 8 6 3 4 .5 7 1 * * * -7 .5 9 0 -1 .5 3 0 1 0 .5 4 5 c a p a c it yc;T 10 t1 (i n 1 0 0 M W ) (9 .1 9 0 ) (1 9 .1 5 7 ) (1 .5 1 8 ) (2 3 .3 3 4 ) (1 5 .3 8 5 ) (6 .1 3 0 ) (1 1 .6 4 2 ) (8 .0 8 1 ) (3 .6 0 9 ) (8 .8 2 4 ) U n e m p lo y m e n t 4 .9 7 4 -3 2 .5 6 1 * 0 .1 3 5 -2 8 .5 4 2 5 1 .1 1 0 -3 .3 3 2 2 .7 4 6 -1 8 .9 3 0 * -0 .2 3 2 -2 .2 3 5 ra tec;T 10 t1 (6 .7 3 4 ) (1 9 .5 8 2 ) (2 .5 4 3 ) (2 1 .7 1 5 ) (3 5 .8 2 9 ) (1 0 .4 2 1 ) (1 6 .0 1 2 ) (1 0 .2 8 6 ) (3 .8 4 4 ) (7 .1 4 9 ) P o p u la ti o nc;T 10 t1 -0 .0 0 7 1 1 .4 9 0 * 1 .1 2 4 * 3 5 .9 0 6 * * * -1 7 .0 2 9 1 3 .6 7 3 * * * 5 2 .6 6 7 * * * 2 3 .1 9 7 * * * 3 .2 5 1 * * * 0 .2 3 0 (i n 1 ,0 0 0 ) (0 .6 9 0 ) (6 .5 5 9 ) (0 .5 7 8 ) (8 .8 5 3 ) (1 8 .5 5 2 ) (4 .3 6 4 ) (1 0 .1 0 5 ) (7 .0 0 4 ) (1 .1 8 9 ) (3 .6 9 3 ) W a g e sc;j ;T 10 t1 4 .4 5 2 3 8 .6 4 7 * * 2 1 .2 9 7 * * * 1 6 .6 9 7 9 9 .6 9 7 * 1 4 .9 3 2 7 3 .5 5 7 2 9 .8 1 3 * * * 2 .7 8 8 5 .8 8 7 (i n 1 0 ,0 0 0 ) (1 0 .6 9 6 ) (1 7 .4 5 4 ) (3 .2 5 9 ) (1 8 .5 6 8 ) (5 6 .8 6 4 ) (1 1 .4 4 6 ) (6 1 .1 2 9 ) (6 .5 4 7 ) (2 .1 0 8 ) (7 .6 9 6 ) M S A c e n tr a l c o u n tyc -1 6 .3 0 6 2 6 5 .9 9 0 * * 2 0 .4 0 5 * 6 0 5 .9 8 3 * * * -2 4 0 .6 9 9 1 3 0 .8 8 8 * * -3 7 .9 3 5 1 1 9 .6 9 6 * * -4 2 .6 3 2 6 2 .4 4 0 (2 9 .2 5 4 ) (1 0 8 .6 0 8 ) (1 0 .5 6 9 ) (1 2 8 .4 8 4 ) (2 1 9 .0 4 8 ) (5 3 .2 5 5 ) (1 3 1 .8 1 5 ) (5 7 .1 6 7 ) (3 2 .2 9 9 ) (3 8 .9 4 1 ) M S A o u tl y in g c o u n tyc -1 4 .3 3 3 3 7 .1 2 9 -8 .2 7 2 2 9 .1 9 2 3 3 3 .2 8 1 * * 3 8 .2 2 4 -2 .4 4 7 1 2 .8 3 1 -1 .5 9 1 1 7 .6 3 5 (1 9 .0 3 4 ) (8 7 .9 4 9 ) (1 4 .4 0 1 ) (5 2 .5 2 4 ) (1 5 4 .0 0 1 ) (4 0 .2 3 8 ) (5 8 .3 7 7 ) (4 3 .9 6 7 ) (9 .8 0 7 ) (2 6 .1 1 8 ) O b se rv a ti o n s 2 2 2 2 2 2 2 2 2 2 2 2 2 2 2 2 2 2 2 2 2 2 2 2 2 2 2 2 2 2 R 2 0 .0 1 9 0 .1 3 7 0 .3 2 9 0 .4 2 4 0 .0 5 7 0 .2 0 4 0 .4 2 2 0 .4 5 0 0 .0 4 7 0 .0 2 8 P a n e l B R e a l E st a te S c ie n ti … c M a n a g . W a st e M n g . E d u c a ti o n H e a lt h C a re A rt s E n t A c c o m m o d . O th e r P u b li c a d m . W in d e n e rg y 0 .9 5 5 3 .3 9 6 -2 .6 0 8 * 1 8 .4 0 2 -1 0 .6 2 3 1 3 .0 8 9 -1 .6 7 3 3 8 .8 8 1 * * 1 .1 7 2 1 .2 6 1 c a p a c it yc;T 10 t1 (i n 1 0 0 M W ) (2 .2 5 4 ) (8 .2 4 3 ) (1 .4 9 5 ) (1 3 .1 8 7 ) (2 4 .7 3 1 ) (1 9 .3 3 0 ) (2 .0 4 2 ) (1 8 .9 5 1 ) (3 .5 9 0 ) (2 0 .6 7 9 ) U n e m p lo y m e n t -0 .9 1 2 -1 1 .2 6 7 * 3 .2 3 2 1 2 .8 1 6 4 5 .7 5 4 -5 5 .4 5 7 * 1 .2 3 5 -2 4 .9 2 3 2 .0 8 2 1 7 .3 7 2 ra tec;T 10 t1 (3 .5 9 1 ) (6 .1 6 4 ) (2 .9 3 4 ) (2 8 .6 1 1 ) (7 8 .5 1 7 ) (2 8 .2 4 1 ) (2 .2 4 0 ) (2 3 .4 6 1 ) (5 .1 2 3 ) (1 8 .1 8 1 ) P o p u la ti o nc;T 10 t1 3 .9 0 9 * * 1 7 .0 1 7 * * * 2 .5 7 7 * * 2 2 .9 9 7 * * * 1 3 5 .2 2 1 * * * 5 2 .1 0 1 * * * 5 .4 8 6 * * * 1 5 .3 9 4 1 4 .0 7 7 * * * 1 0 .6 8 8 * (i n 1 ,0 0 0 ) (1 .9 1 4 ) (2 .3 9 2 ) (1 .2 1 2 ) (7 .4 2 4 ) (4 9 .9 1 7 ) (1 3 .3 3 1 ) (1 .4 6 3 ) (1 2 .0 3 0 ) (2 .4 9 6 ) (6 .2 8 8 ) W a g e sc;j ;T 10 t1 1 0 .9 6 3 * * 1 6 .9 5 4 * * 0 .9 8 5 1 .8 1 5 1 5 9 .9 0 2 * * -2 2 .4 3 0 -1 .8 1 2 -6 0 5 .0 7 0 * * * 2 1 .6 8 8 1 3 2 .0 3 0 * * (i n 1 0 ,0 0 0 ) (4 .9 3 9 ) (7 .5 2 4 ) (0 .9 0 6 ) (3 .6 7 7 ) (7 7 .2 1 3 ) (4 1 .1 1 5 ) (1 .7 8 3 ) (1 0 5 .5 9 2 ) (1 3 .6 3 3 ) (5 7 .6 6 6 ) M S A c e n tr a l c o u n tyc 4 3 .8 2 7 * * 1 2 4 .5 3 3 * * * 4 0 .7 1 2 * * 4 6 .5 5 1 7 5 9 .9 9 0 * * * 1 1 4 .5 1 2 2 9 .5 2 2 * * * 5 9 .2 5 6 7 1 .8 5 9 * * * 1 8 9 .4 6 2 (1 7 .1 1 6 ) (3 7 .3 9 9 ) (1 8 .3 7 4 ) (1 3 3 .6 4 1 ) (1 8 7 .0 6 1 ) (1 6 6 .9 7 4 ) (1 1 .3 4 4 ) (1 1 5 .0 3 6 ) (2 6 .3 3 4 ) (1 1 6 .4 7 6 ) M S A o u tl y in g c o u n tyc -6 .1 6 7 5 .4 9 5 -1 8 .1 0 8 * * -5 3 .5 6 9 -1 1 4 .8 4 2 1 2 2 .0 6 9 -1 1 .0 6 1 -8 4 .9 6 0 -1 4 .9 5 0 5 5 .4 8 0 (1 2 .1 1 3 ) (1 8 .0 0 3 ) (7 .5 2 6 ) (4 5 .1 6 9 ) (2 7 6 .4 5 4 ) (9 3 .0 1 7 ) (9 .3 9 1 ) (8 1 .1 3 8 ) (1 5 .7 5 6 ) (5 2 .5 9 7 ) O b se rv a ti o n s 2 2 2 2 2 2 2 2 2 2 2 2 2 2 2 2 2 2 2 2 2 2 2 2 2 2 2 2 2 2 R 2 0 .2 2 9 0 .5 6 8 0 .1 6 8 0 .2 0 6 0 .4 5 4 0 .3 5 0 0 .4 0 9 0 .3 7 8 0 .5 9 8 0 .1 3 1 R o b u st st a n d a rd e rr o rs in p a re n th e se s * * * p < 0 .0 1 , * * p < 0 .0 5 , * p < 0 .1
Table 3 contains regression results for di¤erences in the number of establishments across the 20 industries at 2-digit NAICS between the beginning and end of the study period. In terms of numbers of establishments, only one, agriculture, appears to be a¤ected by the wind development that occurred over the decade. Consistent with the substitution in land-use that wind power implies, the e¤ect on the number of agricultural establishments is negative. Table 4 considers the decade change in growth of total employment, a more interesting comparison than establishments. Employment in manufac-turing, retail, and accomodations appears to have been positively a¤ected by wind development, while employment in managment services has a weakly signi…cant coe¢ cient. Although the number of agri-cultural establishments declines with wind power development, there is no evidence of such a change in employment in agricultural industry activities. It is not unreasonable to suppose that the increase in manufacturing employment is related to the wind power supply chain and, thus, an indirect impact of the growth in wind capacity. It is also worth noting that employment in education shows no e¤ect, suggesting that any localized property and school tax bene…ts from the increase in …xed wind plant did not result in measurable increases in school employment.
3.2.2 County Personal Income
We next turn our attention to the relationship between income and wind energy development. However, we …rst must investigate the question of endogeneity between wind development and county income. It may be that an endogenous relationship exists because, for example, higher income in a county re‡ects a higher level of …nancial or business acumen. Such a county may be better positioned to establish relationships with wind energy developers and increase the likelihood that wind development will occur. On the other hand, given the environmental issues surrounding the siting of wind plant, lower income counties may be more receptive or more likely to seek out wind development. If the initial income level is signi…cant in explaining growth in income up to 2011, i.e., regression toward the mean suggests that counties with lower initial income would grow faster than counties with higher initial income, and income changes could be erroneously attributed to wind development if a signi…cant correlation between wind development and initial income exists. We empirically examine this question
by estimating whether or not initial or year 2001 county characteristics (x) that are unrelated to wind resources (income, in particular) can help to explain installed wind capacity at the end of the sample period. Note that in year 2001, there were only 6 counties producing wind energy with total capacity of less than 900 MW.
Our empirical model is presented in equation 2. Here, the dependent variable is the log of wind capacity in year 2012. Initial conditions (2001) such as per capita income, unemployment rates, and population are represented in the matrix (x) and county characteristics that do not change over time are represented in matrix (m). The variables that do not change over time are modeled by dummy variables. There is a dummy that captures whether the county is in the ERCOT area (1) or not (0), two dummies to identify if the county is a central or peripheral MSA county, and another dummy for the 178 counties with any area that has a wind resource categorized as Class 2 or higher.16
ln(w+ 1)c;T = 0+x0c;t=1&+m0c'+ c (2)
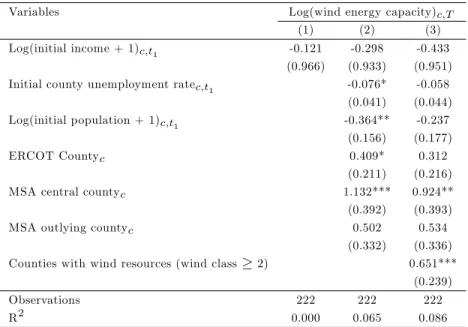
Our results in Table 5 indicate that initial per capita income is not an explanatory factor in the choice of a speci…c county for wind farm location. Not surprisingly, the coe¢ cient of “wind resources” dummy appears to provide all the explanatory power. Note that the presence of the wind resource is exogenous to county location and unchanged over the period of this analysis.
Given this result, OLS will provide an unbiased means to estimate the e¤ect of installed wind generation capacity on county level per capita income. To examine this e¤ect, we estimate county level per capita income as function of installed wind capacity controlling for observable and unobservable county and time e¤ects. Note that the empirical approach will capture net changes to county per capita income due to wind development, i.e., wind power-related changes net of displaced agricultural and other industrial activity-related changes. Consider the following empirical models:
ln(I)c;t= c+ t+ dc;t+ ln s+ 1 pop c;t+$ln w+ 1 pop c;t+x 0 c;t 1&+ c;t (3) 1 6Wind resource classes are determined by both wind density and speed at a particular location and are used to
describe the quality of the location for wind powered electricity generation. The classes range from 1 to 7, with 1 being the least powerful resource. Generally speaking, current turbine technology is best suited for location in a Class 4 regime, or higher, although Class 2 is at the margin for economic viability of large scale turbines. See Combs, (2013) "Chapter 11, Wind Energy." Window on State Government, Texas Comptroller of Public Accounts, http://www.window.state.tx.us/specialrpt/energy/renewable/wind.php
Table 5: Regression results for wind installation capacity
Variables Log(wind energy capacity)c;T
(1) (2) (3) Log(initial income + 1)c;t1 -0.121 -0.298 -0.433
(0.966) (0.933) (0.951) Initial county unemployment ratec;t1 -0.076* -0.058
(0.041) (0.044) Log(initial population + 1)c;t1 -0.364** -0.237
(0.156) (0.177)
ERCOT Countyc 0.409* 0.312
(0.211) (0.216) MSA central countyc 1.132*** 0.924**
(0.392) (0.393) MSA outlying countyc 0.502 0.534
(0.332) (0.336) Counties with wind resources (wind class 2) 0.651***
(0.239)
Observations 222 222 222
R2 0.000 0.065 0.086
Robust standard errors in parentheses *** p<0.01, ** p<0.05, * p<0.1
ln(I)c;t = c+ t+ dc;t+ ln(s+ 1)c;t+!ln(w+ 1)c;t+%ln(pop)c;t+x0c;t 1&+ c;t (4)
Ic;t = c+ t+ dc;t+ sc;t+ wc;t+'popc;t+x0c;t 1 + c;t (5)
In equation 3, the dependent variable is the log of county per capita income. Equation 4 is analogous except all variables are in levels, rather than logs. Both the log and level approaches use a dynamic formulation based on annual data. The dependent variable is the log or the level of county per capita personal income in year 2000 dollars at timet associated with a given change in installed wind power capacity, measured as MW per capita, commissioned in the county since the beginning of the study period. In the presence of county and year …xed e¤ects, the regressions represented by equations 3 and 4 capture the ‡uctuations in income in comparison to county baseline income growth. Since this comparison is in respect to this baseline, and not to the county income in the previous year, this is not an income growth regression. Rather, it explains the cumulative change in counties’personal income relative to what would have been expected had its personal per capita income grown at the same rate as the typical county. We lag the observations on total installed wind capacity by one period to ensure
that new wind capacity is measured during a full calendar year of operation. Note, any change in the level of annual real personal income associated with the actual commissioning of wind plant should persist in all future periods in which the given installed wind plant is in operation. No wind plant is decommissioned during the course of this study, so that is not a concern. We also estimate a model, equation 5, for the one-time change in per capita personal income between 2001 and 2011 as a function of the change in wind capacity between 2001 and 2010.
In all estimations based on annual observations, we are able to control for e¤ects on county personal income during the construction phase of wind power build-out. We treat the construction phase as the year prior to plant commissioning. The independent variables are a dummy variable for year of wind power site construction (d), per capita wind development project size (s=pop), per capita cumulative wind energy capacity (w=pop) for each county and year, and county characteristics that vary over time (x). c and tare county and time e¤ects. We rewrite equation 3 as in 4 and estimate the model.
The estimation results displayed in columns 1 and 2 of Table 6 indicate that county per capita income increases by 0.7 percent as wind generation capacity increases by 100 percent from the mean level of nameplate capacity (18.6 MW). Counties with installed capacity are well above the mean level of nameplate capacity and thus personal income e¤ects can be quite signi…cant in both relative and absolute terms.
Column 3 of Table 6 contains the results from the estimation of the change in per capita income levels due to changes in per capita wind power capacity (w=pop). Although the value of the estimated coe¢ cient is large, it is quite reasonable within the estimation context. Using the average population for wind counties of 37,243 persons, a 100 MW increase in wind capacity would imply an increase in county per capita income of about $7.90 in base year dollars. For a small population county, such as Sterling County, population 1,158 in 2011, a 100 MW plant would generate an increase in per capita personal income of $254 in year 2000 dollars. Considering the example of the 662.5MW Capricorn Ridge installation in Coke and Sterling Counties, combined population of 4,463 in 2011, our results suggest an increase of $437.3 in per capita incomes in the two counties, which represents an increase on the order of 2.2 percent (based on a weighted average per capita income in 2001 of $19,537).
Table 6: Regression results for per capita income
Variables Log(per capita income + 1)c;t Per capita Per capita
incomec;t incomec;T10 t1
(1) (2) (3) (4)
Log(wind energy capacity + 1)c;t 1 0.007** 0.007** (0.003) (0.003)
Wind energy capacity per person 2,946.021***
per person (1,081.718)
Wind energy capacity per person 2,690.965**
per personc;T10 t1 (1,065.729) Construction phase 0.037* 0.038* 571.193* (0.022) (0.022) (316.900) Construction phase -0.008 -0.008 log(project size) (0.020) (0.020) Construction phase 130.448
project size per person (1,144.050)
Log(unemployment rate + 1)c;t 1 -0.001 -50.543 (0.003) (80.770) Unemployment ratec;T 10 t1 92.186 (173.988) Log(population + 1)c;t 1 -0.132 -0.132* (0.080) (0.080)
MSA central countyc -865.749
(556.599)
MSA outlying countyc -629.375
(737.629)
County e¤ects Yes Yes Yes No
Year e¤ects Yes Yes Yes No
Observations 2,220 2,220 2,220 222
R2 0.927 0.927 0.873 0.017
Robust standard errors clusterd by counties in parentheses. *** p<0.01, ** p<0.05, * p<0.1
The results for 10-year change are displayed in column 4. As can be seen, the estimate of the e¤ect of total installed wind power on per capita income in this estimation does not di¤er sign…cantly from the estimate gotten from the regression using annual observations. This is consistent with our observation above, i.e., wind plant e¤ects on total county personal income should be level from the point of commissioning (assuming ownership structure remains unchanged) and future e¤ects on per capita income should only result from changes in county population, which were relatively small for these rural counties.
3.2.3 County Property Taxes
We conclude our analysis by examining the impact of wind energy generation capacity on county property taxes, i.e., total assessed value of property or property tax base, county general fund property tax rates and school tax rates. Our intention is to estimate total assessed value as a function of installed wind capacity and property tax rates as functions of county total assessed value.
Texas has no speci…c mandated tax treatment for wind power producers. In each county, a central appraisal district is responsible for assessing the taxable value of all real property (including minerals in place). The State of Texas allows special tax treatment to be o¤ered at the local level. However, school districts are somewhat more limited in their abatement options. The school district can o¤er a value limitation in an area designated as a reinvestment zone. In exchange for the value limitation, the property owner must enter into an agreement to create jobs and meet the minimum amount of quali…ed investment. Value limitations that can range from $1 million to $100 million are only applicable to the districts’ maintenance and operations (M&O) tax rate. The limitation agreement cannot be applied to the I&S (interest and sinking fund) rate. Quali…ed property includes renewable energy electric generation equipment, land and associated improvements. In some cases, the limitation agreement can include payments to the school district that depend on the number of students in the district. For example, in 2009, a commercial wind farm developer entered into a value limitation agreement that capped the value of the property at $10 million for 10 years. The estimated market value of the improved property was $29 million. In return, the developer agreed to pay an annual fee of $142,000
to the school district. A taxing unit other than a school district may enter into a tax abatement agreement exempting all or part of the increase in value of real property and/or tangible personal property from taxation for a period not-to exceed 10 years.17
We consider the following empirical models:
ln(v+ 1)c;t = c+ t+ ln(w+ 1)c;t+x0c;t 1 +!c;t (6) ln tax rate i=p;s c;t tax rateiT X;t=p;s ! = c+ t+ ln(bvc;t 1) + ln(w+ 1)c;t+ c;t (7)
ln(tax rateic;t=p;s) = c+ t+$ln(tax rateT X;ti=p;s) + ln(bvc;t 1) + ln(w+ 1)c;t+ c;t (8)
ln(rschool+ 1)c;t = c+ t+#ln(bvc;t 1) + ln(w+ 1)c;t+%ln(a+ 1)c;t+ec;t (9)
where bvc;t 1=bvc;t 1 ln(w+ 1)c;t 1:
Counties and school boards set tax rates with an eye to their budgetary requirements, given the assessed value of the relevant non-exempt property tax base determined by the appraisal district. County and school revenue realizations are then the product of tax rates and total non-exempt assessed value. School district revenues can also include payments from, say, the wind farm operators, as noted above. While such payments would not in‡uence total school tax revenues, they would a¤ect total district revenue and thus, indirectly, tax rates (in the absence of a "‡ypaper e¤ect"). There is an empirical problem in the question relating to the e¤ects of wind capacity on tax rates. Assessed values of real property are to re‡ect market values and market values depend, at least partially, on tax rates. Thus, tax rates and property tax assessed values will be endogenously determined and the modeling methodology must allow for in‡uences on these intertwined variables to be separately identi…ed. In this circumstance, without identi…cation, OLS will produce a lower bound of the parameter estimates.
To avoid this endogeneity problem and to identify the separate e¤ects of growth in wind capacity on county and school tax bases and rates, we conduct the empirical analysis in three steps. In Step 1, we estimate a model of the assessed value of the county and school property tax bases as a function of wind capacity and county characteristics (equation 6). Then, in Step 2, we strip out the wind capacity
e¤ects by computing values for county property tax bases as the predicted value from the estimated Step 1 model with the wind capacity variable omitted. We consider this to be the estimated value of the assessed tax base that would have been observed in the absence of wind development, a sort of counter-factual value (bvc;t 1). Finally, in Step 3, we estimate county and school tax rates and school revenues in equations 8 and 9 using wind capacity on the right-hand side and the stripped out or counter-factual taxable values. In school revenue calculation (equation 9), we have included average daily attendance (a) as a control group for county size as well.
As would be expected, the results displayed in columns 1, 2 and 3 in Table 7 indicate that wind capacity, in all speci…cations, has a signi…cant and positive e¤ect on total value of the tax base. By the same token, the results of this exercise suggest that the presence of wind development has a negative e¤ect on property taxes rates for the wind counties’ county governments but no e¤ect on the school districts’tax rates. In the case of the wind county governments, the magnitude of the e¤ect of wind power on the value of the county tax base is greater than the magnitude of the e¤ect on tax rates, suggesting a net gain in county revenues. In the case of school distsrict taxes, a zero change in tax rates implies that school tax revenues at the county level increasepari passu with the increases in the county property tax base (assuming no abatements).
We graph the results from this counter-factual exercise in Fig 3. As can be seen in Panel A, the counterfactual property tax line is shifted to the left of the actual line, or the level of counterfactual property tax base is lower over most of the density range. The inverse is true for county property tax rates, or the counterfactual line is shifted to the right of the actual line corresponding to actual county property tax rates.
3.3
Conclusions
To summarize our …ndings, we …nd a modest persistent e¤ect in localized industry employment – apparently working through spillover e¤ects–in manufacturing, retail and accommodations. Including the weak negative e¤ects on employment in Management of Companies and Industries, we observe a change of about 110 jobs per 100 MW of installed wind power. These estimates are in line with
T able 7: Regress io n results for prop ert y and sc ho ol tax rates V a ri a b le s lo g (t a x a b le v a lu e + 1 )c;t L o g (p ro p e rt y L o g (t a x a b le L o g (s ch o o l L o g (s ch o o l ta x ra te )c;t v a lu e + 1 )c;t ta x ra te )c;t re v e n u e s + 1 )c;t (1 ) (2 ) (3 ) (4 ) (5 ) (6 ) L o g (w in d e n e rg y 0 .0 8 5 * * * 0 .0 4 4 * * * -0 .0 0 6 * * 0 .0 3 6 * * * -0 .0 0 0 0 .0 1 5 * c a p a c it y + 1 )c;t 1 ( 1 ) (0 .0 2 1 ) (0 .0 1 2 ) (0 .0 0 3 ) (0 .0 1 0 ) (0 .0 0 1 ) (0 .0 0 8 ) L o g (p o p u la ti o n + 1 )c;t 1 0 .0 7 4 0 .3 9 4 * 0 .4 3 7 * * (0 .0 9 9 ) (0 .2 1 3 ) (0 .2 2 1 ) L o g (i n c o m e + 1 )c;t 1 1 .0 1 4 * * * 0 .1 5 5 0 .0 1 3 (0 .1 6 8 ) (0 .1 1 5 ) (0 .1 1 6 ) L o g (t o ta l n u m b e r o f 0 .1 5 4 -0 .0 3 3 -0 .1 0 8 e st a b li sh m e n ts )t 1 (0 .1 1 3 ) (0 .0 9 8 ) (0 .0 9 4 ) E R C O T C o u n tyc 0 .2 5 6 * * * (0 .0 5 5 ) M S A c e n tr a l c o u n tyc -0 .0 8 3 (0 .0 8 2 ) M S A o u tl y in g c o u n tyc -0 .0 6 0 (0 .0 6 8 ) C o u n ti e s w it h w in d re so u rc e s (w in d c la ss 2 ) -0 .3 3 5 * * * (0 .0 5 9 ) L o g (a v e ra g e T X p ro p e rt y ta x ra te )t 1 .7 5 4 (1 .3 5 2 ) L o g (a v e ra g e T X sc h o o l ta x ra te )t 1 .0 4 9 * * * (0 .0 9 5 ) b vc;t 1 0 .0 2 7 0 .0 1 8 -0 .4 1 6 (0 .0 4 4 ) (0 .0 3 5 ) (0 .2 7 7 ) L o g (a v e ra g e d a il y a tt e n d a n c e + 1 )c;t 0 .5 0 3 * (0 .2 5 9 ) C o u n ty e ¤ e c ts Y e s Y e s Y e s Y e s Y e s Y e a r e ¤ e c ts Y e s Y e s Y e s Y e s Y e s Y e s O b se rv a ti o n s 2 ,2 2 0 2 ,2 2 0 1 ,9 9 8 1 ,7 7 6 1 ,5 5 4 1 ,5 5 4 R 2 0 .1 1 6 0 .9 8 4 0 .8 8 8 0 .9 8 5 0 .9 2 9 0 .9 9 2 R o b u st st a n d a rd e rr o rs c lu st e rd b y c o u n ti e s in p a re n th e se s. * * * p < 0 .0 1 , * * p < 0 .0 5 , * p < 0 .1
Figure 3: Taxable value, property tax rate, and wind energy capacity
Panel A: County taxable value
previous results on indirect employment from the input-output modeling e¤orts. We do not …nd, however, evidence of increased employment in the utility sector as would be expected and as indicated by the input-output models, assuming no crowding out of utility sector employment. This result, too, may be a consequence of the non-local ownership of the wind farms with local employment associated with non-local establishments or sub-contracted to local establishments that are not identi…ed as utility industry …rms. Indeed, when looking at fully disclosed QCEW data up to 2006, we cannot locate the great majority of wind farm establishments in the counties where the wind plants are sited. However, we do …nd establishment-based employment for wind generation …rms (searching by NAICS-6 code) in Austin and Houston, for example.
We also identify a substantial impact on county per capita personal income which, if largely not from wage income, is most likely the e¤ect of lease revenues. Lastly, a signi…cant positive impact, as expected, on the value of county tax base is associated with wind capacity. We conclude that wind county residents enjoy a modest tax bene…t insofar as county tax rates appear to fall slightly with the expansion in county property tax rolls due to installed wind power. On the other hand, the growth in installed wind capacity does not appear to in‡uence school tax rates. Nevertheless, at constant tax rates, an increasing property tax base will result in increased resources for the a¤ected school districts. The use of these additional school district revenues, however, does not appear to have been directed at hiring additional faculty or sta¤.
References
[1] American Wind Energy Association (2011), Property tax treatment of commercial wind energy projects, prepared by Holland & Knight.
[2] Aragon, Fernando, and Juan Rud. 2009. “The Blessings of National Resources: Evidence from a Peruvian Gold Mine.” Banco Central de Reserva del Perú Working Paper 2009-014.