Capturing Appearance
Holly E. Rushmeier
Department of Computer Science, Yale University, New Haven, Connecticut
ABSTRACT
For computer graphics applications, capturing the appearance parameters of objects – reflectance, transmittance and small scale surface structures, is as important as capturing the overall shape. We briefly review recent approaches developed by the computer graphics community to solve this problem. Excellent results have been obtained by various researchers measuring spatially varying reflectance functions for some classes of objects. We will consider some challenges from two of the remaining problematic classes of objects. First we will describe our experience scanning and modeling the throne of Tutankhamen. The major difficulties in this case were that the base shape was a highly detailed non-convex geometry with complex topology, and the shape was covered by optically uncooperative gold and silver. Then we will discuss some observations from our ongoing project to scan and model historic buildings on the Yale campus. The major difficulties in this second case are quantity of data and the lack of control over acquisition conditions.
Keywords: Three-dimensional scanning, appearance, reflectance, computer graphics rendering
1. INTRODUCTION
The past ten years have seen a growing interest in the filed of computer graphics in scanning the three dimensional shape and the appearance parameters of physical objects. Scanning complements methods for the wholly in-computer modeling of geometry and optical properties for generating synthetic imagery. In this paper we review the substantial progress that has been made in this area. We also consider two case studies that highlight problems that remain outstanding in appearance capture.
Objects can simply be photographed to present their appearance as they are. In graphics, we are concerned with capturing aspects of the appearance of objects that allow them to be rendered in some novel way beyond what is photographed. Novel rendering ranges from interpolating between captured views or lighting conditions to altering the the shape or light scattering properties of an object and placing it in a synthetic environment.
Two types of data determine what an object will look like – its shape and its appearance properites. The differentiation between shape and appearance properties is one of relative length scales. Shape is the large scale geometry of an object that determines the volume it occupies in a scene, and how it occludes other objects and lights. Appearance properties are needed to completely describe how an object will scatter light. Appearance properties include small scale but visibly discernible geometric structures such as wrinkles or bumps as well as microscopic and atomic structures that determine light reflectance and transmission. Together the appearance properties form a material, which may be applied to different shapes. For example, different types of leather are characterized by different microscopic scattering properties and distinctive lined or wrinkled features. The same leather material can appear on many shapes – furniture, bags etc. In computer graphics, shape is generally encoded with either surface boundary techniques such as polygonal meshes, subdivision surfaces etc., or with space partitioning methods such as computational solid geometry. Appearance properties are encoded in images that represent variations in properties such as height, normal or reflectances as a function of position that are mapped to points on the surface shape.
Two fundamentally different types of acquisition methods have evolved in computer graphics. In one type, no attempt is made to separately measure shape and appearance parameters. Captured data, usually digital images, are combined into data structures with elements of both shape and appearance, with images used to give the illusion of shape variations that are not explicitly represented. On one extreme end of this type of method are object movies and light fields1 which are completely image-based representations. At the other extreme are
Further author information: E-mail: holly (at) acm (dot) org
surface light fields2 that capture shape and appearance parameters that include lighting effects unique to that shape such as self-shadowing and interreflections. In the case of surface light fields, shape is captured so that it can be reused with different parameters mapped to it. The appearance parameters however can not be readily reused on a different object.
The second type of acquisition method seeks to acquire separate descriptions of shape and material. These methods allow for altering either the shape or appearance parameters to faithfully simulate an object after restoration, or a new object design derived from the original object. This second type of method is the focus of this paper. We begin with a brief review of the state of the art, with an emphasis on the last three years. We find that appearance capture is well-developed for some classes of objects – as classified by their material composition, geometric complexity and physical scale. We then turn to two case studies that highlight difficulties that remain in appearance capture. While the shear magnitude of data to be managed in come cases is one obvious difficulty, several other problems also remain.
2. THE STATE OF THE ART
A previous paper surveyed methods for measuring the appearance properties on 3D objects as of the year 2002.3 That paper described the basic steps that evolved in the process: the registration of captured color and geometric data, the correction of captured data to account for surface and lighting geometry, the capture of small scale (yet visible) geometry accounting for its effects, and problems in combining the results of multiple overlapping input data sets. Methods to register color to geometric data included three approaches: using the same projected light for shape and color data,4 calibrating the color camera parameters to the scanning parameters5 and finding camera to geometry registration after data acquisition by exploiting geometric properties such as silhouettes.6 Correcting the captured data relies in all cases in either obtaining high accuracy data for the object shape and illumination direction, or simultaneously solving for geometric properties, reflectance, and illumination to fit the acquired data and a model of reflectance, with some restrictions on the spatial variation of reflectance or the direction of incident light. Methods for capturing small scale geometry or its effects included the acquisition of surface normals (e.g.7) or bidirectional texture functions (BTFs).8
One major problem addressed by methods estimating surface reflectance is the data sparseness problem. That is, how to estimate sharp peaks in reflectances when it is not possible to sample every point on a surface with a light source and camera positioned to observe mirror reflection. One recent practical approach to this was presented by Lensch et al.6 In this work, all of the incident/reflected pairs for data observed are used to estimate a single reflectance function. All of the observations are then subdivided into two clusters, based on their variance from the estimated reflectance, and two new functions are estimated. The cluster splitting process is repeated until the number of reflectance functions estimated is equal to the number of materials on the object. Another major problem that has been addressed recently is the estimate of subsurface scattering. Jensen et al.9 presented a method for estimating the subsurface scattering for a small flat sample of a homogeneous material. Goesele et al. used observations of laser scattering in a complete object to estimate its subsurface behavior.10
Improving methods for capturing bidirectional texture functions have also received attention. Instruments capable of obtaining spot measurements on an object, but not of a full object, include a method based on kaleidoscopes11and on a translating stage with parabolic mirror.12 A complete review of BTF capture, synthesis and rendering techniques can be found in.8 Work has also continued on measuring large collections of reflectance data, with an eye to better understanding reflectance functions and how to efficiently sample them.13
The review cited above did not consider appearance capture for objects at architectural scale. For interior rooms, modeled by hand rather than scanned, methods have been developed for estimating surface reflectances taking into account interreflections.14 Methods to account for interreflections on a more detailed scale for individually scanned small objects have not been developed.
Material appearance models have been less fully developed for building exteriors. This is primarily due to the daunting task of measuring the shape for such objects. The fusions of data from multiple sources is required, such as photogrammetry for large scale and laser scanning for details as described in,15 or aerial laser scans and laser scanners position at ground level.16 In these cases material is represented by color imagery registered to
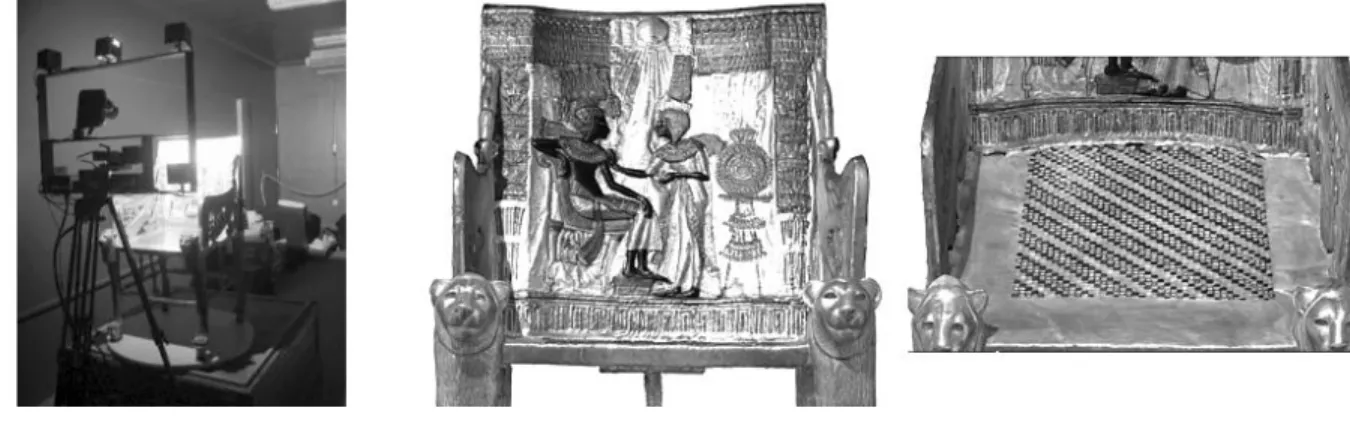
Figure 1.Left: Scanner and the throne. Center and Right: Images generated from the scanned model of the throne of Tutankhamen that illustrate the its detailed texture, and the spatially sharp changes in appearance properties that need to be maintained when the scans are merged.
the merged geometric models. Registering color imagery to and merging color images continues to be challenging for scanning large outdoor areas.17
Beyond using color images as texture maps, Yu and Malik presented a method to extract approximate reflectance values from buildings.18 Using images of the surrounding sun, sky and environment and a building model built semi-automatically with photogrammetric methods, they estimated diffuse and specular components for building surfaces. More recently, Debevec et al. have used light probes to estimate ambient lighting conditions to estimate surface reflectance from data obtained scanning and imaging the Parthenon.19
3. CASE STUDY: THE THRONE OF TUTANKHAMEN
Scanning the throne of Tutankhamen was one of the elements in a project entitled “Eternal Egypt” which was a cooperative venture between IBM and the Egyptian Center for Documentation of Cultural and Natural Heritage (CULTNAT).20 The goal of scanning the throne was first to produce an interactive representation of the throne for display on the web site http://www.eternalegypt.org/, and second to produce a reusable asset for future projects at CULTNAT to study and communicate heritage.
Because visual presentation was a primary goal of scanning, capturing the color, reflectance and shape was essential. First scanning the shape was difficult, since the throne has extremely detailed form with complex topology, has very thin features and is largely covered with metallic gold. Since capturing appearance needs as a base a high quality geometric representation, these geometric issues complicated the acquisition of appearance parameters. Beyond the basic geometry problems, the highly detailed texture, shown in Fig. 1, put even higher demands on the very recognizable features on the throne decoration – such as faces. Concave areas resulted in substantial interreflections that affected estimates of the“unlit” surface properties.
3.1. Capture strategy
The scanning was performed using a ShapeGrabber (http://www.shapegrabber.com/) laser range scanner, cou-pled with a digital camera and five halogen light sources as shown on the left in Fig. 1. In an ideal situation, multiple exposures for a large number of light directions and large number of views would be acquired. The capture of the data was confined to two 12 hour periods during which it was possible to have the throne in a separate room within the Egyptian Museum in Cairo. Since the lights were fixed at five locations in the original system design, the trade-off in how much data to collect was between how many exposures per view and light direction, and how many views could be obtained.
In general, the specular components and shadows are out of range using a single exposure with the color camera. In computing reflectance shadowed areas produce no contribution even if the light leaving the surface is captured with a high level of accuracy. Specular peaks are by definition narrow, and so cannot appear in all
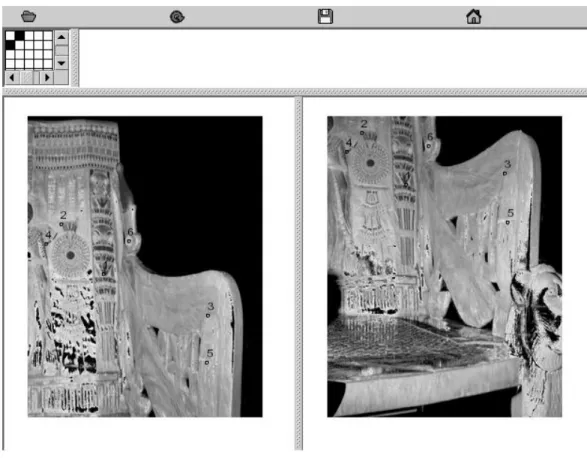
Figure 2. Images generated from the scanned model of the throne of Tutankhamen that illustrate the its geometric complexity. Note the free-standing snakes at the back of the throne, visible at the left and in the center, and the holes in the arms and the delicate connectors between the chair legs visible in all three views.
five images for a point for the five different lighting directions. By not capturing the specular peak accurately, we obtain no data useful for measuring the absolute magnitude of the specular peak. We can however, from overflow of values get enough data to judge whether there was a specular component.
In balance with the dynamic range issue that requires multiple camera exposures at each view, the extreme geometric complexity required numerous views. As shown in Fig. 2 , the geometry included fine holes in the arms of the throne, and a set of thin detailed snakes which stand freely on the back. To capture this in sufficient detail to be able to register the component pieces, many views were needed. In order to capture enough views for satisfactory registration, we decided to use the time allowed us to take a large number of views with a single exposure allowed for each color image. In the end, we took 141 views, each with five color images aligned to the range images by calibration of the color camera.
A key consideration in planning scans with thin features is obtaining views with sufficient overlap. Just taking overlapping views of a thin end of the arm does not provide sufficient data to obtain good registration. Pairs of views such as those shown on the left and in the center of Fig. 3 are required to obtain large sections on either side of a thin feature to adequately align the two sides. Although it was not visually important, the bottom of the throne (also Fig. 3, right) was also scanned to obtain a complete ring of scans around the object to facilitate scan alignment.
3.2. Processing
The scans were cleaned by eliminating unavoidably scanned support data in an image based representation of the scans projected into the acquired color imagery. Representative images in this form are shown on the left and center of Fig. 3. Outliers were eliminated by excluding long edges in forming the initial meshes from the range image data. A small number of faulty patches with normals near perpendicular to the scanner view that were formed due to specular reflections had to be removed using a 3D mesh editor.
The ShapeGrabber scanner was selected from among other devices because of its ability to obtain data for shiny metallic surfaces. However, the data obtained was relatively noisy compared to scans of diffuse surfaces. To produce scans that would not be trapped in local minima during iterative closest point refinement, the depth values in the range image were filtered by median filtering,21 and the range image resolution was reduced by a factor of two. A scan before and after filtering is shown in Fig. 4.
Figure 3.Two scans (left and center) on either side of a thin arm. These scans are shown in the form of projecting the scanned points into one of the color images obtained from the same view. These images were also used for scan cleaning. On the right, a scan of the bottom of the throne is shown, in the form used in Fig. 5 for registration. The curving of the lower run of the chair is an artifact of displaying the cylindrical scan as a rectangular image.
Figure 4.Original range scan (left), scan after median filtering of depths to reduce noise (center), digital photo of section (right) showing actual surface smoothness.
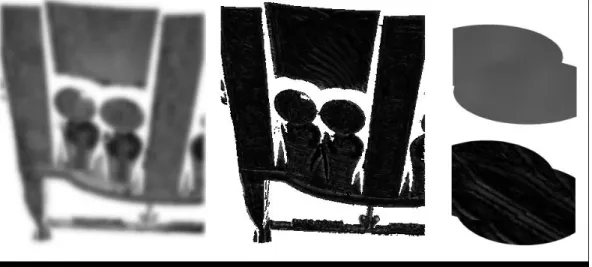
Figure 5.Range scans represented as images for picking corresponding points, shown with corresponding numbers here. In the upper left hand corner is a matrix visualization of scans that have been matched .
Initial alignment required building a tree of pairwise registered scans, using the strongest match for each scan, while trying to minimize the depth of any unbranched set of links in the tree. The initial alignments, matching points were found on scans. Rather than do this on 3D meshes, an image based approach was taken. Each mesh was represented as a image formed by simply coloring pixels in the row and column order obtained by the scanner. While this produces a somewhat distorted view relative to a perspective projection of the points (as seen in the bent rung on the right of Fig. 3, features are clearly visible. An interface that allows users to pick points on respective images was used, shown in Fig. 5. Image points could be directly interpreted as geometric points using a simple look-up. A matrix visualization of matched scans show which scans were already related to other scans. While a manual procedure, point picking for all 141 scans only required on the order of hours, a small fraction of the total time required to process the model. After point picking, each pair of matches was refined using iterative closest point refinement.
Selecting links to form the strongest tree was performed manually. By contrast to the point picking, this was a very time consuming manual process, involving inspecting series of linked meshes in the tree, using visualizations such as that shown in on the left of Fig. 6. Due to many near flat surface, with only embossed features, along with very thin features on the legs, poorly aligned features were not always simple to find with standard metrics. It was found that overall poor alignment was generally due to a small number of poorly matched scans, rather than by a slow accumulation of uniformly distributed error (although this also had an effect).
Some areas were impossible to scan. These produced data holes in the backs of the necks of the front lion’s heads, as shown in the details on the center and right of Fig. 6. Standard hole-filling failed on these sections. Approaches such as space carving were inappropriate. Energy minimization approaches produced regions that were two smooth. These areas of missing data had to be reconstructed manually.
Figure 6.Left: A set of aligned meshes shown to inspect quality of initial tree of related meshes. When viewed in full color meshes which do not interleave well with surrounding meshes stand out. Right:It was impossible to obtain shape scans at the back of the lion’s head. These sections had to be rebuilt by hand due to the failure of standard hole filling algorithms.
Figure 7.Left two images: Two of five images with different lighting obtained from one viewpoint, Second from right: “Unlit” image with estimates of diffuse reflectance obtained from captured images, Right: Weights showing reliability of values in “unlit” image. Darker value corresponds to higher reliability.
a map of reliabilities to be used as weights is shown in Fig. 7.
Despite careful scan planning, choice of initial mesh alignment and automatic refinement of alignment, reg-istration within two millimeters was not possible. Even with two millimeter error, blurring or texture mismatch would be apparent on parts of the model with detailed colored features. Because variations from Lambertian surface reflection caused large image-to-image and within image variations in the “unlit” colors, the techniques of color balance7and texture alignment5did not work on this dataset. Instead a simplified form of Burt-Adelson image mosaicing22was used to combine the “unlit” textures into a single texture as shown in Fig. 8.
Each “unlit” image was decomposed into a low spatial frequency component, and a high spatial frequency component. The low spatial frequency components were all combined on the model, using the weights computed that included the distance and orientation of the throne from the camera for the view the data was taken. The high spatial frequency components were not combined, but at each point on the model the image with the highest weight was selected. The full maps of low and high spatial frequency were then recombined to form a single coherent texture on the throne. The results, as shown in Fig. 1 and Fig. 2 do not show a splotchy result, and high frequency mismatches are not noticeable. A few mismatched seams on the wings on the outside of the arms were repaired manually.
After computing the overall texture, the back of the seat of the chairs and the back ends of the arms were clearly too bright relative to the rest of the throne. This was due to the effects of interreflections. A makeshift
Figure 8.Left: Low frequency component of “unlit” image, Middle: High frequency component of “unlit” image, Right: All low frequency images blended smoothly in final image (top, high frequency component from only one input image in the final image(bottom).
fix for this problem was to apply a gradient correction to the “unlit” textures computed for these areas. Also after computing the texture, no specular component had been computed. Specular lobes of appropriate color and magnitude for each of the materials used on the throne were estimated by comparing renderings of the model with various parameters with captured images of the throne.
4. CASE STUDY II: THE BUILDINGS OF YALE
One of the projects of the Yale Graphics Group is obtaining 3D scans of Yale buildings with high quality material properties, i.e. with high spatial resolution and directional variation . This acquisition program is part of a larger agenda to develop methods to design, model, edit and navigate architectural scale structures. The buildings of Yale offer a rich variety of architectural style, from the Georgian Connecticut Hall designed by Yale President Thomas Clapp in 1750, to the 1930 Gothic style Sterling Library designed by James Gamble Rogers and the modern Ingall’s Rink designed by Eero Saarinen in the 1950’s. An example of one type of building and level of detail we hope to achieve is shown in Fig. 9.
The major difficulties with scanning buildings as opposed to smaller (i.e. one to two meter diameter) objects are 1.) quantity of data and 2.) lack of control over acquisition conditions. We build on previous work that has sought to address these issues.
4.1. Quantity of data
A number of graphics and visualization groups have been working on the general problem of handling large quantities of geometric data. A related motivating problem is extracting and displaying isosurface from large scientific data sets which cannot fit in computer memory, even on very high end machines. Standard approaches include subsetting or slicing data to perform geometric operations in local areas, simplifying surfaces to within a known tolerance level to eliminate unneeded geometric primitives obtained by oversampling, and thinning the data to just relevant features for particular operations. An example of subsetting data is the out-of-core procedure using a novel data structure described for a variety of geometric operations by Cignoni et al..23 Surface simplification methods have proliferated over the years, with the publicly available QSlim algorithm24becoming a standard. Finally, feature extraction can be used to represent scans in processing. An example of feature extraction is the use of fixed point pairs in scan alignment used by Pulli.25
Methods for dealing with large quantities of color imagery can use the same general approaches. Surface properties can be computed locally, by loading in relevant images as needed. Images can be simplified, for
Figure 9.Geometry from six merged range scans of a Yale building alcove (left), digital photo of the same section of alcove (center), digital photo showing level of detail we hope to achieve in building modeling.
example using lower resolution images where there is lower spatial frequency content, using analysis as described by Balmelli et al.26Small sections of images can be used to compute representative features such as the samples used for color balance in7and spatial features used for texture alignment in.5
By exploiting and extending these strategies we plan to deal with the issue of very large quantities of geometric and image data. While challenging, there is a lot of related work in other areas of graphics for dealing with quantities of graphics primitives. The more novel challenges in building scanning are perhaps the lack of control over scanning conditions.
4.2. Control over conditions
We chose Yale as our testbed in part to avoid the pressure of limited opportunity to acquire data. However, even with the ability to take many data sets over a long period of time we still lack the ability to control the lighting and view positions that can be controlled in the laboratory or museum setting. Depending primarily on natural light, we can not design a basis set of lighting conditions. Working in the midst of a campus, we can not physically locate our scanner and cameras in all the positions necessary to get full coverage of each building.
As previous researchers have demonstrated,19,18 when you can’t control incident light you can obtain results by measuring it. A problem with previous work has been the relatively sparse measurement of incident light and the variation of natural light with time. One strategy we can pursue is experimenting with varieties of point measurement devices and calibrated artifacts that can be distributed in a scene to estimated the directional and spectral distribution of incident light. We do control one source of light – the time-of-flight scanner we use. Following the work in4the intensity return value needs to be used to estimate material properties, although with lower spatial resolution geometry and with spatial material variations, not on its own.
To compensate partly for not using a large number of incident lighting directions, we can take numerous photographs to obtain data for different reflected directions. This again, as in the throne scanning project, puts high requirements on the accuracy of registration. Additional work developing image registration and camera to camera calibration strategies are needed.
Although there are many areas in which we can not acquire data, we can draw on a good deal of information about the structures and the materials they are constructed from. We can extend principles such as using knowledge to complete partial geometric reconstructions, as outlined by Fisher.27 We can use collections of measurements of known materials to guide efficient acquisition of new materials following the general idea proposed by,13 although the data we obtain will be much more sparse than the measurements described there.
5. CONCLUSIONS
Although a great deal of progress has been made in capturing appearance parameters, many problems remain. Estimating parameters such as reflectance require an accurate geometric model as a base, so objects with complex geometry and surface properties not amenable to scanning are still difficult. Accurate registration of scans and color data to scans remains a problem that limits the accuracy that can be obtained in estimating appearance. Robust methods are needed for eliminating the effects of interreflections in acquired images. Particularly for large, architectural scale objects, work needs to continue merging as many data sources as possible to compensate for the lack of control over acquisition conditions.
ACKNOWLEDGMENTS
The work on scanning the throne of Tutankhamen included the efforts of staff members at IBM Research: Frank Giordano, Jose Gomes, Fausto Bernardini, and Karen Magerlein, at IBM Egypt: Hisham El-Shishiny, at CULTNAT: Mohamed Farouk and of independent contractor Ric Giantisco. The scans and images from Yale were collected and processed by the Yale Graphics Group: Athinodoros Georghiades, Jianye Lu and Chen Xu.
REFERENCES
1. M. Levoy and P. Hanrahan, “Light field rendering,” in Proceedings of the 23rd annual conference on Com-puter graphics and interactive techniques, pp. 31–42, ACM Press, 1996.
2. D. N. Wood, D. I. Azuma, K. Aldinger, B. Curless, T. Duchamp, D. H. Salesin, and W. Stuetzle, “Surface light fields for 3d photography,” in Proceedings of the 27th annual conference on Computer graphics and interactive techniques, pp. 287–296, ACM Press/Addison-Wesley Publishing Co., 2000.
3. F. Bernardini and H. Rushmeier, “The 3D model acquisition pipeline,” Computer Graphics Forum 21(2), pp. 149–149, 2002.
4. R. Baribeau, M. Rioux, and G. Godin, “Color reflectance modeling using a polychromatic laser range sensor,”IEEE Trans. Pattern Anal. Mach. Intell.14(2), 1992.
5. F. Bernardini, I. Martin, and H. Rushmeier, “High-quality texture reconstruction from multiple scans,” IEEE Trans. on Vis. and Comp. Graph. 7(4), pp. 318–332, 2001.
6. H. P. A. Lensch, J. Kautz, M. Goesele, W. Heidrich, and H.-P. Seidel, “Image-based reconstruction of spatial appearance and geometric detail,”ACM Transactions on Graphics22, pp. 234–257, Apr. 2003.
7. H. Rushmeier and F. Bernardini, “Computing consistent normals and colors from photometric data,” in Proc. of the 2nd Intl. Conf. on 3-D Digital Imaging and Modeling, pp. 99–108, October 1999.
8. G. Mueller, J. Meseth, M. Sattler, R. Sarlette, and R. Klein, “Synthesis and rendering of bidirectional texture functions on arbitrary surfaces,” inEurographics 2004 STAR, Eurographics Association, September 2004.
9. H. W. Jensen, S. R. Marschner, M. Levoy, and P. Hanrahan, “A practical model for subsurface light transport,” inProceedings of the 28th annual conference on Computer graphics and interactive techniques, pp. 511–518, ACM Press, 2001.
10. M. Goesele, H. P. A. Lensch, J. Lang, C. Fuchs, and H.-P. Seidel, “DISCO: acquisition of translucent objects,”ACM Trans. Graph.23(3), pp. 835–844, 2004.
11. J. Y. Han and K. Perlin, “Measuring bidirectional texture reflectance with a kaleidoscope,” ACM Trans. Graph. 22(3), pp. 741–748, 2003.
12. K. J. Dana, “Brdf/btf measurement device,” inEighth IEEE International Conference on Computer Vision, ICCV 2001, pp. 460–466, 2001.
13. W. Matusik, H. Pfister, M. Brand, and L. McMillan, “Efficient isotropic brdf measurement,” inProceedings of the 14th Eurographics workshop on Rendering, pp. 241–247, Eurographics Association, 2003.
14. Y. Yu, P. Debevec, J. Malik, and T. Hawkins, “Inverse global illumination: recovering reflectance models of real scenes from photographs,” inProceedings of the 26th annual conference on Computer graphics and interactive techniques, pp. 215–224, 1999.
15. S. El-Hakim, J.-A. Beraldin, M. Picard, and G. Godin, “Detailed 3D reconstruction of large-scale heritage sites with integrated techniques,”Computer Graphics and Applications24, pp. 21 – 29, 2004.
16. C. Fruh and A. Zakhor, “Constructing 3D city models by merging aerial and ground views,” Computer Graphics and Applications23, pp. 52 – 61, 2003.
17. P. Allen, S. Feiner, A. Troccoli, H. Benko, E. Ishak, and B. Smith, “Seeing into the past: Creating a 3D modeling pipeline for archaeological visualization,” in3D Data Processing, Visualization and Transmission Symposium, Thessalonika, Greece, Sep. 2004.
18. Y. Yu and J. Malik, “Recovering photometric properties of architectural scenes from photographs,” in Proceedings of the 25th annual conference on Computer graphics and interactive techniques, pp. 207–217, 1998.
19. J. Stumpfel, C. Tchou, T. Hawkins, P. Debevec, J. Cohen, A. Jones, B. Emerson, P. Martinez, and T. Lochman, “Assembling the sculptures of the Parthenon,” in Proceedings of the SIGGRAPH 2003 con-ference on Sketches & Applications, pp. 1–1, 2003.
20. M. Farouk, I. El-Rifai, S. El-Tayar, H. El-Shishiny, M. Hosny, M. El-Rayes, J. Gomes, F. Giordano, H. Rush-meier, F. Bernardini, and K. Magerlein, “Scanning and processing 3D objects for web display,” inProceedings of the Fourth International Conference on 3-D Digital Imaging and Modeling (3DIM 2003), pp. 310 – 317, Oct 2003.
21. C. Dorai, G. Wang, A. K. Jain, and C. Mercer, “Registration and integration of multiple object views for 3d model construction,”IEEE Trans. Pattern Anal. Mach. Intell.20(1), pp. 83–89, 1998.
22. P. J. Burt and E. H. Adelson, “A multiresolution spline with application to image mosaics,”ACM Trans. Graph. 2(4), pp. 217–236, 1983.
23. P.Cignoni, C.Rocchini, C.Montani, and R.Scopigno, “External memory management and simplification of huge meshes,”IEEE Trans. on Visualization and Computer Graphics 4, pp. 525–537, 2003.
24. M. Garland and P. S. Heckbert, “Surface simplification using quadric error metrics,” inProceedings of the 24th annual conference on Computer graphics and interactive techniques, pp. 209–216, ACM Press/Addison-Wesley Publishing Co., 1997.
25. K. Pulli, “Multiview registration for large data sets,” inProceedings of Second International Conference on 3-D Digital Imaging and Modeling (3DIM 1999), pp. 160 – 168, Oct. 1999.
26. L. Balmelli, G. Taubin, and F. Bernardini, “Space-optimized texture maps,” Computer Graphics Forum
21(3), pp. 411–420, 2002.
27. R. Fisher, “Solving archictectural modelling problems using knowledge,” inProceedings of Fourth Interna-tional Conference on 3-D Digital Imaging and Modeling, (3DIM 2003), pp. 343–351, 2003.