EVALUATION OF A ENERGY CONSUMPTION INDEX FOR COMMERCIAL
BUILDINGS IN BRAZIL
Silva, José Eduardo Corrêa Santana, jose.edu@gmail.com Neto, Alberto Hernandez, ahneto@usp.br
Escola Politécnica – University of São Paulo
Abstract. The present paper proposes a energy consumption index for commercial buildings located in four different Brazilian climates. For such evaluations, the building simulation tool EnergyPlus was used and a sensivity analysis was made for some of the main paramaters of an air-conditioned building. The analysis showed that the electrical power and lightinig density as well as the COP of the air conditioning system promotes the higher variations on the proposed energy index.
Keywords: energy index, building simulation, building performance
1. INTRODUCTION
In the 70’s, due to the energy crisis promoted by the increase of the high process of the oil, the industry started to develop alternatives to improve the energy efficiency of the buildings.
The industry started to conceive in the 80’s the first evaluation systems to determine energy performance of buildings such as the Building Research Establishment Environmental Assessment Method (BREEAM, 2010), the first and one of the most known. Several others systems were developed like the Leadership in Energy and Environmental Design (USGBC, 2009), which is one of the most used method in several countries, including Brazil. ELETROBRÁS/PROCEL developed a methodology called Procel Edifica (MME, 2006). These methods provide guidelines to designers, architects and engineers to select equipments and materials that can produce buildings with lower energy consumption.
The energy consumption of a building can be affected by several parameters such as climate, internal gains (lightning, electrical equipments, etc.) and building envelope. Based on one of the methodologies mentioned before, it is possible to properly select materials and equipments for a typical commercial building that can provide lower energy consumption. Several researches have been done to develop energy indexes for buildings to determine references for its energy consumption profiles (Zmeureanu, 1992; Canbay et al 2004).
One of the methods that are widely used nowadays for the evaluation of the energy performance of buildings is simulation through softwares such as EnergyPlus (DOE-US, 2009), TAS (EDSL, 2009), ESP-r (ESRU,2009), etc. These tools can simulate annual energy performance of buildings based on data such as building envelope, internal gains schedules and climate data.
This present paper will simulate a typical commercial building for different Brazilian climates using a simulation tool called EnergyPlus and based on the guidelines described on the Standard ASHRAE 90.1 2004 (ASHRAE, 2004a and b). Based on such simulations, an energy index named NPI (normalized performance index) will be evaluated and characterized in order to produce energy references for such buildings in Brazilian climates.
2. LITERATURE REVIEW
An extensive literature review was done in order to evaluate the state of art for energy performance of buildings and alternatives for energy indexes for commercial buildings. The most common energy indexes found are normalized using the floor area or the conditioned floor area (Lee et al, 2001; Hamdi et al, 1999; Yannas, 1996) and provides relation between energy demand (W, kW, J or MJ). Another group of indexes provided a relation between the energy consumption and the floor area or the conditioned floor area such as kWh/m2.year or MJ/m2.year (Kalz, 2009; Kofoworola&Gheewala, 2009; Olofsson et al, 2009). The drawback of such indexes lays on the fact that those are highly affected by the climate conditions, i.e., the same building with identical envelope, internal gains and HVAC systems will have higher energy indexes in locations with higher outdoor dry bulb temperature and/or solar radiation.
In order to take into account the climate influence, Zmeureanu (1992) proposed a normalized annual energy consumption (NAC) index where a energy consumption profile is calculated for a reference climate condition. Afterwards, the energy consumption profile of several buildings are evaluated and normalized by the reference profile using the difference between the actual climate condition and the reference.
An alternative energy index that incorporates the climate influence is the normalized performance index proposed by Canbay et al (Canbay et al., 2004). The authors evaluated an annual energy index that is normalized using the floor area and the relation between the typical number of degree days and the degree days for the analyzed building.
In this paper, a comparison between the energy indexes presented before is done in order to evaluate which index provides a better representation of the energy performance of a commercial building in Brazil and the methodology to calculate those indexes will be detailed in the next sections.
3. METHODOLOGY
The methodology used in this work can be divided in the following steps:
1. Definition of a reference building establishing characteristics for a commercial building such as: a. Building envelope (walls and glass materials, layers thickness, etc.)
b. Internal gains (occupancy, lightning, equipments) 2. Definition of an air conditioning system
3. Definition of a simulation tool
4. Simulation of the reference building for different climate conditions 5. Calculation of the energy indexes
6. Parametric analysis of the energy indexes 4. DEFINITION OF THE REFERENCE BUILDING
The purpose of the standard ASHRAE 90.1 (ASHRAE, 2004 a,b). is to provide minimum requirements for the energy-efficient design of buildings. Therefore, this standard is used as a guideline in order to define the characteristics of reference building that is going to be simulated using a validated simulation tool. The simulation results will provide energy consumption levels that can be used as a reference for other buildings since it was design based on the characteristics provided by the standard ASHRAE 90.1.
The geometry of a typical commercial building (Romero et al, 2005) is shown in Figures 1 and 2 where the main dimensions of a typical floor are presented. Thermal characteristics of the walls and glass materials used in the simulations of the baseline building are presented in Tables 1 and 2. The schedules for the internal gains were defined based on the guidelines of the ASHRAE 90.1 (ASHRAE, 2004a and b). The building in such conditions will be called, from now on, as baseline building. The baseline building has 25 floors with the same floor plan and Figure 1 is showing, only for better visualization reasons, the first, an intermediate and the last floor.
Figure 2 – Thermal zones and brises of a typical floor plan of the building Table 1 – Thermal properties and thickness of layers of the walls, roofs and floors
Material Thermal conductivity (W/m.K) Density (kg/m³) Specific heat (J/kg.K) Thickness (m)
Finishing 0.65 1600 754 0.02 Concrete block 0.91 1700 1005 0.19 Heavy concrete (walls) 1.28 2000 754 0.025 Light concrete (floor/roof) 0.15 1300 910 0.3 Insulation (roof) 0.04 30 1000 0.1225 Gypsum 0.35 1200 910 0.015
Table 2 – Thermal properties and thickness of windows glass Material conductivity Thermal
(W/m.K)
Visible
transmittance Solar transmittance Thickness (mm)
Glass 0.9 0.881 0.775 3
The typical floor plan of the baseline building has a core section (central area of Figure 2) that is not climatizedwhile the rest of the floor is air conditioned with a setpoint of 24ºC for cooling conditions and 20ºC for heating conditions. The window area in each wall, based on the guidelines of ASHRAE 90.1, is calculated as 41,5% of the total wall area which is lower than the 50% limit requested by ASHRAE 90.1.
The occupancy used for the baseline building is evaluated based on parameters described by Standard NBR16401 (ABNT, 2008) since the Standard ASHRAE 90.1 did not provide any guidance for such values. According to NBR 16401, it was adopted an occupancy density of 11.6 m2/person which is defined for medium floor occupancy. For such occupancy density, the heat gain provided by the persons is defined as 115W/person, according to the guidelines presented at Standard NBR 16401-2008.The equipment power density is directly related to the occupancy level. Therefore, NBR 16401 defines, for medium floor occupancy, an equipment power density of 10.7 W/m2 which includes a desktop computer, fax and a printer.
The lightning power density is defined as 16W/m2 which is the typical density proposed by Standard 16401-2008 for offices and banks. Based on guidelines from NBR 5665 (ABNT, 1987), it is necessary 10 lifts (5 for the first 12
floors and 5 for the last 13 floors) to fulfill the people traffic on the baseline building. For such number of lifts, it was calculated that a lift power density of 19.9 W/m2 for the non-conditioned should be added to total energy demand profile of the baseline building.
Finally, an hourly schedule for each internal gain (occupancy, lightning, office equipment and lifts) in typical weekday is defined based on the guidelines provided by the user’s manual of Standard ASHRAE 90.1 (ASHRAE, 2004b) where hourly profile of a fraction of the total energy provided by each gain is defined.
5. DEFINITION OF THE AIR CONDITIONING SYSTEM
ASHRAE 90.1-2004 (ASHRAE, 2004a) determines the air conditioning system and its efficiency based on the type of building (residential and non-residential), the heating system (electrical or gas), the heat rejection system (air or ware cooled) and the climate region.
The air conditioning system proposed for the baseline building is a central system with water cooled chillers with centrifugal compressors and fan-coils with VAV boxes for the air distribution. The COP of the chiller is defined, for all the climates that will be simulated, as 6.1.
6. DEFINITION OF THE SIMULATION TOOL
The simulation tool used is EnergyPlus (DOE-US, 2009) due to its capability of modeling: • 8,760 hours per year;
• hourly variations in occupancy, lighting power, miscellaneous equipment power, thermostat setpoints, and HVAC system operation, defined separately for each day of the week and holidays;
• thermal mass effects; • ten or more thermal zones;
• part-load performance curves for mechanical equipment;
• capacity and efficiency correction curves for mechanical heating and cooling equipment; • air-side economizers with integrated control;
The baseline building will be simulated for four different climates represented by the climate of the cities of: Belém, Brasília, Rio de Janeiro and São Paulo. For each city, the annual and monthly energy consumption will be evaluated in order to provide data for calculating energy indexes. The selection of the cities was based on the availability of weather data for a typical year and also on the different behavior of the climate in each city, providing an evaluation of the energy indexes due to the variation of different climates that is illustrated in Table 3.
Table 3 – Climate parameters for the cities of Belém, Brasília, Rio de Janeiro and São Paulo. São Paulo
Parameter Jan Feb Mar Apr May Jun Jul Aug Sep Oct Nov Dec
Global horizontal radiation (average) [Wh/m2]
458 409 402 433 344 319 348 412 429 420 469 453 Dry bulb temperature (average) [°C] 23 23 21 20 18 16 17 17 17 19 20 22
Relative humidity [%] 75 77 78 76 77 78 75 72 76 82 75 75
Rio de Janeiro
Parameter Jan Feb Mar Apr May Jun Jul Aug Sep Oct Nov Dec
Global horizontal radiation
(average) [Wh/m2] 572 583 501 492 406 379 390 455 464 478 547 543 Dry bulb temperature (average) [°C] 26 26 26 25 23 21 20 22 21 23 24 25
Relative humidity [%] 76 74 79 79 79 78 78 73 79 77 78 77
Belém
Parameter Jan Feb Mar Apr May Jun Jul Aug Sep Oct Nov Dec
Global horizontal radiation
(average) [Wh/m2] 392 385 428 473 507 529 565 614 590 507 474 448 Dry bulb temperature (average) [°C] 26 25 25 26 26 26 26 26 26 27 27 26
Relative humidity [%] 87 89 89 89 85 82 81 80 82 80 82 83
Brasília
Parameter Jan Feb Mar Apr May Jun Jul Aug Sep Oct Nov Dec
Global horizontal radiation
(average) [Wh/m2] 381 475 445 500 456 474 529 591 560 472 430 386 Dry bulb temperature (average) [°C] 22 22 22 21 21 19 19 20 22 22 22 22
Relative humidity [%] 77 70 79 79 67 63 55 54 57 70 75 79
7. SIMULATION RESULTS
A series of simulations of the baseline building are made for the climate conditions presented before and the profile of annual energy consumption is evaluated and a result of such series is shown in Figure 3.
0 20 40 60 80 100 120 140 160 180 200
São Paulo Brasilia Belém Rio de Janeiro
T A E C I [k W h / m 2 .y e a r]
Figure 3 – Comparison of the TAECI for different Brazilian cities.
The energy index presented in Figure 3 is the total annual energy consumption index (TAECI) and it is calculates as follow:
building
a
of
area
plan
floor
total
building
a
of
n
consumptio
energy
annual
total
TAECI
=
(1)The variation that is observed in Fig. 3 can be related to the increase of energy consumption of the air conditioning promoted by the variations on the outdoor dry bulb temperature and the levels of solar radiation. Due to the highest values of such parameters, the city of Belém presented the highest TAECI comparing to the other cities analyzed here. Therefore, an energy index that could incorporate the effect of such parameters might fairly provide normalized energy index for commercial buildings. It should be pointed out that the percentual difference between the highest TAECI (for Belém) and the lowest (for São Paulo) is 19.5%, taking the value of TAECI for São Paulo as reference.
As a first attempt to produce a normalized index that considers the effect of the climate conditions, the TAECI found for each city was divided by the annual average dry bulb temperature (AADBT), calculated using the data shown in Table 3. The normalized energy index evaluated in this attempt is called NEI1 and the result of such evaluation is shown in Figure 4. 0,0 1,0 2,0 3,0 4,0 5,0 6,0 7,0 8,0 9,0
São Paulo Brasilia Belém Rio de Janeiro
N E I1 [ k W h / m 2 .y e a r. °C ]
Figure 4 – Comparison of the NEI1 for different Brazilian cities
One can observe that the index NEI1 produces a reasonable correction for the climate effects. This is can be verified because the percentual difference between the highest NEI1 (for São Paulo) and the lowest (for Rio de Janeiro) is 12.1%, taking the value of TAECI for Rio de Janeiro as reference.
Another attempt to produce an energy index is evaluated by analyzing the Nomalized Performance Index (NPI) proposed by Canbay (Canbay, 2003). The NPI index is based on a methodology to normalize the energy consumption adopted by the Energy Efficiency Office of the Department of the Environment in the United Kingdom. This index normalizes the energy consumption dividing the total annual energy consumption by the total floor area and also corrected by a exposure factor that takes into account the surroundings of the analyzed building. Besides, this index is also corrected by a correlation that includes the degree days of the city where the building is located. The degree days is a climate parameter developed to provide a simpler evaluation of energy demand of a building (for cooling and heating). The degree days is defined as the summation of the hourly temperature difference during the year and a base temperature (Goulart, Lamberts and Firmino, 1998). The result for the evaluation of the NPI for the baseline building for different climates is shown in Fig. 5.
0,0 50,0 100,0 150,0 200,0 250,0 300,0
São Paulo Brasilia Belém Rio de Janeiro
N E I1 [ k W h / m 2 .y e a r. °C ]
Figure 5 – Comparison of the NPI for different Brazilian cities
One can observe that the index NPI does not produce a reasonable correction for the climate effects. This can be verified because the percentual difference between the highest NPI (for Brasília) and the lowest (for Rio de Janeiro) is 51,5%, taking the value of NPI for Rio de Janeiro as reference. This difference can be explained due to the fact that the NPI takes into account the heating loads of the building as a very sensitive parameter. Therefore, since the heating loads for the baseline are negligible, this model should be reevaluated to produce better results when applied to Brazilian climate conditions. Based on the previous evaluations, the NEI1 is defined as the energy index for the following analysis.
8. SENSITIVITY ANALYSIS
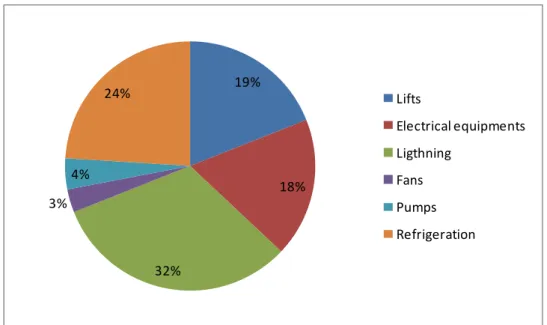
In order to evaluate the set of parameters that should be analyzed for the sensivity analysis the percentual distribution of the energy consumption of the baseline building is shown in Fig. 4 where one can observe that the main end-uses are lightning (32%), lifts (19%), electrical equipments (18%) and air conditioning (31% - included refrigeration, fans and pumps). The percentual distribution shown in Fig. 6 is related to the baseline building simulated for São Paulo but it should be pointed out that for the other cities the distribution is quite similar.
19% 18% 32% 3% 4% 24% Lifts Electrical equipments Ligthning Fans Pumps Refrigeration
In order to evaluate the impact of some parameters related to the energy consumption and based on the analysis of the percentual distribution of the energy consumption, a sensivity analysis is performed where the following parameters were modified and the NEI1 is evaluated in each of the following modification:
• Electrical equipment power density; • Lightning power density;
• Occupancy density;
• COP of the air conditioning chiller.
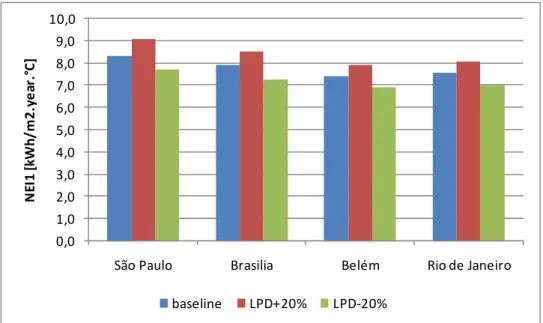
This evaluation consists in varying each one of the parameters above (keeping all other parameters fixed) for a range of ±20% of the value defined for the baseline building. As an example of such evaluation, the variation of NEI1 is shown in Figure 7 for a ±20% variation of the lightning power density.
0,0 1,0 2,0 3,0 4,0 5,0 6,0 7,0 8,0 9,0 10,0
São Paulo Brasilia Belém Rio de Janeiro
N E I1 [ k W h / m 2 .y e a r. °C ] baseline LPD+20% LPD-20%
Figure 7 – Evaluation of the effect of the variation of light power density for the NEI1.
One can observe a variation of ±7.5% for the values of NEI1 for a variation of ±20% of light power density for all the cities. Similar calculations were done for the other parameters and a summary of the results is presented at Table 4. The occupancy density provides the lowest impact on the NEI1 variation while the electrical equipment and lighting power imposes the highest variation followed by the impact promoted by the COP of the air conditioning system.
Table 4 – Average variation of NEI1 for baseline building parameters.
Parameter Average variation of NEI1
Electrical equipment power density 8.1% Lightning power density 7.5%
Occupancy density 2.0%
COP of the air conditioning chiller 6.6% 9. CONCLUSIONS
It was evaluated that the sensitivity of energy index for commercial buildings for different Brazilian climates. It was found out that the energy index is quite sensitive to variations in the electrical equipment and lightning power as well as the COP of the air conditioning system. The comparison of the energy index proposed for different climate condition provided a fairly variation for all the simulated climate condition (12.1% between the highest and lowest value). Based on the results so far achieved, the energy indexes research still requires further improvements for reducing this variation in order to provide a better representation of the energy consumption performance and to evaluate a more consistent normalized energy index for Brazilian climate conditions for commercial buildings.
10. REFERENCES
ABNT. 2008. ABNT NBR 16401-1 - Instalações de ar-condicionado - Sistemas centrais e unitários Parte 1: Projetos das instalações, 60 pages.
ASHRAE - AMERICAN SOCIETY OF HEATING, REFRIGERATING AND AIR-CONDITIONING ENGINEERS. 90.1 User's Manual ANSI/ASHRAE/IESNA Standard 90.1-2004, Atlanta, 2004a.
ASHRAE - AMERICAN SOCIETY OF HEATING, REFRIGERATING AND AIR-CONDITIONING ENGINEERS. Standard 90.1: Energy Standard for Buildings Except Low-Rise Residential Buildings, Atlanta, n. SI Edition, 2004b. BREEAM, 2010. Building Research Establishment Environmental Assessment Method. 16 pages.
CANBAY, Ç. S.; HEPBASLI, A.; GOKCEN, G. 2004. Evaluating performance indices of a shopping centre and implementing HVAC control principles to minimize energy usage. Energy And Buildings, n. 36, p. 587-598.
DOE-US.2009. EnergyPlus Energy Simulation Software, 2009. Available in:
<http://apps1.eere.energy.gov/buildings/energyplus/>. access: January, 2009.
EDSL - Environmental Design Solutions Limited . TAS . Available in:< http://www.edsl.net/main/>. access: January, 2009.
ESRU. ESP-r, 2009. Available in: < http://www.esru.strath.ac.uk/Programs/ESP-r.htm> . access: January, 2009. GOULART, S.; LAMBERTS, R.; FIRMINO, S. 1998. Dados Climáticos para Projeto e Avaliação Energética de
Edificações para 14 Cidades Brasileiras. 2ª Edição. ed. Florianópolis: Núcleo de Pesquisa em Construção/UFSC, 350 pages.
HAMDI, M.; LACHIVER, G.; MICHAUD, F. 1999. A new predictive thermal sensation index of human response. Energy and Buildings, n. 29, p. 167-179, 1999.
KALZ, D. E.; HERKEL, S.; WAGNER, A. 2009. The impact of auxiliary energy on the efficiency of the heating and cooling system: Monitoring of low-energy buildings. Energy and Buildings, n. 41, p. 1019-1030, May.
KOFOWOROLA, O. F.; GHEEWALA, S. H. 2009. Life cycle energy assessment of a typical office building in Thailand. Energy and Buildings, n. 41, p. 1076-1083.
LEE, A. S.; WESTPHAL, F. S.; LAMBERTS, R. 2001. Verificação da eficiência energética de um edifício de escritórios através de simulação computacional - estudo de caso no departamento de Engenharia Civil da UFSC. VI Encontro Nacional e III Encontro Latino-Americano Sobre Conforto no Ambiente Construído, São Pedro, SP, Novembro.
MME- Ministério das Minas e Energia, 2006. Regulamentação para Etiquetagem Voluntária de Nível de Eficiência Energética de Edifícios Comerciais e Públicos. 36 pages.
OLOFSSON, T.; ANDERSSON, S.; SJÖGREN, J.-U. 2009. Building energy parameter investigations based on multivariate analysis. Energy and Buildings, n. 41, p. 71-80.
ROMERO, M. A. ; SARAIVA, J. A. G. ; PIRRÓ, L. F. 2005. O Consumo de Energia em Edifícios de Serviços. In: ENCAC-ELACAC 2005 VIII Encontro Nacional de Conforto no Ambiente Construído e IV Encontro Latino-Americano de Conforto no Ambiente Construído, 2005, Maceió. Anais do ENCAC-ELACAC 2005 VIII Encontro Nacional de Conforto no Ambiente Construído e IV Encontro Latino-Americano de Conforto no Ambiente Construído, p. 1535-1542.
USGBC, 2009. LEED 2009 for New Construction and Major Renovations Rating System. United States Green Building Council, 108 pages.
ZMEUREANU, R. 1992. A new method for evaluating the normalized energy consumption in office buildings. Energy, n. 17, p. 235-246.
YANNAS, S. 1996. Energy indices and performance targets for housing design. Energy and Buildings, n. 23, p. 237-249.