RANKING EU PROGRESS
ON ROAD SAFETY
9
th
Road Safety Performance Index Report
PIN Steering Group
Richard Allsop, ETSC Board of Directors (Chair) Heather Ward, PACTS (Co-chair)
Jacqueline Lacroix, the German Road Safety Council
Vincent Legagneur, Toyota Motor Europe Anders Lie, Swedish Transport Administration Astrid Linder, National Road and Transport Research Institute (VTI)
Karl Pihl, Volvo Group
Guro Ranes, Norwegian Public Roads Administration
Maria Teresa Sanz-Villegas, European Commission Henk Stipdonk, Institute for Road Safety Research (SWOV)
Pete Thomas, Loughborough University Antonio Avenoso, ETSC
Graziella Jost, ETSC Dovile Adminaite, ETSC
For more information
European Transport Safety Council 20 Avenue des CeltesB-1040 Brussels Tel: +32 2 230 4106 [email protected]
www.etsc.eu/pin
The Road Safety Performance Index (PIN)
Programme receives financial support from Volvo Group, the Swedish Transport Administration, the German Road Safety Council, the Norwegian Public Roads Administration and Toyota Motor Europe.
The contents of this publication are the sole responsibility of ETSC and do not necessarily represent the views of the sponsors or the organisations to which the PIN panel and steering group members belong.
© 2015 European Transport Safety Council
PIN Panel
Austria (AT) Klaus Machata, Road Safety Board (KFV) Belgium (BE) Heike Martensen, Belgian Road Safety
Institute (IBSR/BIVV) Bulgaria (BG) To be appointed
Croatia (HR) Sanja Veic, Ministry of Interior
Czech Republic (CZ) Jiri Ambros, Jindric Fric, Transport Research Centre (CDV)
Cyprus (CY) Irene Manoli, Ministry of Communications George Morfakis, Road Safety Expert Denmark (DK) Jesper Sølund, Danish Road Safety Council Estonia (EE) Lauri Lugna, Road Administration
Finland (FI) Ilkka Nummelin, Finnish Motor Insurers´ Centre (VALT)
France (FR) Manuelle Salathé, National Interministerial Road Safety Observatory
Germany (DE) Jacqueline Lacroix, German Road Safety Council (DVR)
Greece (EL) George Yannis, Technical University of Athens
Hungary (HU) Peter Holló, Institute for Transport Sciences (KTI)
Ireland (IE) Velma Burns, Sharon Heffernan, Road Safety Authority
Israel (IL) Shalom Hakkert, Ran Naor Foundation for Road Safety Research; Victoria Gitelman, Technion University
Italy (IT) Valentino Iurato, Ministry of Transport Latvia (LV) Aldis Lama, Ministry of Transport
Lithuania (LT) Vidmantas Pumputis, Ministry of Transport Luxembourg (LU) Claude Paquet, Ministry for Sustainable
Development and Infrastructure
Malta (MT) David Sutton, Malta Transport Authority Netherlands (NL) Peter Mak, Ministry of Transport
Norway (NO) Michael Sørensen, Institute of Transport Economics (TOI)
Poland (PL) Ilona Buttler, Motor Transport Institute (ITS) Portugal (PT) João Cardoso, National Laboratory of Civil
Engineering (LNEC)
Romania (RO) Costin Tatuc, Romanian Traffic Police Serbia (RS) Jovica Vasiljevic, Road Traffic Safety Agency Slovakia (SK) Petra Groschová, Ministry of Transport Slovenia (SI) Vesna Marinko, Traffic Safety Agency Spain (ES) Pilar Zori, Ministry of Interior
Sweden (SE) Anna Vadeby, National Road and Transport Research Institute (VTI)
Switzerland (CH) Yvonne Achtermann, Swiss Council for Accident Prevention (bfu)
U.K. (GB) Brian Lawton, Louise Lloyd, Transport Research Laboratory
Anil Bhagat, Department for Transport
PIN Observers
Stelios Efstathiadis, Road Safety Institute Panos Mylonas, Greece Lucia Pennisi, Automobile Club d’Italia (ACI), Italy
RANKING EU PROGRESS ON
ROAD SAFETY
Authors
Dovile Adminaite
Richard Allsop
Graziella Jost
June 2015Acknowledgements
For their assistance providing data, background information and expertise, the authors are grateful to members of the PIN Panel and Steering Group. Without their contribution, this report would not have been possible. Special thanks go to the Chairman of the PIN programme, Professor Richard Allsop.
The PIN programme relies on panellists in the participating countries to provide data for their countries and to carry out quality assurance of the figures provided. This forms the basis for the PIN Flash reports and other PIN publications. In addition, all PIN panellists are involved in the review process of the reports to ensure the accuracy and reliability of the findings.
ETSC is grateful for the financial support for the PIN programme provided by Volvo Group, the Swedish Transport Administration, the German Road Safety Council, the Norwegian Public Roads Administration and Toyota Motor Europe.
About the European Transport Safety Council (ETSC)
ETSC is a Brussels-based independent non-profit organisation dedicated to reducing the numbers of deaths and injuries in transport in Europe. Founded in 1993, ETSC provides an impartial source of expert advice on transport safety matters to the European Commission, the European Parliament and Member States. It maintains its independence through funding from a variety of sources including membership subscriptions, the European Commission and public and private sector support.
Executive Director
Antonio AvenosoBoard of Directors
Professor Herman De Croo (Chairman) Member of Parliament and Minister of State, Belgium
Professor Richard Allsop
University College London & PACTS, UK Dr. Walter Eichendorf
German Road Safety Council (DVR) Tjibbe Joustra
Dutch Safety Board (OVV) Michael Cramer
Member of the European Parliament Dieter-Lebrecht Koch
Member of the European Parliament Olga Sehnalová
Member of the European Parliament Ines Ayala Sender
Member of the European Parliament Dirk Sterckx
Former Member of the European Parliament Professor Pieter van Vollenhoven
CONTENTS
Executive summary 7
Key recommendations to Member States 8
Key recommendations to EU Institutions 8
Part I The EU is not on track to reach the 2020 target 9
1.1 A bad year for road safety 9
1.2 An 18% reduction in road deaths between 2010 and 2014 across the EU28,
less than 1% better than between 2010 and 2013 11
1.3 EU no longer on track for the 2020 target 12
1.4 Over 5,700 road deaths prevented in the EU in 2014 compared to 2010 12 1.5 A 53% reduction in the number of road deaths since 2001 14
1.6 Europe’s road safety divide unchanged 14
1.7 Road deaths per vehicle-distance travelled 15
1.8 Drink driving 16
Part II Slower progress in reducing the numbers seriously injured 18
2.1 Time for the EU to deliver on its promise to introduce a serious injury target 18 2.2 ETSC recommends the EU to adopt a target of 35% reduction
between 2014 and 2020 in the number of people seriously injured on the roads 19
2.3 Country comparison 20
2.4 Reduction in serious injury lags behind reduction in road deaths 21
Part III Slovenia receives the 2015 Road Safety PIN Award 23
Interview with Peter , Minister of Infrastructure 23
Annexes 27
ISO country codes
Table 1 (Fig.1, 2) Road deaths and percentage change in road deaths between 2013 and 2014 28 and between 2010 and 2014 Table 2 (Fig.5, 11) Road deaths and percentage change in road deaths between 2001 and 2014 29
and estimated average annual percentage change 2001-2014
Table 3 (Fig.6) Road deaths per million inhabitants in 2014 and 2010 30 Table 4 (Fig.7) Road deaths per billion vehicle-kilometres over three recent years 31 Table 5 (Fig.8) Road deaths attributed to drink driving and the difference between the average 32
annual percentage change in the number of road deaths attributed to alcohol and the corresponding reduction for other road deaths over the 2001-2014 period Table 6 National definition of deaths attributed to drink driving 33 Table 7 (Fig.10, 11) Serious injuries according to national definition and percentage change 34
in serious injuries between 2010-2014 and annual average percentage change 2001-2014
Table 8 Current definition of a seriously injured person in a road collision 35 Table 9 Countries’ progress in collecting data on serious injuries based on MAIS 36
INTRODUCTION
ETSC’s Road Safety Performance Index (PIN) programme was set up in 2006 as a response to the first road safety target set by the European Union to halve road deaths between 2001 and 2010. In 2010, the European Union renewed its commitment to reduce road deaths by setting a fresh target to reduce them by 50% by 2020 compared to 2010 levels.
By comparing Member State performance, the PIN serves to identify and promote best practice and inspire the kind of political leadership needed to deliver a road transport system that is as safe as possible.
The PIN covers all relevant areas of road safety including road user behaviour, infrastructure and vehicles, as well as road safety policymaking. Each year ETSC publishes PIN ‘Flash’ reports on specific areas of road safety. The March 2015 Flash report ranks EU progress on improving motorway safety and the June 2015 Flash report looked at progress across Europe in improving safety for cyclists and walkers; they can be downloaded from the ETSC website. A list of other topics covered by the PIN programme can be found in the Annexes.
In June each year ETSC’s analysis of overall annual progress on tackling road deaths and serious injuries is published in the PIN Annual Report – this edition is the 9th. The annual report is launched at a high level event in Brussels, together with the presentation of the annual PIN Award to a country that has made outstanding progress on road safety. In 2015 Slovenia has been recognised for its progress in cutting road deaths in recent years.
In addition, ETSC, together with national organisations, hosts PIN events in various countries throughout the year, bringing together experts and policymakers to share best practice and learn from the experience of progress made in other countries.
The report covers 32 countries: the 28 Member States of the European Union, together with Israel, Norway, the Republic of Serbia and Switzerland.
Ranking EU progress on road safety | 7
In 2010, the European Union renewed its commitment to improving
road safety by setting a target of reducing road deaths by 50% by
2020, compared to 2010 levels. This goal followed an earlier target
set in 2001 to halve road deaths by 2010.
2014 was a bad year for road safety. 25,845 people were killed in the EU28 as a consequence of road collisions compared to 26,009 in 2013, representing a decrease of only 0.6%, compared with the decrease of 6.7% that is needed to reach the target for 2020 by equal annual reductions. Out of the 32 countries monitored by the PIN Programme, only 18 registered a drop in the number of road deaths between 2013 and 2014, 13 saw an increase while progress stagnated in one country (Fig.1). However, some countries are doing better than the others. Malta (-44% from its unusually high number in 2013), Luxembourg (-22%), Norway (-21%), and Croatia (-16%) achieved the best reductions in 2014 compared to 2013. Slovenia, Serbia, Finland, Greece and Switzerland recorded reductions of more than or very nearly 10%.
Across the EU28 road deaths have been cut by 18% between 2010 and 2014 (Fig.2), equivalent to a 4.9% average annual reduction. A 6.7% year-to-year reduction is needed over the 2010-2020 period to reach the target through constant progress in annual percentage terms (Fig.3). Yet, since the slowdown in 2014, the number of road deaths between 2015 and 2020 has to be reduced at a much faster pace of about 8% each year for the EU to be on track for the target. Reaching the EU target for 2020 is at risk, but it might still be reachable if combined efforts at both national and EU levels are stepped up urgently.
There were 15,545 fewer road deaths in the EU in 2011-2014 than if the 2010 rate had continued. According to ETSC estimates, this reduction is valued at 30 billion euro (Fig.4). Preventing deaths and serious injuries on EU roads is a sound investment in terms of resources devoted to safety measures and the saving potential is far from being exhausted.
In 2014 more than 203,500 people were recorded as seriously injured by the police in the 23 EU countries that distinguish between seriously and slightly injured in their data. Many more suffered slight injuries. The number of seriously injured grew by almost 3% in 2014 compared to 2013. ETSC recommends the European Commission to adopt a target of a 35% reduction between 2014 and 2020 in the number of people seriously injured according to the MAIS3+ definition (Fig.9) and a strategy to reverse the trend (see Part II).
EXECUTIVE SUMMARY
Almost 3%
increase in serious
injuries in 2014
Reaching the
EU target for
2020 is at risk,
but it might still
be reachable if
combined efforts
at both national
and EU level
are stepped up
urgently.
2014
was a bad year
for road safety
>60 60-57 56-46 <45 PIN Award 2007 PIN Award 2010 PIN Award 2008 PIN Award 2009 PIN Award 2009 PIN Award 2010 PIN Award 2011 PIN Award 2011 PIN Award 2013 PIN Award 2014 PIN Award 2012 PIN Award 2015 Map 1 Percentage reduction in
road deaths between 2001 and 2014 and recipient countries of PIN Award
Source: PIN Panellists (see Fig. 5, Table 2 in the Annexes)
Key recommendations to Member States
Seek to reach targets by all available means, including applying proven enforcement strategies according to the EC Recommendation on enforcement.
Set national reduction targets for seriously injured based on MAIS3+ alongside the reduction of deaths. Include serious injuries in the impact assessment of countermeasures where this does not take place
already.
Streamline the emergency response chain and increase quality of trauma management in order to mitigate collision consequences more effectively.
Use the evidence gathered under the Road Safety PIN and elsewhere to devise and update relevant policies. Make the choice of measures based on sound evaluation studies and - where applicable – consideration of cost effectiveness.
Key recommendations to EU Institutions
Adopt a fully-fledged strategy to tackle serious injuries including measures against which delivery can be made accountable.
Adopt a target to reduce by 35% between 2014 and 2020 the number of people seriously injured based on MAIS3+.
Within the context of the revision of the General Safety Regulation1 prioritise the introduction and further extension of in-vehicle safety technologies linked to the key risk factors, which include Intelligent Speed Assistance, alcohol interlocks, seat belt reminders and Autonomous Emergency Braking. Mandate Event Data Recorders in all new vehicles.
Within the context of the revision of the Infrastructure Safety Management Directive2, extend application of the instruments of the directive to cover all motorways, rural and urban roads.
Implement priorities for 2015-2020 put forward in ETSC’s position paper on the mid-term review of the road safety policy orientations including improved infrastructure, vehicle safety, and tackling speeding and drink driving.3
1 Regulation (EC) No 661/2009 of the European Parliament and of the Council of 13 July 2009 concerning type-approval requirements for the
general safety of motor vehicles, their trailers and systems.
2 Directive 2008/96/EC of the European Parliament and of the Council of 19 November 2008 on Road Infrastructure Safety Management.
3 ETSC (2014), Mid Term Review of the European Commission’s Road Safety Policy Orientations 2011-2020. Briefing – Stakeholder Consultation
Ranking EU progress on road safety | 9
PART I
THE EU IS NOT ON TRACK TO REACH
THE 2020 TARGET
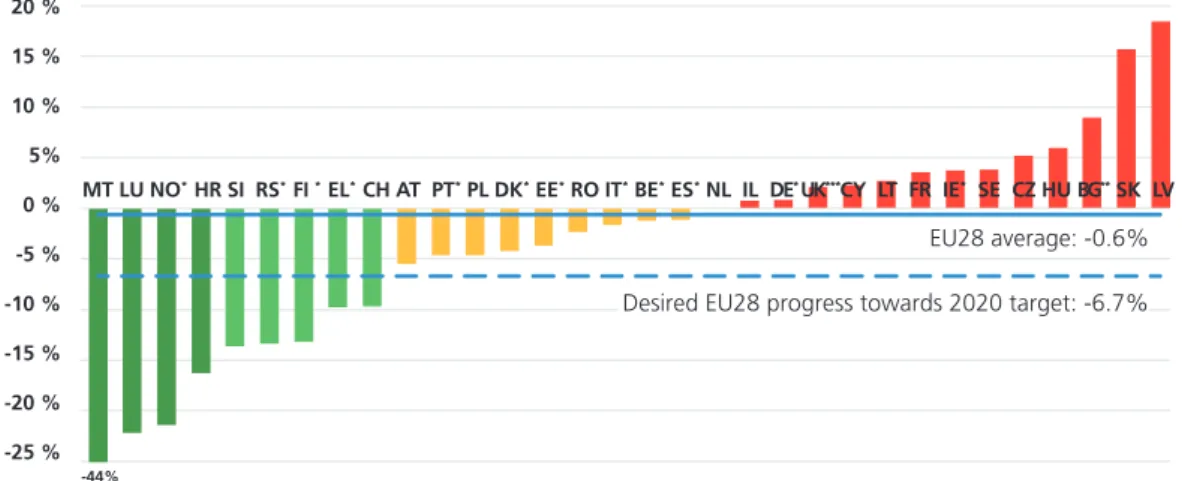
Fig. 1: Percentage change in road deaths between 2013 and 2014
*National provisional estimates used for 2014, as the final figures for 2014 are not yet available at the time of going to print. **ETSC estimates based on CARE Quick indicator. ***UK data for 2014 is GB provisional total for year ending September 2014 and Northern Ireland total for the calendar year 2014. Numbers of deaths in MT and LU are small and therefore subject to substantial annual fluctuation.
1.1 A bad year for road safety
Out of the 32 countries monitored by the PIN Programme, only 18 registered a drop in the number of road deaths between 2013 and 2014, 13 saw an increase while progress stagnated in one country (Fig.1). 2014 has seen the slowest pace in reducing the number of road deaths since the introduction of the first EU target in 2001. 25,845 people lost their lives on the EU roads in 2014, compared to 26,009 in 2013, representing just a 0.6% reduction. This follows an 8% decrease between 2012 and 2013.
Malta (-44% from its unusually high number in 2013), Luxembourg (-22%), Norway (-21%), and Croatia (-16%) achieved the best reductions in 2014 compared to 2013. Slovenia, Serbia, Finland, Greece and Switzerland recorded reductions of more than or very nearly 10%. Yet the number of road deaths increased in Latvia, Slovakia, Bulgaria, Hungary, the Czech Republic, Sweden, Ireland, France, Lithuania, Cyprus, the United Kingdom, Germany and Israel.
Norway: consistent and targeted road safety measures
The number of people killed on Norwegian roads was 21% fewer in 2014 than in 2013, 147 compared to 187.
“The relative low numbers of deaths in Norway are subject to annual fluctuation. But the long term trends are stable, showing a steady improvement in road safety. We see it as the result of consistent and targeted activities undertaken by a lot of different organisations all striving to reach the interim target set by the Parliament. The Public Roads Administration and the counties have built safe new roads, including motorways and trunk roads with median barriers and there is a renewed focus on safe pedestrian and bicycle travel in our towns and cities. The use of seat belts has increased to an even higher level, following enforcement and awareness campaigns. Mean speeds on our roads are, on average, slowly but steadily going down towards speed limits. Finally, lots of different activities have been targeting kids, young drivers and elderly people around the country.”
Guro Ranes, Norwegian Public Roads Administration.
20 % 15 % 10 % 5% 0 % -5 % -10 % -15 % -20 % -25 % MT LU NO* HR SI RS* FI * EL* CH AT PT* PL DK* EE* RO IT* BE* ES* NL IL DE* UK***CY LT FR IE* SE CZ HU BG** SK LV
NO
EU28 average: -0.6% Desired EU28 progress towards 2020 target: -6.7%Germany: more vulnerable road users killed in 2014
In 2014 the number of road deaths in Germany increased by 1% compared to 2013. It went up from 3,340 in 2013 to 3,368 in 2014.
“One of the main reasons for the increase of casualties in road traffic in Germany in 2014 was the weather conditions: the winter was mild and the spring was dry and warm. This led to more people riding a motorcycle, walking and cycling and therefore, sadly, more of them being killed and injured in road collisions. Local authorities should address this challenge and consider expanding 30km/h zones. Germany’s Federal Transport Minister Alexander Dobrindt has announced legal changes that will make it easier for local authorities to set 30km/h zones, including on main roads near schools and kindergartens.”
Jacqueline Lacroix, DVR, German Road Safety Council.
France: 116 more people killed on the roads in 2014
Road deaths have increased by 3.5% in France, from to 3,268 people killed in 2013 to 3,384 people in 2014. Mean speeds increased on all roads outside urban areas in 2014. According to Police reports, 21% of people killed in cars, 27% of people killed in vans and 37% of people killed in trucks were not wearing their seat belt. 12% of moped riders and 3% of the motorcyclists killed were not wearing a helmet. Drink driving has been involved in 28% of all fatal collisions and illegal drugs in 23% of all fatal collisions.4
4 Observatoire National Interministériel de la Sécurité Routière (28 May 2015), Bilan de la sécurité routière en 2014.
Following the adoption of the EU road safety target for 2020, this chapter uses as main indicators the percentage changes in the numbers of people killed on the road between 2013 and 2014 (Fig.1), between 2010 and 2014 (Fig.2) and since 2001 (Fig.5). A person killed in traffic is someone who was recorded as dying immediately or within 30 days from injuries sustained in a collision. We also use road mortality, the number of road deaths per million inhabitants, as an indicator of the current level of road safety in each country (Fig.6). Additionally, the number of road deaths per billion vehicle-km is presented where vehicle-kilometre data are available (Fig.7). The data collected to calculate the indicators are from the national statistics supplied by the PIN Panellist in each country. The numbers of road deaths in 2014 in Belgium, Denmark, Finland, Estonia, Germany, Greece, Ireland, Italy, Norway, Portugal, Spain, the United Kingdom and Serbia are provisional as final figures were not yet available at the time of going to print. Numbers of deaths in Luxembourg and Malta are small and are therefore subject to substantial annual fluctuation. Numbers of deaths in 2014 in Bulgaria are ETSC estimates based on the EC CARE Quick indicator. http://ec.europa.eu/transport/road_safety/pdf/observatory/trends_figures.pdf. The full dataset is available in the Annexes.
Population figures were retrieved from the EUROSTAT database.
This report compares Member States’ progress in reducing total numbers of road deaths. Progress in reducing deaths among pedestrians, cyclists, powered two wheeler users and vehicle occupants up to 2013 can be found in the 29th PIN Flash report (2015), Making walking and cycling on Europe’s roads safer at etsc.eu/pin. In the last ten years deaths among pedestrians decreased by 41%, those among cyclists by 37% and those among power two wheeler (PTW) users by 34% compared to a 53% decrease for vehicle occupants. Since 2010 the reduction in the number of pedestrian and cyclist deaths has slowed down markedly. The safety of unprotected road users should therefore receive special attention from policymakers at the national and European levels. As active travel is being encouraged, the safety of walking and cycling in particular must be addressed urgently.
Speeding, failure to wear a seat belt and drink driving are three main risky behaviours on the roads. Countries’ progress in tackling speeding and non-use of seat belts can be found in the 27th PIN Flash report (2014), Ranking EU progress on Car Occupant Safety. The indicator on drink driving, which had not been updated since 2010, is updated in this report showing progress up to 2013 or 2014.
INDICA
TOR
i
DE
Ranking EU progress on road safety | 11
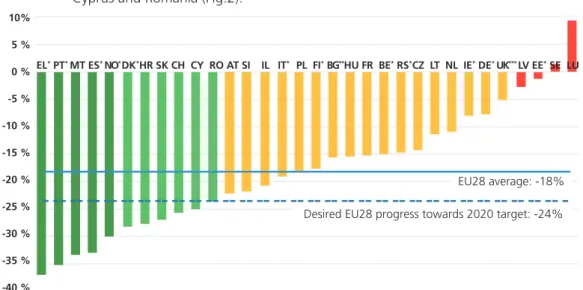
1.1 An 18% reduction in road deaths between 2010 and 2014 across the EU28, less than 1% better than between 2010 and 2013
The EU28 has collectively reduced the number of road deaths by 18% over the period 2010-2014, less than 1% better than over the period 2010-2013. Developments since the setting of the new EU road safety target have followed the desired trend in Greece, Portugal, Malta, Spain, Norway, Denmark, Croatia, Slovakia, Switzerland Cyprus and Romania (Fig.2).
Croatia: Police enforcement, focus on young drivers and improved infrastructure
Croatia is one of the EU countries which is on track for the EU road safety target - since 2010 the number of road deaths decreased by 28% (Fig.2). Croatia achieved the 4th best reduction between 2013 and 2014 with - 16% (Fig.1).
“We are proud of the progress so far in implementing the National Road Safety Programme 2011-2020. The 2014 results reward the hard work of a lot of different stakeholders, in particular the Police, NGOs and private associations that are raising road safety awareness. The Police have been targeting checks on sites where severe collisions have happened. Stricter sanctions were introduced for drunk drivers as well as a zero alcohol tolerance policy for young drivers. Young drivers are also subject to a 10km/h lower maximum speed limit on rural roads and motorways. Improved infrastructure has also been an important factor in raising road safety standards. In the last couple of years more than a thousand kilometres of high quality roads, mainly motorways and fast roads, have been built or reconstructed, shifting traffic away from dangerous rural roads. However there is a lot more to be done as road mortality in Croatia is still amongst the highest in the EU.”
Sanja Vei , The Ministry of Interior, Croatia.
The United Kingdom: road deaths up following abolishment of National road safety targets
Since 2010 the number of road deaths in the United Kingdom has decreased by just 5% which is well below the EU average. Provisional data up to September 2014 show that road deaths have increased on UK roads: 1,807 people lost their lives in 2014 compared to 1,769 in 2013, representing a 2% rise.
“Various factors are likely to have contributed to these results; for example, the British economy grew more in 2014 than it had done for several years, and road casualties are partially correlated with economic growth. In addition, the British government of 2010-2015 abolished national road safety targets for Great Britain, substantially reduced the funding of road safety schemes and of policing, announced that it was “ending the war on the motorist”, and publicly considered increasing various national speed limits on higher speed roads. This combination appears to have resulted in road safety falling substantially down the agenda of many roads authorities.”
Brian Lawton, Transport Research Laboratory.
UK
Fig. 2: Percentage change in road deaths between 2010 and 2014
*National provisional estimates used for 2014, as the final figures for 2014 are not yet available at the time of going to print. **ETSC estimates based on CARE Quick indicator. ***UK data for 2014 is the GB provisional total for year ending September 2014 and Northern Ireland total for the calendar year 2014. Numbers of deaths in LU and MT are small and therefore subject to substantial annual fluctuation. 10% 5 % 0 % -5 % -10 % -15 % -20 % -25 % -30 % -35 % -40 % EL* PT* MT ES* NO* DK*HR SK CH CY RO AT SI IL IT* PL FI* BG**HU FR BE* RS*CZ LT NL IE* DE* UK*** LV EE* SE LU EU28 average: -18% Desired EU28 progress towards 2020 target: -24%
Fig. 3: Reduction in road deaths since 2000 in the EU28 (yellow line), the EU27 (black line), the EU 15 (blue line), the EU10 (red line) and the EU2 (Bulgaria and Romania, green line). The logarithmic scale is used to enable the slopes of the various trend lines to be compared. 100,000 56,460 41,420 11,530 10,000 3,510 1,000 EU28 EU15 EU10 EU2 EU27 EU28 2020 target EU27 2010 target 2000 2002 2004 2006 2008 2010 2012 2014 2016 2018 2020 1.3 EU no longer on track for the 2020 target
Since 2010, the average annual progress in reducing the number of road deaths in the EU28 was 4.9%. A 6.7% year-to-year reduction is needed over the 2010-2020 period to reach the target through constant progress in annual percentage terms. Yet, since the slowdown in 2014, the number of road deaths over the period 2015-2020 now has to be reduced at a much faster pace of about 8% each year for the EU to be on track. The EU target for 2020 is still reachable if combined efforts at both national and EU level are stepped up urgently.
Key recommendations to Member States
Seek to reach targets by all available means, including applying proven enforcement strategies according to the EC Recommendation on enforcement.
Use the evidence gathered under the Road Safety PIN and elsewhere to help in devising and updating relevant policies. Make the choice of measures based on sound evaluation studies and - where applicable – consideration of cost effectiveness.
Key recommendations to EU Institutions
Support Member States in preparing national enforcement plans with yearly targets for compliance in the areas of speeding, drink and drug driving and seat belt use.
Implement priorities for 2015-2020 put forward in ETSC’s position paper on the mid-term review of the road safety policy orientations including improved infrastructure, vehicle safety, and tackling speeding and drink driving.
1.4 Over 5,700 road deaths prevented in the EU in 2014 compared to 2010 There were almost 5,750 fewer road deaths in 2014 than in 2010 in the EU28. This reduction is about 1,900 road deaths short of the reduction there would have been in 2014 if the annual EU progress was on track towards the 2020 road safety target by a constant year-to-year reduction of 6.7%. The reduction in the number of deaths over the period 2011-2014 compared with 4 years at the 2010 rate was 15,545, which is 4,250 fewer deaths prevented than if the annual reduction of 6.7% had been achieved.
Putting a monetary value on prevention of loss of human life and limb can be debated on ethical grounds. However, doing so makes it possible to assess objectively the costs and the benefits of road safety measures and helps to make the most effective use of generally limited resources.
Enlargement EU10
Ranking EU progress on road safety | 13
30 billion euro
Total monetary value
of deaths avoided
2011-2014 in the EU28
The Value of Preventing one road Fatality (VPF) estimated for 2009 in the 5th PIN Report has been updated to take account of changes to the economic situation in the intervening years.5 As a result, we have taken the monetary value for 2014 of the human losses avoided by preventing one road fatality to be 1.94 million euro at factor cost.6
The total value of the reductions in road deaths in the EU28 for 2014 compared to 2010 is thus estimated at approximately 11 billion euro, and the value of the reductions in the years 2011-2014 taken together compared with four years at the 2010 rate is about 30 billion euro. If the EU countries had moved towards the 2020 road safety target through constant progress, the greater reductions in deaths in the years 2011-2014 would have raised the benefit to society by about 8 billion euro to about 38.5 billion euro over those years (Fig.4).
Given the financial difficulties that many EU countries face due to the economic slowdown, the value to society of improving road safety should be taken into account in the policy and budgetary planning processes, expressing in monetary terms the moral imperative of reducing road risk. The high value of societal costs avoided during 2011-2014 shows once more that the saving potential offered by sustained road safety improvements is considerable, making it clear to policy-makers the potential for road safety policies to provide a sound investment.7
5 In countries where the monetary Value attributed to human losses avoided by Preventing one Fatality (VPF) is
estimated on the basis known as Willingness-To-Pay (WTP). The use of WTP valuations in transport safety has been advocated by ETSC since 1997. ETSC (1997) Transport Accident Costs and the Value of Safety.
6 See Methodological Notes, PIN Report 2015, www.etsc.eu/PIN.
7 For more details, see ETSC (2011), 5th PIN Report and Methodological Notes on www.etsc.eu/PIN.
Fig. 4: Reduction in the number of road deaths in EU28 2011-2014 and valuation at 2014 prices and value, together with the additional savings – both in lives and in the EUR valuation of preventing this number of deaths – that could have been achieved if the EU had moved towards the 2020 road safety target by steady progress in percentage terms. 20,000 18,000 16,000 14,000 12,000 10,000 8,000 6,000 4,000 2,000 0 40,000 35,000 30,000 25,000 20,000 15,000 10,000 5,000 0
Road deaths Value in Euro at 2014
prices
V
alue of pr
evention in millions of EUR
Road deaths pr
evented
Deaths prevented Extra deaths that
could have been prevented Value in EUR of saving in human costs Value in EUR of extra saving that could have
1.5 A 53% reduction in the number of road deaths since 2001
Since the first EU target for reducing the number of road deaths was introduced in 2001, Spain has achieved a reduction in the number of road deaths of 70% (Fig.5). Portugal, Lithuania, Latvia, Slovenia and Estonia follow with reductions of more than 60%. However, the progress has been slow in Romania, Malta, Bulgaria and Poland.
1.6 Europe’s road safety divide unchanged
In the EU28 the overall level of road mortality was 51 deaths per million inhabitants in 2014, compared with 63 in 2010. As was the case in 2013, the risk of road death per million inhabitants differs by a factor of three between the groups of countries with the highest and the lowest risk. In 2014 Malta, Sweden, the United Kingdom and Norway hold the lead with less than 30 deaths per million inhabitants (Fig.6). In Switzerland, Denmark, Israel, The Netherlands and Spain road mortality does not exceed 40 deaths per million inhabitants. The highest risk per head of road users being killed is in Latvia, Romania, Bulgaria, Lithuania and Poland where road mortality is between 84 and 106 deaths per million inhabitants.
1.7 Road deaths per vehicle-distance travelled
Fig.7 shows deaths per billion vehicle-km travelled for the 19 countries where up-to-date data on distance travelled are available. This indicator complements the well-established indicator of road mortality (Fig.6).
Sweden, the United Kingdom, Ireland and Norway have the lowest numbers of road deaths per vehicle-km driven among the countries collecting up-to-date data. Road risk by distance travelled in Latvia, Croatia and the Czech Republic is almost five times as high as in Sweden. Differences between the relative positions of countries in Fig.6 and Fig.7 can arise from differences in aspects such as usage of motorcycling, cycling or walking, the traffic density, the proportions of traffic on motorways or rural roads and the method for estimating the number of vehicle-km travelled. Fig. 5: Percentage change
in road deaths between 2001 and 2014
*National provisional estimates used for 2014, as the final figures for 2014 are not yet available at the time of going to print. **ETSC estimates based on EC CARE Quick indicator. ***UK data for 2014 is GB provisional total for year ending September 2014 and Northern Ireland total for the calendar year 2014. Numbers of deaths in Malta are small and are therefore subject to substantial annual fluctuation. 0% -10 % -20 % -30 % -40 % -50 % -60 % -70 % ES* PT* LT LV SI EE* FR SK EL* DK* RS* CH AT CY IT* IE* HR BE* DE* LU UK***HU SE IL CZ FI* NL NO* PL BG** MT RO
Slovenia’s performance has been recognised by ETSC at the 9th Road Safety PIN Conference with the 2015 Road Safety PIN Award. The interview with the Minister of Infrastructure of Slovenia in Part III describes the background to this success.
Fig. 6: Road deaths per million inhabitants in 2014 (with road deaths per million inhabitants in 2010 for comparison).
*National provisional estimates used for 2014, as the final figures for 2014 are not yet available at the time of going to print. **ETSC estimates based on EC CARE Quick indicator. ***UK data for 2014 is GB provisional total for year ending September 2014 and Northern Ireland total for the calendar year 2014. Numbers of deaths in Malta are small and are therefore subject to substantial annual fluctuation. 120 100 80 60 40 20 0 MT SE UK*** NO* CH DK* IL NL ES* FI* DE* IE* SK AT FR SI CY IT* PT* EE* HU BE* LU CZ HR EL* RS* PL LT BG** RO LV EU28 average: -53% EU28 (2010): 63
Deaths per million inhabitants 2010 Deaths per million inhabitants 2014
EU 2010 EU 2014
Ranking EU progress on road safety | 15
<30 30-36 37-80 >80
Map 2: Road deaths per million inhabitants in 2014 (see Fig.6,
Table 3 in the Annexes)
1.7 Road deaths per vehicle-distance travelled
Fig.7 shows deaths per billion vehicle-km travelled for the 19 countries where up-to-date data on distance travelled are available. This indicator complements the well-established indicator of road mortality (Fig.6).
Sweden, the United Kingdom, Ireland and Norway have the lowest numbers of road deaths per vehicle-km driven among the countries collecting up-to-date data. Road risk by distance travelled in Latvia, Croatia and the Czech Republic is almost five times as high as in Sweden. Differences between the relative positions of countries in Fig.6 and Fig.7 can arise from differences in aspects such as usage of motorcycling, cycling or walking, the traffic density, the proportions of traffic on motorways or rural roads and the method for estimating the number of vehicle-km travelled. 18 16 14 12 10 8 6 4 2 0 SE UK* IE* NO* DK* FI* CH NL DE* IL FR* AT BE* IT* EE* PT* CZ HR** LV
Fig. 7: Road deaths per billion vehicle-km. Average for the latest three years for which both the road deaths and the estimated data on distance travelled are available.
2012-2014 (SE, UK, FI, CH, DK, IT, IL, LV, HR), 2011-2013 (IE, NO, NL, DE, FR, AT, BE, EE, PT), 2010-2012 (CZ). *Provisional figures for road deaths in 2014. **Road deaths per billion vehicle-km travelled by cars.
1.8 Drink driving
Speeding, failure to wear a seat belt and drink driving are the three main risky behaviours on the roads8.
The European Commission estimates that across the EU around 25% of all road deaths are alcohol related. Fig.8 shows individual country performance in reducing road deaths attributed to drink driving compared with progress in reducing other road deaths, using each country’s own method of identifying alcohol-related deaths. In more than half of the countries, progress in reducing drink driving has contributed more than its share to overall reductions in deaths.
In Latvia, drink driving deaths were cut by 8% faster than other road deaths each year on average since 2001. In Sweden drink driving deaths fell by around 7% per year faster than other road deaths, in Slovenia by 6% and Hungary by around 5%. In Cyprus, Serbia, the Czech Republic, Romania, Slovakia, Finland and Croatia, developments in drink driving deaths have slowed down overall progress in reducing road deaths.
8 Countries’ progress in tackling speeding and non-use of seat belt can be found in the 27th PIN Flash report
(2014), Ranking EU progress on Car Occupant Safety.
Fig. 8: Difference between the average annual percentage change in the number of road deaths attributed to alcohol and the corresponding reduction for other road deaths over the period 2001-2013 or 2014. EU average is calculated for 2013 for 20 EU countries that could provide the whole time series data up to 2013 or 2014
*2001-2013. LU is excluded as annual numbers of deaths attributed to alcohol are below 10 but its number is included in the EU average. 15% 10% 5% 0% -5% -10% LV SE SI HU DK* DE* EE CH GB* FR AT IL ES BE* PL* HR FI SK RO** CZ RS* CY EU20 average: -1.1%
Ranking EU progress on road safety | 17
INDICA
TOR
i
Levels of deaths attributed to drink driving cannot be compared between countries, as there are large differences in the way in which countries define and record a ‘road death attributed to drink driving’. Researchers in the European research project SafetyNet recommend using the definition of “any death occurring as a result of road accident in which any active participant was found with blood alcohol level above the legal limit”. National definitions as provided by PIN Panellists are available in the Annexes. While some EU countries have adopted the SafetyNet recommended definition, in practice, it seems to be mostly drivers involved in collisions who are tested for alcohol. The extent to which other road users involved in fatal collisions are tested varies considerably among countries9.Countries are therefore compared on the basis of developments in deaths attributed to drink driving relative to developments in other road deaths, using each country’s own method of identifying alcohol-related deaths (Fig.8). This ranking has been published previously in ETSC (2012), Drink Driving: Towards Zero Tolerance, updating the rankings published in the ETSC (2010) 4th Road Safety PIN Report, Chapter 3, which also mentions the issue of underreporting of drink-driving deaths, and ETSC (2014), Ranking EU progress on car occupant safety.
The numbers of deaths attributed to drink driving were supplied by the PIN Panellists in each country. Estimates of the number of deaths attributed to drink driving are not available in Malta, Italy (since 2009), Portugal, Sweden and Spain. For Spain and Sweden the numbers of killed drivers who tested positive in post-mortem blood alcohol tests were used in their place. Since 2007 Sweden has recorded total numbers of deaths in alcohol-related accidents and over the period 2007-2014 the estimated average annual percentage change in this number is -9.2%, compared with -6.1% for other road deaths over the same period.
Ireland has recently completed a review of police forensic investigation and coroner files for all fatal collisions occurring between 2008 and 2012, and will be publishing a series of reports on all pre-crash factors, including alcohol and drugs by the end of 2015.
9 Killed and unconscious road users are not tested for alcohol in Austria unless the prosecutor requires it. In
Belgium, Germany and The Netherlands, drivers killed on the spot might not be tested. In Romania, testing might only occur when the Police suspect the presence of alcohol.
+2.6%
Increase in the
number recorded
by the police as
seriously injured
in 2014
PART II
SLOWER PROGRESS IN REDUCING
THE NUMBERS SERIOUSLY INJURED
2.1 Time for the EU to deliver on its promise to introduce a serious injury target
In 2014 more than 203,500 people were recorded by the police as seriously injured on the roads in the 23 EU countries distinguishing between seriously and slightly injured in their data, representing an increase of 2.6% compared to 2013.
The European Commission presented its ‘First Milestone towards an injury strategy’ in March 201310, as the first step towards coming up with a strategy. Following this, the European Parliament adopted a Resolution “urging the Commission, on the basis of the data collected, to set an ambitious target of reducing road injuries.”11 ETSC welcomed the adoption of a common EU definition of seriously injured casualties as in-patients with an injury level of MAIS 3 or more12. The Abbreviated Injury Scale (AIS) is a globally accepted trauma classification of injuries, which ranges from 1 (minor injuries) to 6 (non-treatable injuries) and is used by medical professionals to describe the severity of injury for each of the nine regions of the body (Head, Face, Neck, Thorax, Abdomen, Spine, Upper Extremity, Lower Extremity, External and other). As one person can have more than one injury, the Maximum Abbreviated Injury Score (MAIS) is the maximum AIS of all injury diagnoses for a person.
The High Level Group on Road Safety representing all EU Member States identified three main ways Member States can choose to collect the data in accordance with the MAIS3+ definition: continue to use police data but apply a correction coefficient; report the number of injured based on data from hospitals; or create a link between police and hospital data. Member States should also continue collecting data based on their previous definitions so as to be able to monitor rate of continuation of progress prior to 2014.
ETSC’s key recommendations to Member States
Adapt or supplement data collection systems to be able to report the annual number of seriously injured on the roads as MAIS3+.
Set national reduction targets for numbers seriously injured based on MAIS3+ alongside the reduction of deaths.
Work towards establishing a system of linking police and hospital databases to report seriously injured road casualties.
Continue collecting data based on the previous definition of serious injury after implementing the new definition.
Include serious injuries in the impact assessment of countermeasures, where this does not take place already.
10 European Commission (2013) Commission Staff Working Document: On the Implementation of Objective 6 of
the European Commission’s Policy Orientations on Road Safety 2011-2020 – First Milestone Towards an Injury Strategy.
11 European Parliament Resolution (2013) Road safety 2011-2020 – First milestones towards an injury strategy
Ranking EU progress on road safety | 19
2.2 ETSC recommends the EU to adopt a target of 35% reduction between 2014 and 2020 in the number of people seriously injured on the roads
The European Commission has committed to setting in 2015 a common EU target for the reduction in the number of seriously injured people by 2020.13 As indicated in Fig.9, a 35% reduction in the number of seriously injured over the period 2014-2020 would be similarly challenging and achievable for the Member States to the target to halve road deaths between 2010 and 202014.
“2014 was a very bad year in terms of improving road safety on European Roads (…). Most measures, related to road safety, especially the ones with the most immediate impact are taken with Member States (…). But, of course, the EU also has its role to play (…)(…) [W]e intend to set up for the first time ever a target for the reduction of serious road injuries and define a strategy to meet this target.”
Violeta Bulc, Commissioner for Transport, at a Press conference, 24 March 2014.15
ETSC’s key recommendations to EU Institutions
Adopt a fully fledged strategy to tackle serious injuries including measures against which delivery can be made accountable.
Adopt a target to reduce by 35% between 2014 and 2020 the number of people seriously injured based on MAIS3+.
Support the exchange of best practice between Member States on how to report seriously injured road casualties.
Continue to review the procedures used by Member States to estimate the number of people seriously injured with a view to achieving comparability even though a variety of methods will be used in practice to implement the common definition.
13 European Commission (2015), Press conference by Violeta Bulc on the new road safety statistics for 2014.
14 ETSC (2013), ETSC Response to the European Commission’s ‘First Milestone Towards a Injury Strategy.
15 European Commission (2015), Press conference by Violeta Bulc on the new road safety statistics for 2014.
0% -10% -20% -30% -40% -50% -60% 2010 2011 2012 2013 2014 2015 2016 2017 2018 2019 2020 Fig. 9: Reduction in the
number of road deaths since 2010 (dark blue line) plotted against the EU target for 2020 (light blue dotted line), with ETSC’s recommended target for reduction in the number seriously injured (orange dotted line) – in each case an annual reduction
of 6.7%.
Reduction observed in road deaths EU road deaths target ETSC proposed serious
injuries target
Violeta Bulc, Commissioner for Transport
INDICA
TOR
i
2.3 Country comparison
Sweden, Belgium, Finland, the Netherlands and Spain are taking the lead in collecting data on the total number of people seriously injured based on MAIS 3+ (see Annexes). Other countries are discussing the methods to adapt their data collection and reporting systems to the new EU-wide definition.
It is however too early to use only data based on MAIS 3+ for country comparisons. Fig.10 therefore shows the percentage change in the number of seriously injured over the period 2010-2014 using current national definitions of serious injury. National definitions supplied by PIN Panellists are available in the Annexes.
Greece has achieved the biggest reduction since 2010 in the number of recorded serious injuries (-37%), followed by Latvia (-24%), Ireland (-22%) and Cyprus (-20%).16 The number of serious injuries increased however in Malta, Germany, Sweden, Poland and The Netherlands. Collectively the number of serious injuries in the EU23 was reduced by 1.6% since 2010 compared to an 18% decrease in the number of road deaths in the same group of countries.
It is not yet possible to compare the number of seriously injured between Member States because of the different definitions of serious injury together with differing levels of underreporting. The comparison therefore takes as a starting point the changes in the recorded numbers of seriously injured since 2010 (Fig.10). The changes in these numbers since 2001 are compared to the corresponding changes in the numbers of deaths since 2001 (Fig.11).
We give priority to serious injuries rather than slight or total injuries because of the greater impacts of serious injuries on society. Moreover, serious injuries are more likely to be recorded by the Police than slight injuries17.
The numbers of seriously injured were supplied by the PIN panellist in each country, using the prevailing national definition. The full dataset, together with the national definitions, are available in the Annexes. All PIN countries collect data on “serious” injuries with the exception of Estonia, Finland, Italy and Lithuania where no distinction is made between “serious” and “slight” injuries. Later this year Finland will have data on MAIS3+ for 2014. In Belgium, Denmark, the Netherlands and Spain the latest year available is 2013. Numbers of people seriously injured in 2014 are provisional in Ireland, Serbia, Norway and Germany. In the United Kingdom 2014 figures are
16 The reader should bear in mind that large differences in definition and reporting practices for seriously injured
road users exist between countries and that changes in reporting practices might have affected the trend in some Member States.
17 ETSC (2007), Social and Economic consequences of Road Traffic Injury in Europe.
Fig. 10: Percentage change in recorded serious injuries between 2010 and 2014.
*Provisional serious injury data. **2010-2013. ***UK data for 2014 is GB provisional total for year ending September 2014 and Northern Ireland total for the calendar year 2014. AT is excluded from the figure due to substantial changes in the police reporting system but its number of serious injuries is included in the EU average. EU countries using a definition of seriously injured similar to having injuries requiring at least 24 hours as an in-patient: ES, BE, CY, CZ, DK, FR, DE, EL, IE, LU, PT, SK, UK, LV. 40% 30% 20% 10% 0% -10% -20% -30% -40% EU23 average: -1.6%
Ranking EU progress on road safety | 21
provisional based on the 12 months ending September 2014. Data on people seriously injured in Latvia have been available only since 2004. The definition of seriously injured changed in 2004 in France and in 2007 in Sweden. Shorter time series were therefore used for these countries.
Sixteen countries (BE, CY, CZ, DK, FR, DE, EL, IE, IL, LV, LU, PT, SK, ES, UK, CH) use similar definitions of severe injuries, spending at least one night in hospital as an in-patient or a close variant of this. In practice, however, in most European countries, there is unfortunately no standardised communication between police and hospitals and the categorisation as “serious” is often made by the police. All PIN countries except Sweden provided numbers of seriously injured recorded by the police. Within each country, a wide range of injuries are categorised as serious under the applicable definition. They range from lifelong disablement with severe damage to the brain or other vital parts of the body to injuries whose treatment takes only a few days and which have no longer-term consequences.
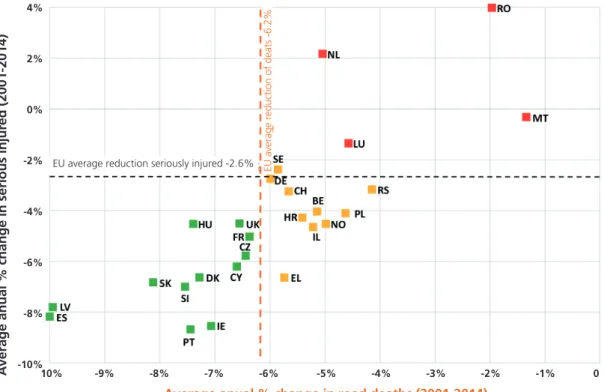
2.4 Reduction in serious injury lags behind reduction in road deaths Fig.11 looks at national progress in reducing the number of road deaths and the corresponding recorded number of seriously injured, in order to indicate to what extent the two have moved at a similar pace. The average annual percentage change in road deaths is plotted on the horizontal X-axis, and the average annual percentage change in seriously injured on the vertical Y-axis, with the EU averages shown by dotted lines. Green markers are used for countries having performed better than the EU average in both deaths and serious injury, red markers for those below the EU averages in both deaths and serious injury and amber markers for all the others - better than average in deaths but not in serious injury or vice-versa. Spain, Latvia, Slovakia, Slovenia, Hungary, Portugal, Denmark, Ireland, Cyprus, the United Kingdom, France and the Czech Republic have performed better than the EU average both in reducing seriously injured and road deaths. The majority of countries – 24 out of 27 – have reduced road deaths at a faster pace than seriously injured. The number of seriously injured went down at a faster pace than the number of road deaths in Ireland (by -1.5%), Greece and Portugal (both by -1%).
Fig. 11: Estimated average annual change in numbers seriously injured in part of period 2001-2014 for which data are available, plotted against the estimated average annual change in road deaths (2001-2014). Seriously injured: BE, DK, LU, MT (2001-2013); FR (2005-2014); NL (2001-2012); IE (2001-2012 and 2014), LV (2004-2014); SE (2007-2013). EU average excludes BG, EE, FI, IT and LT due to lack of data. 4% 2% 0% -2% -4% -6% -8% -10% A
verage anual % change in serious injur
ed (2001-2014)
Average anual % change in road deaths (2001-2014)
10% -9% -8% -7% -6% -5% -4% -3% -2% -1% 0
ETSC’s key recommendations to Member States
Streamline the emergency response chain and increase quality of trauma management in order to mitigate collision consequences more effectively. Encourage local governments to adopt zones with speed limits of 30km/h in
residential areas and areas used by many pedestrians and cyclists. ETSC’s key recommendations to EU Institutions
Within the context of the revision of Regulation 2009/661 concerning Type-Approval Requirements for the General Safety of Motor Vehicles:
Prioritise the introduction and further extension of in-vehicle safety technologies linked to the risk factors, which include Intelligent Speed Assistance, alcohol interlocks, seat belt reminders and Autonomous Emergency Braking18. Mandate Event Data Recorders in all new vehicles.
Develop mandatory requirements for safer goods vehicles for improved cabin design, underrun protection and removing exemptions that exist so as to require use of side guards to protect other road users in collisions with trucks.
Within the context of the revision of Regulation 2009/78 on the Protection of Pedestrians and other Vulnerable Road Users19:
Upgrade type approval crash tests to be more closely aligned with the pedestrian safety requirements of Euro NCAP crash tests.
Within the context of the review of the Infrastructure Safety Management Directive 2008/96:
Extend application of the instruments of the directive to cover all motorways, rural and urban roads.
Extend application of the instruments of the directive to cover tunnels and maintain all the safety requirements currently covered by the Tunnel Safety Directive 2004/54.
18 ETSC (2014), Ranking EU progress on car occupant safety, PIN Flash report 27.
19 Regulation (EC) No 78/2009 of the European Parliament and of the Council of 14 January 2009 on the
type-approval of motor vehicles with regard to the protection of pedestrians and other vulnerable road users, amending Directive 2007/46/EC and repealing Directives 2003/102/EC and 2005/66/EC.
Ranking EU progress on road safety | 23
PART III
SLOVENIA RECEIVES THE 2015 ROAD
SAFETY PIN AWARD
Slovenia’s progress in improving road safety was recognised with the 2015 Road Safety PIN Award at the 9th ETSC Road Safety PIN Conference in Brussels on 18 June 2015.
Road deaths have been cut by 61% in Slovenia since 2001, going down from 278 in 2001 to 108 in 2014 (Fig.5). Between 2013 and 2014 the country recorded the 5th best reduction with a 14% decrease in road deaths (Fig.1).
The road safety progress is also very visible when measured in terms of road deaths per head of population, with 52 deaths per million residents in 2014 compared to 140 in 2001 (Fig.6).
ETSC interviewed the Minister of Infrastructure, Peter Ga per ic, to get an insight into Slovenia’s progress and to find out how the country plans to keep on track towards the EU target for 2020.
Interview with Peter , Minister of Infrastructure
ETSC: Slovenia has reduced road deaths very significantly in recent years. What were the most effective measures that led to this result?
Today the Ministry of Infrastructure is responsible for the National Road Safety Program (NRSP) including roads, cycling paths, sidewalks, signalisation, level crossings and encouraging passengers to use public transport.
In order to carry out the measures of the program, the Slovenian Traffic Safety Agency (AVP) was established in 2010. The AVP is the central institution for traffic safety with a mission to reduce the worst consequences of accidents namely fatalities and injuries. The agency performs regulatory, developmental, technical, and other tasks regarding drivers and vehicles as well as analytical and research work in the field of road safety, prevention, road safety education, awareness-raising campaigns, training, and safety assessment of road infrastructure. The agency follows ‘vision zero’, i.e. working towards no fatalities in road accidents in Slovenia.
Some of the highlights of the measures we have taken in the road safety field are: Introduction of modern legislation and firm action against violations due to, for
example, speeding;
Effective measures, (e.g. preventive and rehabilitation programs) for repeat traffic offenders. An example is that drivers with four or more penalty points (and not exceeding 17) who may voluntarily attend a driver safety training course to be rewarded with a reduction of four points one time in three years; Additional focus on vulnerable road users and systematic and targeted preventive
campaigns for children, motorcyclists, pedestrians and cyclists;
Cooperation with various civil society organisations with goal-oriented activities for road safety and intense cooperation with local municipalities;
Dr. Peter , Minister of Infrastructure
Training programs for improving knowledge of individual experts as a preventive measure in the areas of transportation, infrastructure management, driver training, and motor vehicle roadworthiness;
Implementation of a vignette system in Slovenia and consequently moving more traffic to motorways;
Improvement of the first aid system and health care;
Implementation of road infrastructure safety assessment and inspection for all road types.
ETSC: Slovenia’s National Road Safety Program 2013-2022 sets a target of a maximum of 35 people killed per million inhabitants in 2022, down from 52 in 2014. In addition, the Program also sets a target of a maximum of 230 people seriously injured per million inhabitants in 2022, down from 402 in 2014. What steps are being taken to meet the targets?
The NRSP sets specific targets for various areas of road safety, for example: speed, use of alcohol and illicit drugs, motorcyclists, cyclists, pedestrians, seat belt use, young drivers, elderly drivers. In each of these areas the objectives are to reduce the number of fatalities and the number of seriously injured. These are set alongside activities and indicators to monitor the achievements.
We will also be focused on organisational improvements, as well as proper coordination and assurance of sustainable financial resources and political support for road safety. Similar activities will also be implemented at the local level, where more specific topics will be addressed, for example: key risk factors and causes of road accidents and vulnerable road users.
ETSC: In 2013 the European Union adopted a common definition of seriously injured casualties as in-patients with an injury level of ‘MAIS 3’ or more. What steps are being undertaken in Slovenia to improve the recording of serious injury data?
This year, Slovenia will try to connect the police database and hospital records for serious injury data. A few steps have already been taken. Efforts have been made to unify the definition of serious injury within the country. A plan to prepare a national strategy for this has been written; the responsible institution is the Ministry of Health. The next step is to convert the data for international comparison.
ETSC: How do you ensure smooth policy coordination between the government institutions responsible for the various aspects of road safety?
Coordination is assured through the Board of Directors and the Inter-ministerial Working Group responsible for monitoring and execution of the National Road Safety Program. The role of the Board of Directors is to monitor, lead and supervise the National Program, to ensure political coordination and to assure strategic guidelines as far as the National Program’s execution is concerned. For the execution of the National Program the Inter-ministerial Working Group was established, connecting professional organisations, individual experts, civil society, business, and local municipalities.
Ranking EU progress on road safety | 25
ETSC: Excessive speed is the leading cause of fatal collisions in Slovenia. Enforcement is a powerful deterrent, yet the potential is not being maximised. According to 2011 data, the number of speeding tickets issued was 49 per thousand population (compared to 587 in Austria).20 How are you planning to increase speed enforcement?
Let me highlight some activities which will be carried out in the coming years in this area:
Upgrading of enforcement equipment including time-over distance speed surveillance;
Development of new working methods, tactics and techniques for the traffic police;
Specialisation within the traffic police (road traffic control, accident investigators, highway control, road crimes);
Implementation of more speed measurements, reaching a higher probability that drivers who do not follow the speed limit will be caught and fined;
Introduction of new systems for speed measurement;
Improvement of traffic infrastructure, decreasing the worst consequences on dangerous sections (beginning in urban areas, in front of schools and child care centres);
Adoption of speed limits on individual road sections according to the needs of the actual situation;
Informing and educating the public with preventive campaigns about the dangers of excessive speed;
Encouraging the introduction of new technologies into vehicles including better passive safety and technologies that warn the driver about driving at excessive speed or even prevent them from driving at excessive speed.
ETSC: 23% of fatal road collisions in Slovenia in 2014 were alcohol-related. How are you going to reduce drink and drug driving in the future?
The share of people responsible for road accidents under the influence of alcohol has been decreasing more than proportionately to the reduction in the number of road accidents and is now around 10%. In order to prevent participation in traffic under the influence of alcohol, illicit drugs and other psychoactive substances, Slovenia has introduced stricter legislation and new rehabilitation schemes, and has strengthened the implementation of yearly preventive actions of state, expert institutions and civil society.
61% of respondents in a national survey agreed with the proposal to reduce the legal limit of alcohol when driving to zero. We have also used campaigns such as ‘0.0 driver’ and ‘Never ever drink and drive’ to target the younger generations. These were generally accepted, together with the legal restrictions for novice drivers, professionals and driving schools. The penalty point system is also contributing to a reduction in the number of drivers driving under the influence.
ETSC: According to a public opinion survey conducted by the Slovenian Traffic Safety Agency in 2012, more than 25% of drivers admit to using their phone while driving. How are you dealing with this?
Currently, we don’t have any reliable data regarding the number of road accidents or fatalities caused by use of a mobile phone while driving. In the future we will have to think about a change in legislation that would allow access to the database of mobile operators, in order to know the size of this problem. According to our research, the use of mobile phones while driving is extremely widespread and on the basis of these data it can be assumed that the use of mobile phones while driving is often one of the factors leading to road accidents.
Because we want to protect as many lives on our roads as we can, we tackle this problem also with other measures including awareness raising (public campaigns with mobile phone operators) and police enforcement.
ETSC: The National Cycling Network Development Strategy approved in 2005 aims at reaching 14% cycling modal share in Slovenia compared to 6.7% in 2005. Has this goal been achieved? How do you ensure safety for an increasing number of cyclists?
The official data concerning cycling modal share have not been recorded in recent years, but considering data from local municipalities the cycling modal share has been on the rise. Various activities on different levels in Slovenia are working towards the goal of increasing the safety of cyclists, for example: awareness raising related to road safety behaviour, establishing new preventive activities for cyclist safety, educating and training of cyclists in schools, promotion of safe cycling and at the same time focusing on mobility, environment, health benefits and reducing congestion in urban areas and by improving knowledge and enhancing communication and cooperation between the various areas related to cyclist safety. An important aspect of cyclist safety is cycling infrastructure improvement.
ETSC: The forthcoming revision of the EU General Safety Regulation21 offers an
opportunity to increase vehicle safety. Would you be supportive of mandatory fitting of technologies such as overridable Intelligent Speed Assistance, Intelligent seat belt reminders and Autonomous Emergency Braking systems on new vehicles?
Yes, of course. We are aware of the importance of technology in vehicle safety. The technology can affect and change road user behaviour in a positive ways and contribute to overall safety in traffic.
ETSC: Where has the EU Infrastructure Safety Management Directive22 been
implemented in Slovenia and what benefits has it brought in terms of road safety? Would you be supportive of extending the rules to the rest of the national road network?
The scope of work of road safety auditors in Slovenia is currently limited to the motorway network which is part of the trans-European road network. Road safety inspection and assessment can be carried out on other roads, but they are not mandatory. A decision to carry out RSI/RSA on local roads with the aim of road safety improvements in a local environment is made by each municipality on a voluntary basis (by subcontracting licensed road safety auditors).
21 Regulation (EC) No 661/2009 of the European Parliament and of the Council of 13 July 2009 concerning
type-approval requirements for the general safety of motor vehicles, their trailers and systems, components and separate technical units intended therefor.
22 Directive 2008/96/EC of the European Parliament and of the Council of 19 November 2008 on road
Ranking EU progress on road safety | 27
ANNEXES
Country ISO Code
Belgium BE Bulgaria BG Czech Republic CZ Denmark DK Germany DE Estonia EE Ireland IE Greece EL Spain ES France FR Croatia HR Italy IT Cyprus CY Latvia LV Lithuania LT Luxembourg LU Hungary HU Malta MT The Netherlands NL Austria AT Poland PL Portugal PT Romania RO Slovenia SI Slovakia SK Finland FI Sweden SE
The United Kingdom UK
Great Britain GB
Serbia RS
Israel IL
Norway NO