Labour Market Institutions and Unemployment.
An International Comparison
Gebhard Flaig
Horst Rottmann
CESIFO WORKING PAPER NO. 3558
CATEGORY 4: LABOUR MARKETS
AUGUST 2011
An electronic version of the paper may be downloaded
• from the SSRN website: www.SSRN.com
• from the RePEc website: www.RePEc.org
Labour Market Institutions and Unemployment.
An International Comparison
Abstract
This paper deals with the effects of labour market institutions on unemployment in a panel of 19 OECD countries for the period 1960 to 2000. In contrast to many other studies, we use long time series and analyze cyclically adjusted trend values of the unemployment rate. Our novel contribution is the estimation of panel models where we allow for heterogeneous effects of institutions on unemployment. Our main results are that on the average a tighter employment protection, a higher tax burden on labour income and a more generous unemployment insurance system increase, whereas a higher centralization of wage negotiations decreases unemployment. The strength of the effects differs considerably between countries.
JEL-Code: J230, E240, J500.
Keywords: employment protection, labour market institutions, unemployment, international comparison. Gebhard Flaig Department of Economics University of Munich Schackstrasse 4 Germany – 80539 Munich gebhard.flaig@lrz.uni-muenchen.de Horst Rottmann
University of Applied Sciences Amberg-Weiden
Hetzenrichter Weg 15 Germany – 92637 Weiden
h.rottmann@haw-aw.de
August 2011
The research in this paper is part of the project “Zukunft der Arbeit”, sponsored by funds of the “Pact for Research and Innovation”. The financial support is gratefully acknowledged. We thank participants at seminars at the Universität der Bundeswehr (Hamburg), Universität Osnabrück and the congress of the Verein für Socialpolitk for useful comments on an earlier version.
1 Introduction
Labour market institutions play a key role in explaining international differences in labour market performance, especially differences in the rate of unemployment. The most important labour market institutions considered in previous research are the unemployment benefit system and active labour market policy, the system of wage determination (wage bargaining centralization, union density, collective bargaining coverage), labour taxes including contributions to the social security system, and employment protection (see Nickell/Nunziata/Ochel 2005).
There are a great number of studies which explore the implications of institutions for the unemployment rate (see Nickell 1997, Nickell/Layard 1999, Blanchard/Wolfers 2000, Bertola/Blau/Kahn 2001, Nickell 2003, IMF 2003, Belot/van Ours 2004, Bassanini/Duval 2006, Griffith/Harrison/Macartney 2007; for a survey see Eichhorst/Feil/Braun 2008). Although the results are still somewhat mixed (OECD 2004), there seems to emerge a consensus that labour market institutions are one of the most important determinants of unemployment. For instance, Nickell (2003) reports that shifts in labour market institutions explain a great part of movements in unemployment across OECD countries. Employment protection, labour taxes and the unemployment benefit system increases unemployment and especially unemployment persistence. Admittedly, there exist some other studies, which find only weak evidence and attribute a much lower weight to labour market institutions (e.g., Baker/Glyn/Howell/Schmitt 2004, Bassanini/Duval 2006, Griffith/Harrison/Macartney 2007). However, as we will argue below, there are several shortcomings in these studies. Most of them are using only relatively short panels where the variations in institutions within the countries are relatively small and they neglect heterogeneity by assuming that the strength of the effect of institutions on unemployment is constant across the different countries.
In this paper, we use a panel data set for 19 OECD countries from 1960 to 2000 for an empirical analysis of the effects of labour market institutions on unemployment. Our main contributions to the literature are the following topics. Firstly, we stress the importance of using long time series in order to get reasonable and reliable estimates of the effects of institutions. Secondly, we use panel data models which allow capturing heterogeneous effects between countries. Many scholars point out, that the effects of a particular labour market institution depend on other labour market regulations and institutional settings. In order to capture these effects, many studies introduce several interaction terms among institutions. The main problem with this approach is that there are many possible interaction terms, which may require the estimation of a huge number of parameters. We use an alternative approach. In our empirical model, we allow that the parameters can vary across countries. This specification can capture some unobserved heterogeneity. Thirdly, our dependent variable to be explained is the trend component of the unemployment rate. This allows us to avoid the inclusion of
arbitrary defined cyclical variables as interest rates or output gaps or the use of five- or ten-year-averages (e.g. Blanchard/Wolfers 2000, Bertola/Blau/Kahn 2001) in order to purge the unemployment rate from business cycle effects.
The paper is organised as follows. In section 2 we discuss the theoretical foundation of our empirical work, especially the role of institutions in explaining the medium- and long-run development of the unemployment rate. In section 3 we present the data. Section 4 contains the empirical results and section 5 summarises and draws some conclusions
2 Some theoretical considerations 2.1 The basic model
In this paper, we concentrate on the explanation of the medium- and long-run development of unemployment in the OECD countries. As explained in detail below we purge the unemployment rate from all business cycle elements. The question we pose is the following: How far can we push the explanation of the international and time variation of the trend component of the unemployment rate by relying only on labour market institutions?
The theoretical framework is based on the concept of the quasi-equilibrium rate of unemployment (QERU), developed by Layard, Nickel, Jackman (2005), Lindbeck (1993) and Phelps (1994), among others (for a short description of the basic model see IMF 1999). In the long run, the equilibrium in the labour market is determined by the intersection of the price-setting curve and the wage-price-setting curve.
The price-setting curve describes the pricing behaviour of firms with market power in imperfectly competitive goods markets. The output price is determined by a mark-up over marginal costs. It is assumed that marginal costs are increasing in employment. This implies in turn that the real producer wage rate is decreasing in employment. Labour market institutions affect the location of the price-setting schedule as they can have a direct effect on marginal costs. For instance, higher indirect taxes or higher employer contributions to the social security system increase marginal costs and the real wage compatible with the profit maximization condition is then lower for all levels of employment. Tighter employment protection legislation can also increase the marginal costs, as changes in the number of employees (hiring and firing) are more costly.
The wage-setting curve describes as a reduced form the outcome of the wage bargaining process. The real wage rate depends positively on the level of employment and is affected by many institutional settings. The positive relationship between employment and the negotiated real wage rate can be explained by the fact that higher employment (lower unemployment) strengthens the bargaining power of insiders and/or trade unions or by efficiency wage considerations (no-shirking condition). A more stringent employment protection strengthens
the power of insiders who are represented by trade unions: At each level of employment, the negotiated wage rate will be higher (some qualifications to this statement will be discussed below). Higher contributions to the social security system by employees or higher taxes on labour income may induce trade unions to demand higher wages. The degree of coordination and centralization of wage negations can have complex effects on the negotiated wage rate. Since marginal costs as well as the wage determined in the negation process depend on employment, for a given set of institutional factors there exists an equilibrium value for which the wage setting and the price setting curves intersect. This equilibrium determines the real wage rate and the medium run unemployment rate. If institutions change, the power and the incentives of firms and/or unions are affected and the equilibrium rate of unemployment may change. Although theory does not offer unambiguous results, many empirical studies suggest that the net effects of a higher tax burden on labour income, of a more generous unemployment insurance system and of a higher degree of employment protection all lead to a higher equilibrium real wage rate and to a higher unemployment rate. With respect to the coordination/centralization indicator, the effect is not so clear. There may exist an inverted u-shaped relationship. The power of labour unions has also no clear effect.
2.2 The role of institutions
In our empirical analysis we analyze the effects of the following institutions: Employment protection legislation, the generosity of the unemployment insurance system, the tax burden on labour income, the power of trade unions measured by union density and the degree of centralization in wage negotiations.
Employment protection
More stringent employment protection legislation may have several effects on the price and wage setting functions. Firstly, there exists a direct cost increasing effect on the side of firms. Secondly, as the employed insiders are to a certain degree protected against dismissals the trade unions may be induced to demand higher wages. Both channels lead to higher wage costs and to lower employment and a higher unemployment rate. Nevertheless, from a theoretical standpoint the effects of employment protection are not clear-cut. If the government requires firms to pay for stringent employment protection and if workers value such benefits by as much as they cost, then the supply and demand curves for labour will shift down equally, leaving employment unchanged if wages are flexible (Summers 1989). In case of a binding minimum wage for low skilled workers or of the resistance of powerful trade unions to wage cuts, real wages do not decline enough to prevent a negative employment effect of the costs of employment protection. These negative effects can possibly be mitigated if employment protection legislation positively affects the overall labour market performance by protecting workers against arbitrary dismissals and therefore creating a more stable and
trusty work relationship and making workers more willing to invest in firm specific human capital.
Our measure for employment protection legislation (EPL) is taken from Allard (2005a). Her work is based on the OECD methodology and extended by reviewing the ILO’s International Encyclopedia for Labor Law and Industrial Relations. Like the OECD indicator, the Allard´s measure takes into account regulations concerning individual dismissals, collective dismissals and the temporary employment forms such as fixed-term employment and the supply of labour by temporary work agencies. Econometric studies using the OECD indicator have the problem of a paucity of observations - 21 countries and only two years (late 1980s and 1990s) until 2002 – that limit researchers to relate changes in employment protection regulation over a long time period to fluctuations in unemployment rates. The Allard indicator has yearly data from 1950 to 2003. This indicator shows sharp increases in regulation in the 1964-1978 period and some deregulations afterwards (Allard 2005a). Figure 1 shows the development of the indicator for some selected OECD countries. The figure clearly reveals that a more stringent employment protection was enacted in many countries from the end of the sixties to the end of the seventies. This is confirmed by the evolution of the mean value. Since the beginning of the eighties only in few countries an economically significant change in employment protection took place.
Figure 1: Employment Protection Index in selected OECD countries
0 1 2 3 Emp l. Pro te c ti o n Al la rd 1960 1970 1980 1990 2000 year austria france germany netherlands united_kingdom united_states
Unemployment insurance system
Unemployment benefits provide income to unemployed persons. This leads to an increase in the reservation wage and to a reduction of job search intensity. Search unemployment is higher. Further, when the unemployment insurance system is generous, trade unions may down weight the disutility of unemployment for their members and prefer higher real wages for the employed. Employment will be affected negatively. A row of microeconometric studies confirm the expectation that generous unemployment benefits increase the average unemployment duration (e.g. Katz/Meyer 1990, Hunt 1995, Lalive/van Ours/Zweimüller 2006).
For the generosity of the unemployment benefit system (NRW) we use the calculations of Allard (2005 b). This indicator does not capture only the gross unemployment replacement rate but also other dimension of the generosity of the unemployment insurance system as the duration of entitlement, taxes on benefits and the conditions that must be met in order to receive the benefits (eligibility criteria). Her indicator enhanced the OECD´s gross replacement rates with aspects of the tax treatment of the benefits and the strictness of eligibility.1
Tax burden on labour income
Taxes on labour income comprise income taxes, contributions to the social security system (both by employers and by employees) and consumption taxes (VAT). Taxation on labour income imposes a wedge between the real producer labour costs and the purchasing power of the net wage. Trade unions will demand a higher gross wage rate. Some authors (e.g., Blanchard, 2006) argue that consumption taxes have no effect on unemployment since they are a burden both on employed and unemployed persons and therefore have no effect on the reservation wage. Analogue to this argumentation Pissarides (1998) finds in different wage bargaining models that taxes on labour income hardly influence the unemployment rate if the replacement ratio is proportional to the after-tax earnings. However, this is not always the case and one can argue (Nickell 2006) that a certain degree of real wage rigidity will lead to higher labour costs when labour taxes go up. Garcia/Sala (2008) finds that for many countries (especially continental European countries) not only the level of total tax burden is relevant for unemployment but also the proportion paid by employees compared to the proportion paid by firms.
Our measure of the tax burden is the tax wedge (TW) provided by W. Nickell (2006). This variable includes payroll taxes, social security contribution (both by employees and by
1
Allard emphasizes, that a good indicator of the generosity of the unemployment benefits must incorporate these aspects, because the OECD countries differ widely in their taxation and eligibility conditions of unemployment benefits.
employers), income taxes on labour income and indirect taxes (VAT and other consumption taxes). TW is computed by W. Nickell (2006) using data from the OECD National Accounts and the OECD Revenue Statistics
Coordination/centralization of wage bargaining
In most OECD countries wages are set by a collective bargaining between employers and trade unions. Because unions increase wage pressure, their existence will raise unemployment (Nickell/Layard 1999). Unions also tend to reduce the dispersion of wages by raising the earnings of less-skilled workers relative to higher skilled workers. If this wage compression is strong enough, it eliminates employment opportunities for low-wage workers. The extent to which unions can succeed in raising wages or compressing wage differentials depends on the power of unions, which is determined, amongst others, by the rate of unionisation. In our empirical analysis we use union density (UDNET) as an indicator. UDNET is measured as the ratio of active union members and employed workers and is taken from Visser (2006).
The result of wage negotiations between the unions and the employers may also depend on a high degree on the institutional settings of the bargaining process. When wage bargaining takes place at the firm level, both parties know that higher wage will lead to an increase in costs, to relative higher output prices of the firm and therefore to a loss of output and employment. This restrains the wage pressure. When the bargaining process is at the national level, the bargaining partners know that higher wages at the aggregate level will lead to a higher price level and therefore to a small increase in real wages. In addition, the induced inflation will probably encourage the central bank and/or the government to conduct a restrictive policy. Additionally, adverse macroeconomic shocks can be alleviated under highly coordinated bargaining, as centralized unions may be able to anticipate the macroeconomic effects of their wage bargains in ways that decentralized unions may not. For these reasons, the trade unions choose probably a cautious wage policy. The situation for negotiations on the industry level is somewhat different. Since all firms are affected in the same degree, the decrease in output and employment will be relatively small. Therefore, there is an incentive for trade unions to negotiate a higher wage rate. Since this is true for all industries, the aggregate wage rate and the equilibrium unemployment rate will be higher. The consequence is an inverted u-shaped relationship among the degree of centralization and unemployment (Calmfors/Driffill 1988).
These results however rely on partly special theoretical assumptions. Cahuc/Zylberberg (2004) point out, that other, equally plausible, assumptions in the bargaining model lead to a decreasing monotonic relationship between the degree of centralization of bargaining and the unemployment rate. The evidence suggests that highly centralized bargaining will completely offset the adverse effects of unionism on employment (Nickell/Layard 1999).
As a measure of centralization we use the indicator CEW provided by W. Nickell (2006) who refers to the original work of Ochel.
In many empirical studies (see, e.g., Bertola/Blau/Kahn, 2002; Blanchard/Wolfers, 2000; Nickel/Nunziata/Ochel, 2005) a measure of “coordination of wage bargaining” is used instead of the centralization of collective bargaining. Coordination results automatically from highly centralized wage bargaining, but can be also reached by institutions, such as employer or union federations, that can assist bargainers to act in concert even when bargaining itself occurs at the firm- or industry-level (Nickell 2006). In preliminary estimations, we have tried to include both the centralization measure CEW and the corresponding coordination measure (COW, see W. Nickel, 2006). In most of our models, COW was not significant and the signs of the estimated parameter were not robust. For this reason, we include only the centralization measure in the models presented in the next section.
3 Empirical results 3.1 Data
In our empirical investigation we use a panel data set for 19 OECD countries for the period from 1960 to 2000 (the list of countries is shown in table 4). We will show that it is crucial for getting reasonable and reliable empirical results to use data that comprise observations that start in the sixties or at least in the early seventies. The main reason is that we only then observe enough variability in the settings of labour market institutions within the countries. The dependent variable is the standardized unemployment rate, provided by the OECD. For some countries, the standardized unemployment rate is available only for part of the sample period. In these cases, we extrapolated back the available series by using the unemployment rate defined by national agencies. To be specific, we calculated the ratio of the standardized and the non-standardized series in the first two years for which both series are available and extrapolated back the standardized series by multiplying the national series by the specified ratio.
In order to get rid of the business cycle fluctuations we smooth the standardized unemployment rate using the Hodrick-Prescott (HP) filter. For the smoothing parameter λ we tried values of 10 and 100. From a visual inspection, one can see that for λ =10 the filtered series still contains some business cycle fluctuations. All empirical results in this paper are generated by using λ=100 for filtering the unemployment series, but the results do not change substantially when we use λ=10.
The use of the trend component of the unemployment rate has several advantages: We do not need to include in our model cyclical variables as the output gap, interest rates, exchange rates
etc. To eliminate cyclical effects, some authors use time averages (for instance over five- or ten-years periods). However, we can avoid this very arbitrary procedure.
Figure 2 shows for example the observed series of the unemployment rate in the national definition UR_n), the standardized unemployment rate (UR) as well as the filtered series (UR_10 and UR_100) for Germany and UK. .
Figure 2: National (UR_n) and standardized (UR) unemployment rate and smoothed unemployment rate (UR_10 and UR_100) for Germany and UK
0 5 10 15 1960 1970 1980 1990 20001960 1970 1980 1990 2000 germany united_kingdom UR_n UR UR_100 UR_10 year Graphs by land
Smoothed Unemployment Rates
There exist other possibilities to measure the QERU component of the unemployment rate. They typically rely on the estimation of Phillips curve (e.g., Gordon, 1997, Laubach, 2001, Bode/Fitzenberger/Franz, 2008). The estimated quasi-equilibrium unemployment rate is in many cases (at least for Germany and the US) not much different from the HP-filtered series. The definition and the sources for the indicators of labour market institutions were discussed in section 2.2. A very informative survey on the definition and measurement of different
labour market institutions is given in Eichhorst/Braun/Feil (2008). A useful collection of many indictors constructed by different authors and institutions is provided by W. Nickel (2006).
Table 1: Some descriptive statistics
Table 1 shows some descriptive statistics for the data. For the discussion of our later empirical results the change in the within variability of the data is especially important. The within standard deviation measures the variability over time within the countries. A comparison between the sample 1960-2000 and 1975-2000 reveals that for some variables (especially for the employment protection index EPL) the within variability is much lower in the shorter panel. As the fixed effects estimator relies only on the within variation (and the random effects estimator at least partly) we could expect that empirical analyses with data beginning in midst seventies (or even later) deliver only imprecise estimates. This is one reason why we prefer long data series in analysing the relationships between unemployment and institutions.
Variable Mean Std. Dev. Mean Std. Dev. Mean Std. Dev.
Period UR_10 overall 5.22 3.65 6.19 3.60 6.85 3.51 between 2.20 2.62 2.92 within 2.95 2.54 2.05 UR_100 overall 5.21 3.51 6.17 3.44 6.79 3.35 between 2.19 2.61 2.90 within 2.79 2.32 1.80 EPL overall 1.67 1.10 1.95 1.05 2.07 1.02 between 0.87 0.96 0.99 within 0.71 0.46 0.32 UDNET overall 42.32 18.34 42.89 19.36 42.63 20.17 between 17.87 19.09 19.98 within 7.02 5.87 5.60 NRW overall 9.78 8.61 11.81 8.66 12.86 8.60 between 5.71 6.72 7.06 within 6.57 5.67 5.16 CEW overall 2.06 0.65 2.00 0.63 1.96 0.61 between 0.57 0.55 0.54 within 0.34 0.33 0.32 TW overall 44.92 12.98 48.10 12.39 49.33 12.28 between 10.96 11.51 11.64 within 7.62 5.59 5.14
3.2 Estimation models
Using panel data, we have to deal with potential unobserved heterogeneity between countries2. In the presence of unobserved heterogeneity, even countries with the same values of all observed covariates (institutions) may have different values of the mean of the dependent variable (unemployment rate). There are some alternative approaches in order to model the influence of the unobserved country effects3. We use five different empirical specifications that can be explained by using the following equation:
k
i,t i,0 i, j,t i, j i,t
j 1
y x u
=
= β +
∑
β + (1)The index i denotes the country, the index t the year and the idiosyncratic error term is distributed as ui,t ∼⎡⎣0,σ2u⎤⎦. y is the trend component of the unemployment rate, x is a vector of k institutions, which are assumed to be strictly exogenous with respect to ui,t.. The
unobserved heterogeneity can be reflected in principle in different intercepts βi,0 and/or slope coefficients βi, j between the countries.
Model 1) Random effects (RE): The random effects model is the most restrictive model that accounts for unobserved heterogeneity. The slope coefficients are identical for all countries. The unobserved heterogeneity influences only the stochastic intercepts that are specified as the sum of a general constant β0 and a random variableεi,0 which must not be correlated with the regressors in the model. Therefore we haveβ = βi, j j, j 1,..., k= and β = β + εi,0 0 i,0, where the random effect is distributed as
0
2
i,0| xi ⎡0, ε ⎤
ε ∼⎣ σ ⎦. In case the assumption is violated, (εi,0is correlated with the observed regressors), the estimator for the slope coefficients is not consistent.
Model 2) Fixed effects (FE): The only but important difference to model 1 is that it is now allowed for the individual effects to be correlated with the observed covariates. In this case,
i,0
β is estimated as a fixed parameter.
Model 3) Random coefficients (RC): Additionally to the intercepts as in model 1 the slopes can vary across the countries: β = β + εi, j j i, j, where εi, j∼⎡⎣0,σε2, j⎤⎦, j=0,..., k. We refer to εi, j as the country effects.
2
We call the heterogeneity not individual effects, but country effects in our article. 3
The random variables εi, j are uncorrelated between countries and not correlated with u and i,t the observed regressors.. The first version of model 3 (RC_ind) allows for distinct variances of the country effects but assumes that εi, j and εi,s are uncorrelated forj≠s. In the second version of model 3 (RC_cor) the country effects for different indicators may be correlated within a country.
Model 4) Mixed model (MX): The intercepts are modelled as fixed effects, the slope parameters as random coefficients in the same way as in model 3.4 The first version (MX_ind) assumes again that the ε'sfor different explaining variables are uncorrelated whereas the second version (MX_cor) allows for correlated country effects.
To the best of our knowledge, in the empirical literature concerning the institution-unemployment nexus we find mostly models 1 and 2. These models allow only additive effects of unobserved heterogeneity and assume that the strength of the effect of institutions on unemployment is constant across countries. This may be a severe shortcoming. In this paper, we allow additionally heterogeneous effects of institutions on unemployment.
3.3 Empirical results
Table 2 shows the estimation results fort the fixed effects and the random effects model for the period 1960 to 2000 (FE_60 and RE_60, respectively). The estimated parameters and their standard errors are almost identical in both specifications. The χ2-statistic of the Hausman test with 5 degrees of freedom is 9.13 with a p-value of 0.104. This implies that we could not reject the hypothesis that the observed regressors are uncorrelated with the residual. On the other hand, the Akaike information criterion (AIC) favours the FE specification. All following discussions are based on the fixed effects model. Four institutions have a highly significant effect on the unemployment rate: Tighter employment protection (EPL), a higher replacement rate (NRW) and a higher tax wedge (TW) all increase unemployment, whereas a higher degree of centralization in the wage bargaining process (CEW) leads to a lower unemployment rate. The parameter for union density (UDNET) is positive but not significantly different from zero. In order to receive an impression of the economic relevance of the results we translate the estimated coefficients into the implied changes of the trend unemployment rate when we compare the minimum and the maximum observed values of the institutions. For the employment protection indicator we get an increase of 4.7 percentage points, for the replacement rate an increase of 3.1 percentage points, for the tax wedge an increase of 7.6 percentage points, for union density an increase of 0.3 percentage points and
4
In the literature the name mixed models is often used for more elaborate random effects models as for example random coefficients models or multilevel linear models (Cameron/Trivedi 2005). Here we deviate from the literature and use for model 4 this name to express that this specification permits random as well as fixed effects.
for the centralization indicator a decrease of 3.1 percentage points. With the exception of union density, the effects are relatively high but nevertheless in a plausible range.
Table 2: Panel estimations for Unemployment I
(1) (2) (3) (4) (5)
FE RE+ FE_70 FE_75 FE_cluster
EPL 1.147*** 1.153*** 0.999*** 0.084 1.147*** (0.124) (0.122) (0.152) (0.184) (0.397) UDNET 0.004 0.002 -0.002 0.006 0.004 (0.008) (0.008) (0.011) (0.011) (0.025) NRW 0.074*** 0.075*** 0.047*** 0.035*** 0.074*** (0.012) (0.012) (0.012) (0.012) (0.022) CEW -1.531*** -1.555*** -1.867*** -1.679*** -1.531* (0.202) (0.199) (0.218) (0.219) (0.746) TW 0.114*** 0.111*** 0.169*** 0.172*** 0.114** (0.012) (0.012) (0.013) (0.012) (0.041) cons 0.172 0.791 -0.902 0.498 0.172 (0.690) (1.001) (0.963) (1.069) (2.688) N 671 671 531 446 671 AIC 2402.49 2523.18 1808.26 1392.53 2400.49 r2_o 0.178 0.079 0.025 0.178 r2_w 0.620 0.552 0.465 0.620 r2_b 0.029 0.008 0.000 0.029 F-Value 113*** 124*** 146***
FE and RE: 1960 until 2000; FE_70: 1970 until 2000; FE_75: 1975 until 2000; FE_cluster: Estimation with cluster-robust standard errors, 1960 until 2000.
+
We use the maximum likelihood random-effects estimator
Standard errors in parentheses, * p < 0.10, ** p < 0.05, *** p < 0.01 r2_o: R2 overall; r2_w: R2 within; r2_B: R2 between.
F-Value: F-test for H0: No fixed effects
Next, we discuss the effect of different estimation periods for the results. Columns 3 and 4 in table 2 show the results for the fixed effects model for the period 1970 to 2000 (FE_70) and for the period 1975 to 2000 (FE_75), respectively.5 Compared with the results in column 1 (Fixed effects model for period 1960-2000), the results for the estimation period 1970 to 2000 show no dramatic changes. When we use the shortest panel (1975-2000), the parameter of employment protection is much lower and not significant. This can be explained with the already mentioned much lower within variability of the explaining variables, especially of the employment protection indicator.
A potential problem is that the reported standard errors require the errors to be i.i.d within a country. It is well known that inclusion of fixed or random individual-specific effects reduces the correlation in errors, but it may not be eliminated in panel data. Therefore, column 5 (FE_cluster) shows the fixed effects estimation with cluster-robust standard errors for the long
5
We show here only the fixed effects estimates, because there are no relevant differences, like with the longer panel, between random effect and fixed effect estimation.
panel 1960 to 2000.6 In many cases, the standard errors increase considerably, but the parameters of EPL, TW and NRW remain significant.
An alternative approach is to use a richer model for the unobserved country effects. The fixed and the random effects model allow only for heterogeneity in the intercept term but assume that the effects of the explaining variables have the same magnitude in all countries. There are many arguments why this may not be a correct assumption. For instance, the effect of the replacement rate may depend in an unmeasured way on the structure of the tax system or other institutions. One possibility to take into account such heterogeneity is to include interaction effects (see, e.g., Belot/van Ours, 2001). We choose an alternative and allow the parameters to vary across the countries.
As already explained in section 3.2, all parameters are now specified as β = β + εi, j j i, j. Table 3 shows for the estimation period 1960 to 2000 the mean values of the estimated parameters. We present the two versions of the random coefficients model (RC_ind and RC_cor) and the mixed model (MX_ind and MX_cor). The first version in each class of models assumes no correlation between the country effects for the indicators; in the second version, the country effects of the different institutions may be correlated within a country. There are no big differences between the models, the AIC favours marginally MX_ind. In all estimations, the reported standard errors are now very similar to those from the fixed effects model with cluster robust standard errors (see Table 2). For some institutions (EPL and TW) the estimated parameters are somewhat lower, for other institutions (NRW and CEW) they are (in an absolute sense) somewhat higher. The general economic interpretation does not change.
Table 3: Estimations of Models with Parameter Heterogeneity for Unemployment
(1) (6) (7) (8) (9)
FE RC_ind RC_cor MX_ind MX_cor
EPL 1.147*** 0.744** 0.843** 0.745** 0.742** (0.124) (0.347) (0.343) (0.349) (0.344) UDNET 0.004 0.037 0.046 0.044 0.044 (0.008) (0.052) (0.053) (0.055) (0.055) NRW 0.074*** 0.102*** 0.111** 0.101*** 0.103** (0.012) (0.036) (0.050) (0.039) (0.047) CEW -1.531*** -2.154** -1.517 -2.533** -2.806*** (0.202) (0.919) (1.025) (1.057) (1.029) TW 0.114*** 0.077** 0.068** 0.071** 0.075** (0.012) (0.030) (0.031) (0.032) (0.033) N 671 671 671 671 671 AIC 2402 1936 1919 1829 1845
Standard errors in parentheses, * p < 0.10, ** p < 0.05, *** p < 0.01 All models of table 3 are estimated for the period 1960 to 2000 We use the maximum likelihood estimator for the models (6) – (9).
6
Again, we present only the fixed effects estimates, because there are no relevant differences between random effect and fixed effect estimation with cluster robust standard errors.
In table 4 we present the estimated parameters for each country in our sample. The estimated coefficients for the employment protection indicator (EPL) are positive for 16 out of 19 countries. The exceptions are Japan, Sweden and the United States. The results for the labour union density (UDNET) are somewhat mixed as only 11 of 19 countries show a positive coefficient. This is not surprising, as the mean value of this parameter is highly insignificant. The coefficient for the replacement rate (NRW) is positive for 17 countries. The coefficient for the centralization indicator (CEW) is negative for 13 countries. The coefficient for the tax wedge (TW) is positive for 16 countries. These results imply that the estimated mean values of the parameters (Table 3) are not dominated by extreme values of single countries. With only small qualification we can conclude that the mean values represent a consistent picture across most countries in the sample concerning the effects of labour market institutions on the medium term development of the unemployment rate.
On the other hand, the results show also that there is a remarkable heterogeneity between the countries. This may have partly technical reasons (low within variability of indicators in individual countries or measurement errors). However, there may also exist special institutional settings that change the usual effect of a single labour market institution. For example, in the literature the institutional setting of Denmark is described as the flexicurity model, which is characterized by its unique combination of flexibility (measured by a low level of employment protection), social security (a generous system of social welfare and unemployment benefits) and active labour market programmes (Zhou 2007). An important role may also play the interrelationships between labour and product market regulations (Koeniger/Prat 2007). Or another example: The indicator for the generosity of the unemployment insurance system (NRW) is very low in Italy and in the United States. The effects on unemployment may be very different in the two countries. Compared to the US, in Italy the support of unemployed individuals by the family and insurance systems organized by trade unions is much higher. This may imply that the low “official” replacement rate in Italy has no wage dampening effect.
Table 4: Country Specific Parameters for MX_ind Estimation
Country EPL UDNET NRW CEW TW
Australia 1.034 0.079 0.181 -2.666 0.229 Austria 0.184 -0.097 0.006 -2.533 -0.011 Belgium 1.261 0.155 0.113 -2.533 0.077 Canada 2.669 0.360 0.105 -2.533 -0.097 Denmark 0.760 0.132 0.044 -1.742 -0.115 Finland 0.768 0.092 0.016 -8.676 0.212 France 1.849 -0.173 0.145 -2.533 0.067 Germany 2.176 -0.603 0.020 -2.533 0.171 Ireland 1.996 0.014 0.277 -1.939 0.071 Italy 1.827 0.013 -0.212 1.867 0.249 Japan -0.419 -0.153 0.088 -2.533 -0.009 Netherlands 0.847 0.280 0.083 -6.632 0.032 Norway 0.175 0.405 0.231 1.373 0.142 Portugal 0.154 0.075 0.050 -0.575 0.045 Spain 1.915 0.070 0.225 -2.696 0.064 Sweden -1.318 0.184 -0.022 -1.093 0.076 Switzerland 0.222 -0.011 0.060 -2.212 0.032 United Kingdom 0.268 0.088 0.087 -5.405 -0.014 United States -2.220 -0.078 0.419 -2.533 0.121
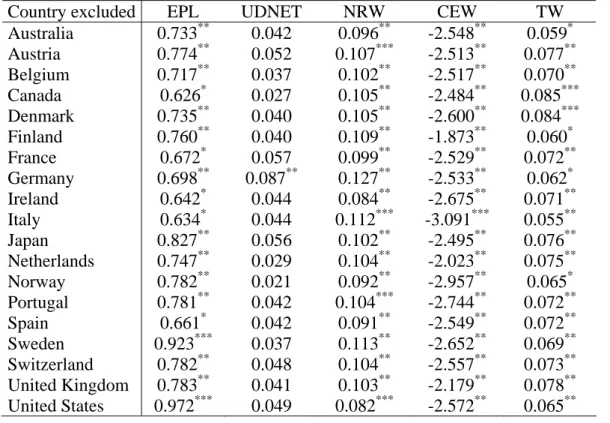
In order to check the stability and robustness of the results we estimated the model MX_ind for samples where we excluded in each case one country. Blanchard and Wolfers (2000) are doing the same robustness check in their seminal paper.The results are presented in table 5. The country shown in column 1 denotes the country that is excluded. The estimated mean vales of the parameters differ in a qualitative sense not very much between the samples. The stability of the parameters confirms our conclusion that the results does not depend crucially on the inclusion or exclusion of single countries.
Table 5: Stability of the parameters
Country excluded EPL UDNET NRW CEW TW
Australia 0.733** 0.042 0.096** -2.548** 0.059* Austria 0.774** 0.052 0.107*** -2.513** 0.077** Belgium 0.717** 0.037 0.102** -2.517** 0.070** Canada 0.626* 0.027 0.105** -2.484** 0.085*** Denmark 0.735** 0.040 0.105** -2.600** 0.084*** Finland 0.760** 0.040 0.109** -1.873** 0.060* France 0.672* 0.057 0.099** -2.529** 0.072** Germany 0.698** 0.087** 0.127** -2.533** 0.062* Ireland 0.642* 0.044 0.084** -2.675** 0.071** Italy 0.634* 0.044 0.112*** -3.091*** 0.055** Japan 0.827** 0.056 0.102** -2.495** 0.076** Netherlands 0.747** 0.029 0.104** -2.023** 0.075** Norway 0.782** 0.021 0.092** -2.957** 0.065* Portugal 0.781** 0.042 0.104*** -2.744** 0.072** Spain 0.661* 0.042 0.091** -2.549** 0.072** Sweden 0.923*** 0.037 0.113** -2.652** 0.069** Switzerland 0.782** 0.048 0.104** -2.557** 0.073** United Kingdom 0.783** 0.041 0.103** -2.179** 0.078** United States 0.972*** 0.049 0.082*** -2.572** 0.065**
As a last exercise, we calculate the model implied unemployment rates and compare them with the actually observed values. As figure 3 shows, for many countries there seems to exist a good fit. Nice examples are Austria, Belgium, Denmark, ‘France, Netherlands or United Kingdom.
Figure 3: Observed and estimated unemployment rates (trend component)
0 5 10 0 5 10 1960 1970 1980 1990 20001960 1970 1980 1990 20001960 1970 1980 1990 20001960 1970 1980 1990 2000
austria belgium denmark france
germany netherlands united_kingdom united_states
UR_100 Estimation from model MX_ind
year
Graphs by land
For some countries, the fit is not totally satisfactory. Especially, in Germany the model implies a very strong jump of the unemployment rate in the early seventies and an erratic behaviour in the early nineties. A QQ-plot, as a test of normality of the residuals, shows significant deviations for Germany in the years 1972 to 1974 and in the years 1991 and 1992. In all other countries, there is no significant departure from normality. The problem in Germany for the years 1991/92 may be due to some data problem in the first years after the German reunification. The sharp increase of the predicted unemployment rate in the early seventies is generated in large part by the dramatic increase in the indicator of employment protection as measured by Allard (see Figure 1). Within three years, the indicator jumps from a value of about 1.1 to 2.9. This may be an overstatement of the actual development. However, we like to stress that the increasing trend of the unemployment rate in Germany can be explained by a model relying solely on institutional settings.
4 Summary and conclusions
Using different empirical models, we analyzed the effects of important labour market institutions on the trend component of the unemployment rate in 19 OECD countries for the period from 1960 to 2000. Our main results are: A tighter employment protection legislation, a more generous unemployment insurance system and a higher tax burden of labour income increase the medium term development of the unemployment rate, whereas a higher centralization of the wage bargaining process lowers unemployment. Union density has no clear effect and seems to be unimportant. The stability of these results across different statistical models and different samples clearly indicates that labour market institutions are important determinants of the unemployment rate. Figure 3 shows that the model is able to reproduce the main characteristics of the development of the unemployment rate in most countries. It can explain both the cross-section variation between countries and the time series development within a country. A crucial prerequisite for finding clear and significant effects of institutions on unemployment is the use of samples with sufficient variability of the explaining variables over time within countries. In many countries, major changes in institutional settings took place in the late sixties and early seventies in the previous century. In order to get reliable results it is essential to include these years in the sample.
An important result of our study is the remarkable heterogeneity between countries. The estimated parameters scatter about the common mean. The strength of the effect of a labour market institution may depend on a large number of unmeasured economic and cultural factors and on complicated interactions between imperfectly measured institutional settings. That means that not in each country a change of an institution may have a noticeably impact on unemployment. Nevertheless, a fair summary of our empirical results is the conclusion that on the average and in most cases also for an individual country institutional settings are an important determinant of the medium term development of the unemployment rate.
The unemployment rate is only one among a greater list of indicators of labour market performance. In a study for 60 countries, Caballero et al. (2004) find that job security regulation reduces the speed of adjustment of employment to shocks and lowers the growth rate of total factor productivity. The results in Gomez-Salvador, Messina and Vallanti (2004) show that the strictness of employment protection, the extent of wage bargaining co-ordination and the generosity of unemployment benefits have a negative effect on job creation and the pace of job reallocation. Messina (2005) finds that more unionized and coordinated wage-setting structures as well as employment protection imply a lower employment share in the service industry that is the most expanding sector in modern economies. Bartelsman et al. (2010) show in a calibrated model that high-risk innovative sectors are relatively smaller in countries with strict employment protection legislation. This may reduce the growth rate of total factor productivity. Flaig/Rottmann (2009) find that a stricter employment protection and a higher tax wedge reduce the labour intensity of production. Lommerlund/Straume (2010) show that more employment protection decreases firms incentives for the adoption of new technologies. This (not complete) list of results of research complements the conclusion of our study that labour market institutions have an import and significant effects on labour markets outcomes.
Literature:
Allard, G. (2005a), Measuring Job Security over Time: In Search of a Historical Indicator for EPL (Employment Protection Legislation). IE Working Paper 05-17.
Allard, G. (2005b), Measuring the Changing Generosity of Unemployment Benefits: Beyond Existing Indicators. IE Working Paper 05-18.
Baker, D., Glyn, A., Howell, D. and J. Schmitt (2004), Unemployment and Labor Market Institutions: The Failure of the Empirical Case for Deregulation. CEPA Working Paper 2004
Bassanini, A. and R. Duval (2006), The Determinants of Unemployment across OECD Countries: Reassessing the Role of Policies and Institutions. OECD Economic Studies, 42, 7-86.
Bartelsman, E.J., De Wind, J. and P.A. Gautier (2010), Employment Protection, Technology Choice, and Worker Allocation. CEPR Discussion paper No 7806
Belot, M. and J. C. van Ours (2004) Does the Recent Success of Some OECD Countries in Lowering their Unemployment Rates Lie in the Clever Design of their Labour Market Reforms?, Oxford Economic Papers, 56, 621 - 642.
Bertola, G., Blau, F. D. and L. M. Kahn (2001) Comparative Analysis of Labor Market Outcomes: Lessons for the US from International Long-Run Evidence, NBER Working Paper, 8526.
Blanchard, O. (2006), European Unemployment. Economic Policy, 5-47
Blanchard, O. and J. Wolfers (2000), The Role of Shocks and Institutions in the Rise of European Unemployment: The Aggregate Evidence. Economic Journal 110, C1-C33. Bode, O., B. Fitzenberger and W. Franz (2008), The Phillips Curve and NAIRU Revisited:
New Estimates for Germany, Jahrbücher für Nationalökonomie und Statistik 228 (5+6), 465-496.
Caballero, R. J., Cowan, K., Engel, E.M.R.A. and A. Micco (2004), Effective Labor Regulations and Microeconomic Flexibility. MIT Working Paper No. 04-30.
Cahuc, P. and A. Zylberberg (2004), Labor Economics. MIT Press.
Calmfors, L. and J. Driffill (1988), Bargaining Structure, Corporatism and Macroeconomic Performance. Economic Policy, 14-61
Cameron, A. C. and P. K. Trivedi (2005), Microeconometrics Methods and Applications, Cambridge University Press, Cambridge.
Eichhorst, W., Feil, M. and C. Braun (2008), What Have we Learned? Assessing Labor Market Institutions and Indicators. IZA Discussion Paper No 3470.
Flaig, G. and H. Rottmann (2009), Labour Market Institutions and the Employment Intensity of Output Growth. Jahrbücher für Nationalökonomie und Statistik 229, 22-35.
Garcia, J. R. / Sala, H. (2008), The Tax System Incidence on Unemployment: A Country-specific Analysis for the OECD Economies. Economic Modelling 25, 1232-1245
Gomez-Salvador, R. Messina, J. and G. Vallanti (2004), Gross Job Flows and Institutions in Europe. ECB Working Paper No. 318.
Gordon, R. J. (1997), The Time-Varying NAIRU and its Implications for Economic Policy. Journal of Economic Perspectives, Vol. 11, 11-32.
Griffith, R., Harrison, R. and G. Macartney (2007), Product Market Reforms, Labour Market Institutions and Unemployment. Economic Journal 117, C142-C166.
Hsiao, C. (2003), Analysis of Panel Data. 2nd ed., Cambridge University Press, Cambridge. Hunt, J. (1995), The Impact of Unemployment Compensation on Unemployment Duration in
Germany, Journal of Labour Economics 13, 88-120.
IMF (1999), World Economic Outlook, May1999, Chapter IV: Chronic Unemployment in the Euro Area: Causes and Cures
IMF (2003), World Economic Outlook, April 2003, Chapter IV: Unemployment and Labor Market Institutions: Why Reforms pay off
Katz, L. and B. Meyer (1990), The Impact of Potential Duration of Unemployment Benefits on the Duration of Unemployment, Journal of Public Economics 41, 45-72.
Koeniger, W. and J. Prat (2007), Employment Protection, Product Regulation and Firm Selection. Economic Journal 117, F302-F332.
Lalive, R., J. van Ours and J. Zweimüller (2006), How Changes in Financial Incentives Affect the Duration of Unemployment, Review of Economic Studies 73, 1009-1038.
Laubach, T. (2001), Measuring the NAIRU: Evidence from Seven Countries. Review of Economics and Statistics, 83, 218-231
Layard, R., Nickell, S. and R. Jackman, (2005), Unemployment. Macroeconomic Performance and the Labour Market. Second edition. Oxford University Press
Lindbeck, A. (1993), Unemployment and Macroeconomics. MIT Press
Lommerlund, K. E. and O. R. Straume (2010), Employment Protection Versus Flexicurity: On Technology Adoption in Unionised Firms. CEPR Discussion Paper No 7919
Messina, J. (2005), Institutions and Service Employment: A Panel Study for OECD Countries. Labour 19, 343-372.
Nickell, S. (1997), Unemployment and Labour Market Rigidities: Europe versus North America. Journal of Economic Perspectives 11, 55-74.
Nickell, S. (2003), Labour Market Institutions and Unemployment in OECD Countries. CESifo DICE Report 1(2), 13-26.
Nickell, S. (2006), A picture of European unemployment: success and failure. In: M. Werding (ed.) Structural unemployment in western Europe. Reasons and remedies, MIT Press Nickell, S. and R. Layard (1999), Labour Market Institutions and Economic Performance. In:
O. Ashenfelter and D. Card (eds.), Handbook of Labor Economics, Vol.3. North Holland, Amsterdam.
Nickell, S., Nunziata, L. and W. Ochel (2005), Unemployment in the OECD since the 1960s. What do we Know? Economic Journal 115, 1-27.
Nickell, W. (2006), The CEP-OECD Institutions Data Set (1960-2004). CEP Discussion Paper No 759
OECD (2004), OECD Employment Outlook. Paris.
Phelps, E: (1994), Structural Slumps: The Modern Equilibrium Theory of Unemployment, Interest and Assets. Harvard University Press
Pissarides C. A. (1998), The Impact of Employment Tax Cuts on Unemployment and Wages: The Role of Unemployment Benefits and Tax Structure. European Economic Review 47, 155-183.
Summers, L. (1989), Some Simple Economics of Mandated Benefits. American Economic Review 79, 177-183.
Visser, J. (2006), Union Membership Statistics in 24 Countries. Monthly Labour Review, 38-49
Zhou, J (2007), Danish for All? Balancing Flexibility with Security: The Flexicurity Model, IMF Working Paper 07(36).