The Contribution of Rural Urban Migration to Migrants’
Economic Development in Tamale
Abdul-Rahaman Ibn Imoru Rudith Sylvana King
Centre for Settlement Studies, College of Art and Built Environment, KNUST, Kumasi, Ghana Abstract
Economic development aims at improving the economic and social well-being of people. In essence economic development implies a positive change of persons. Such changes may involve multiple areas including development of human capital, social capital, health, sanitation, water, housing, savings, income and asset ownership. To achieve this, rural people pursue rural to urban migration as a pathway to survival and to improve their well-being. Nonetheless it is commonly believed that rural-urban migration cannot lead to improvements in migrants’ well-being. This study, therefore sought to find out the contribution of rural urban migration to the economic development of the migrants’. In finding out the contributions to the rural migrants’ therefore, the indicators of economic development as named above were divided into three: social status, economic status and the poverty level of migrants’, and analyzed by Social Status Index (SSI), Economic Status Index (ESI) and the asset based approach of measuring poverty respectively. The research design employed for the study was a descriptive strategy of inquiry. Whiles the communities (4) were purposively selected, the migrants’ were sampled using snowball sampling, thus 30 migrants’/households in each community. Questionnaires were employed to gather primary data. The findings revealed that rural-urban migration contribute to the economic development of migrants’ since the SSI and ESI of migrants’ improved by 54.4% and 64.4% respectively whiles with their asset ownership, the number of migrants’ who had no asset reduced significantly to 5.8% after migration from 61.7% before migration.
Keywords: Rural-urban migration, Migrants’, Economic Development 1. Introduction
The travel of persons from origin areas to destination areas is a usual occurrence amongst human circles (Isaac & Raqib 2013). As a result, all human societies including individual human beings have experienced this movement whether from urban to rural or rural to urban, or urban to urban or rural to rural. However, notably, people choose to migrate to places where there are more opportunities than their rural communities (Minjale 2014; McGranahan & Tacoli 2006). Undoubtedly these movements are more often than not made towards the urban settlements especially in developing countries because of the advantages and opportunities that are characterized and associated with them (Dremel 2013), where the individual migrant expects his or her skills to earn income or greater income than in his or her original settlement with the hope of improving the living standard (Minjale 2014). Also, people migrate out of conflict affected areas to urban areas in order to guarantee subsistence livelihoods and to live safely. As such, rural-urban migration is one of the most common demographic trends in the world (Grau & Aide 2007) especially in developing countries.
In line with historical trends, rural-to-urban migration in African countries account for the single most significant cause of the rapid growth of the urban population (Hoves et al. 2013; Waddington & Sabates-Wheeler 2003; Lall et al. 2006). Migrating out of rural communities on average contribute to about 60 per cent of the urban population and in some uncommon cases, contribute as much as 75 percent (Todaro 2000, cited in Hoves et al. 2013; Byerlee 1974). The least developed in the world and yet the fastest urbanizing part of the world (Africa), approximately one third (32 percent) of its population live in cities where the major economic activities involving industry, manufacturing, commerce and employment are present, such as Accra (Ghana), Lagos (Nigeria), Monrovia (Liberia), Nairobi (Kenya) etc. (Nsiah-Gyabaah 2003). As a result, Ghana has encountered a sharp rise in urban growth dating back to the middle of the twentieth century. For example, the share of the country’s population living in urban settlements has appreciated rapidly over the years as it rose from 9% in 1931 to 31.3% in 1984 and 43.8% in 2000 (Yankson & Betrand 2012).
The movement of rural people out of rural areas in order to find jobs in urban centres is important for the development process particularly in growing market economies (Amare et al. 2012). However, the excessive rate of rural urban migration is one of the major factors accounting for the development and expansion of squatter settlements and slums globally (Wondimagegnhu 2012; UN-Habitat 2008, cited in Tindigarukayo 2014). In effect, the presence of the low-income settlements in and around urban centres’ which often lack basic services is taken to indicate that the rate of rural to urban migration is high (McGranahan & Tacoli 2006). Then again, the undue rate of rural urban migration and the insignificant proportion of employment in industries explain the reason for an increasing urbanization resulting in a metamorphosis from unemployment in rural areas to increasing joblessness and underemployment in urban areas (Miheretu 2011; Wondimagegnhu 2012), though the urban informal economy is not often accounted for. In view of that, making the issue of unemployment an outcome of
rural urban migration in urban areas is debatable. The limited job opportunities coupled with the lack of requisite competences to qualify rural migrants’ to find regular remunerated and secured employment in the official sector results in the majority of them participating in the informal sector which is the only option available to settle in for work (Mcatty 2004; Bhowmik 2005; Misra & Alam 2014) because of the ease of entry and unregulated nature where a migrant does not need any permission from any city official or entry certificate before involving himself or herself in the sector.
Upon the examination of literature on urban economic development it is noted that it usually does not define the term economic development directly (Wolman & Spitzley 1996; Xie & Stough 2002; Todaro & Smith 2012); rather it encompasses a wide variety of endeavours and policies that sometimes appear to have little links to each other (Wolman & Spitzley 1996). Such pursuits can include varied areas such as development of human capital, social inclusion, health, security, literacy, and other initiatives. In spite of the wide scope of economic development, Sen (1999) defined economic development to be the deepening of substantive freedoms and independence, which permit persons to partake totally in economic life and also, improve the individual well-being. Further, according to Todaro & Smith (2012), economic development is concerned with human beings and the social systems by which they organize their activities to satisfy basic material needs (e.g., shelter, clothing) and nonmaterial wants (e.g., education, knowledge). The point is that there is no particular and specific definition of economic development. But for this study, economic development occurs when individuals improve their social and economic well-being as well as reduce their poverty level.
1.1 Problem statement
In many cities, migrants’ form a large proportion of the urban poor with whom they share income and non-income disadvantages, including difficulties in finding adequate housing and in accessing services (Tacoli et al. 2015). According to a United Nation’s report (2011), many developing countries and their policies have a negative view on rural-urban migration because it is perceived that poverty pushes the poor people to migrate, and that this type migration in turn generates higher pressure on the cities which in the end causes increased poverty in equally rural and non-rural areas (Ibid). In response, many countries have tried to curb rural-urban migration directly; whiles many urban centres and even neighbourhoods have taken indirect measures to discourage migrants’ from settling (McGranahan & Tacoli 2006; Lall et al. 2006; Grau & Aide 2007; Isaac & Raqib 2013).For example in Ghana, after the June 3 disaster which occurred in Accra1, rural migrants’ were immediately recognized as the main cause
of the disaster which eventually saw the Accra Metropolitan Assembly demolishing residents of some rural migrants’ residing in the city whiles the government also provided means and resources for the repatriation of some the rural migrants’ in the capital city to their areas of origin.
On the contrary, despite the challenges of rural migrants’, it is revealed in many studies across the world that the decision to migrate from rural to urban centres often results in improved conditions for migrants, and surveys conducted around the world reveal that majority of migrants have not regretted their decision to migrate (Grau & Aide 2007) which means they are able to find something (work) doing to earn a living which would eventually have an impact on them (migrants’) and the economy of the areas they find themselves. For instance, while De Haan et al. (2002) found that migrants from Mali rural villages have benefited from migration as a result of migrant networks, other studies in Egypt and Ghana showed that migration facilitated the poor groups of the population to move out of poverty (Sabates-Wheeler et al. 2005). Nonetheless, the important comparison according to Grau & Aide (2007) is the one made by migrants’ themselves; between their living conditions and opportunities in their previous rural setting and that of their new urban setting. This study therefore sought to find out the contribution of rural urban migration to the migrants’ economic development from the migrants’.
2. Methodology
In this research study, data was obtained from two main sources, namely the secondary and the primary sources. Primary data was obtained from rural migrants’ in the Tamale Metropolis specifically in the case study areas of Aboabo, Sabonjida, Tishegu and Moshi Zongo through direct interviews using a semi structured questionnaire. Also, direct observation skills were used to identify the type of houses migrants’ lived in. These study areas were selected based on John F.C Turner’s (1968) work on the trajectory of urban migrants’ which stated that rural migrants’ would always find themselves in the city centre in order to increase job opportunities (p, 354-363). The survey approach for data collection was used to elicit the required responses from migrants’/household. The snow ball sampling technique was applied to sample the right units for the study. The sample size for the study was 30 household each from all the four case areas because, that according to Trochim (2006) cited in (Minjale 2014) is the recommended minimum sample size for a quantitative research. The data obtained from the study was processed and analysed by the use of the statistical package for social scientist (SPSS). Both descriptive and
1 The June 3 disaster is a flood that occurred in Accra the capital city of Ghana in 2015, which took the lives of over 200 people. The disaster is called the June 3 disaster because the sad event occurred on the 3rd of June.
inferential statistical analyses were used to analyse the data. The descriptive analyses were presented as frequency distributions and percentages in the form of tables whiles the inferential analyses employed were the Chi Square and One-way ANOVA. The Chi Square was used to test the difference/relations between migrants’ and the indicators identified as constituting social and economic statuses and poverty levels of migrants’, while the ANOVA was used to test the income as well as saving variations amongst the rural migrants’.
3. Profile of study area
Tamale is among the 26 districts found in the Northern Region of Ghana. It is situated in the central part of the Region and shares boundaries with the Sagnarigu District to the North-West, Mion District to the East, East Gonja to the South and Central Gonja to the South West. Geographically, the Metropolitan area falls within longitudes 0º 36 and 0º 57 west and latitude 9º16 and 9º 34 north.
4. Results and discussions
4.1 Social and economic status of migrants’ in destination area
The assessment of the Social, Economic and poverty status of migrants’ are separated and discussed below to ascertain how migration has contributed to their (migrants’) wellbeing. The discussions however, are done comparing the migrants’ days of stay in their rural areas and that of their current stay, now urban Tamale. 4.2 Social status of migrants’
According to Charakborty (2014), availability of basic amenities is the criterion on the basis of which one can determine the standard of living of migrants’ in urban areas. Four variables were therefore employed to assess the social status of the migrants’. They are the housing type, water facilities, sanitation facilities and social inclusion or capital (event participation).
4.2.1 Types of Housing Migrants’ live in before and after Migration
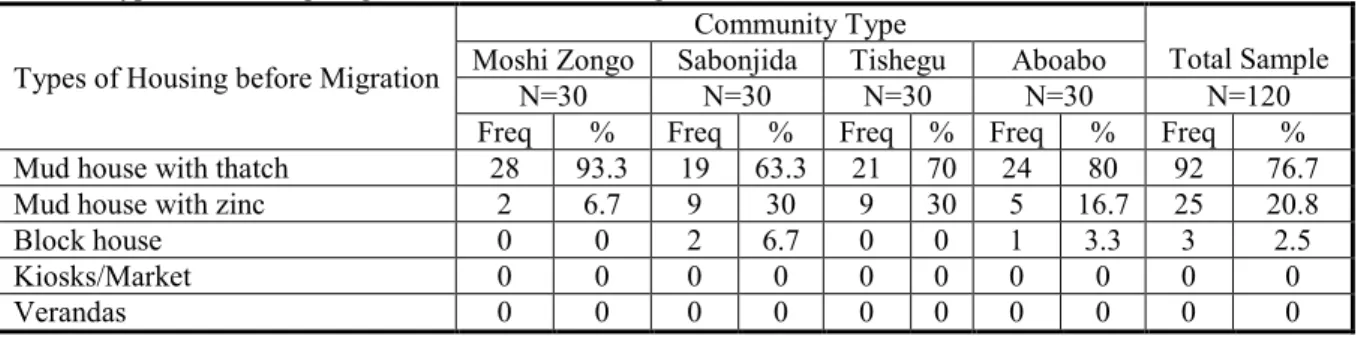
According to Islam (2007) cited in Chowdhury et al. (2012), the “types of housing essentially show the social status of a family” (p.77). In this study, the housing statuses of migrants’ were assessed by using the physical structure or materials that made up the houses where in the migrants’ lived to assess their social status because, the physical quality of housing have been used in many studies to assess socio-economic status of households according to Ghana Statistical Service 2000, 2007; Mberu 2005; Codjoe 2006; Doocy & Burnham 2006; Collinson et al. 2009; Pinnawala 2009 cited in Tanle (2014). The following therefore constituted the housing type for the study, Mud house with thatch, Mud house with zinc, Block house, Kiosks/Market and Verandas. Table 1 below shows the results obtained from the field.
Table 1: Types of Housing Migrants’ live in before Migration Types of Housing before Migration
Community Type
Total Sample
Moshi Zongo Sabonjida Tishegu Aboabo
N=30 N=30 N=30 N=30 N=120
Freq % Freq % Freq % Freq % Freq %
Mud house with thatch 28 93.3 19 63.3 21 70 24 80 92 76.7
Mud house with zinc 2 6.7 9 30 9 30 5 16.7 25 20.8
Block house 0 0 2 6.7 0 0 1 3.3 3 2.5
Kiosks/Market 0 0 0 0 0 0 0 0 0 0
Verandas 0 0 0 0 0 0 0 0 0 0
Chi- square test: p-value= 0.082 (significant at 10%) Source: Fieldwork, 2016.
Table 1 and 2 reveal that the houses of migrants’ were of five types, mud house with thatch, mud house with zinc, block house, kiosk and verandas. In Table 1, the dominant type of housing migrants’ lived in before migration was mud house with thatch making up a percentage of 76.7%, while only 2.5% lived in Block houses. Migrants’, however from the study did not live in Kiosk/market or verandas in their rural origins. A Chi-square test revealed that there was significant difference between the migrants’ and housing type in the various communities with a (Chi-square value of 0.082, significant at 10%) before they migrated. From Table 2, the housing status of migrants’ has however improved considerably. For instance, the number of migrants’ who lived in mud house with zinc increased to 75.8% from 20.8 % after migration and also, mud house with thatch decreased to 3.3% from 76.7%.
Table 2: Types of Housing Migrants’ live in After Migration
Types of Housing after Migration
Community Type
Total Sample Moshi Zongo Sabonjida Tishegu Aboabo
N=30 N=30 N=30 N=30 N=120 Freq % Freq % Freq % Freq % Freq % Mud house with thatch 0 0 2 6.7 1 3.3 1 3 4 3.3 Mud house with zinc 23 76.7 19 63.3 27 90 22 73.3 91 75.8 Block house 4 13.3 4 13.3 1 3.3 1 3.3 10 8.3 Kiosk/Market 0 0 0 0 0 0 2 6.7 2 1.7 Verandas 3 10 3 10 1 3.3 6 20 13 10.8
Chi- square test: p-value= 0.151 (not significant at 10%) Source: Fieldwork, 2016
However, it is important to note that even though there has been a general improvement in the housing status of migrants’, it could not be said for all. Unlike their rural origins where no one slept in a kiosk/market or verandas, some rural migrants’ had to sleep in them to serve as places of residence for them in the urban destination. The Chi-square test reveals that there is no significant difference between migrants’ and housing types of migrants’ in the various communities with a Chi-square value of 0.151 (not significant at 10%).
4.2.2 Water facilities before and after migration
Water is a vital element for people’s welfare (Ghana Statistical Service 2014; Chowdhury et al. 2012; Chaplin 2001) and its accessibility means a lot to the human society (Ghana Statistical Service 2014). The water facilities used in this study include Pipe borne, Bore hole, Wells and Ponds/Dams.
Before migration, the study found that 3.3% respondents had access to pipe borne water for their daily usage whiles 46.7% respondents sourced their water from wells (see Table 3 below) which is contrary to findings by the Ghana Statistical Service in its 2014 Ghana Living Standard Survey six (6) which revealed that (borehole, pump or tube well) are major suppliers of drinking water for majority of rural households in the rainy and dry seasons, serving 51.6 and 45.3% of the rural homes in Ghana respectively. The findings in this study further revealed that some of these facilities were available in the rural areas but did not necessarily serve as their principal supplier of water, for various reasons including the proximity of these facilities to rural folks, the taste of the water, the type of water etc. It is revealed in the study that there was a significant difference between migrants’ and the source of water in the various communities studied before migration with a (Chi-square, p-value of 0.001, significant at 1%). Table 3: Migrants’ sources of water before migration
Sources of water before Migration
Community Type
Total Sample Moshi Zongo Sabonjida Tishegu Aboabo
N=30 N=30 N=30 N=30 N=120 Freq % Freq % Freq % Freq % Freq % Pipe borne 0 0 2 6.7 0 0 2 6.7 4 3.3 Bore hole 6 20 9 30 8 26.7 4 13.3 27 22.5 Wells 22 73.3 7 23.3 17 56.7 10 33 56 46.7 Ponds/Dams 2 6.7 12 40 5 16.7 14 46.7 33 27.5
Chi- square test: p-value= 0.001 (significant at 1%) Source: Fieldwork, 2016
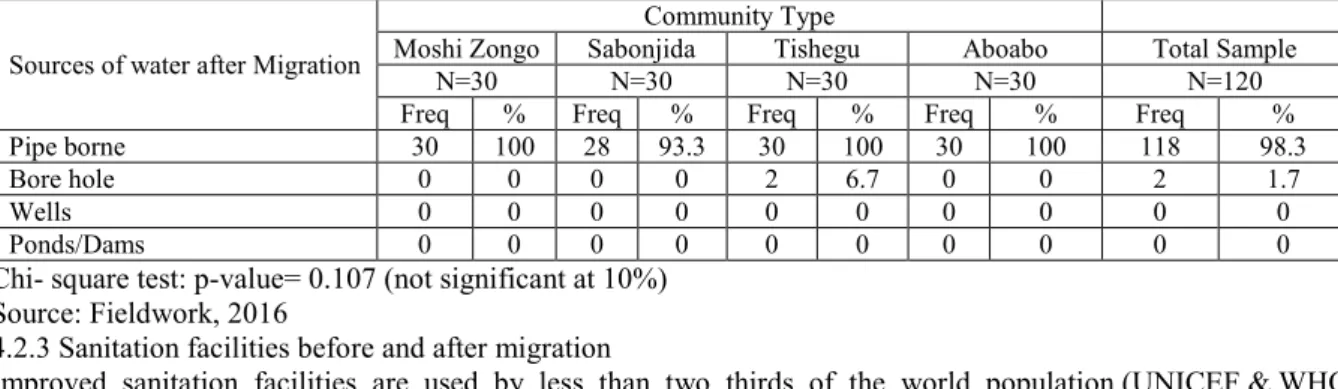
However, the accessibility to water source after migration changed significantly as majority of the migrants’ used pipe borne water more than any other source (see Table 4 below) because, typically urban settlements have greatly more services at their disposal as compared to rural areas (Ghana Statistical Service 2014) including water for which purpose can even influence rural people to migrate. Unlike before, there is no significant difference between migrants’ and sources of water in the various communities with Chi- square test results indicating a (Chi- square, p-value of 0.107, not significant at 10%)
Table 4: Migrants’ sources of water after migration
Sources of water after Migration
Community Type
Moshi Zongo Sabonjida Tishegu Aboabo Total Sample N=30 N=30 N=30 N=30 N=120 Freq % Freq % Freq % Freq % Freq % Pipe borne 30 100 28 93.3 30 100 30 100 118 98.3 Bore hole 0 0 0 0 2 6.7 0 0 2 1.7
Wells 0 0 0 0 0 0 0 0 0 0
Ponds/Dams 0 0 0 0 0 0 0 0 0 0
Chi- square test: p-value= 0.107 (not significant at 10%) Source: Fieldwork, 2016
4.2.3 Sanitation facilities before and after migration
2008). Therefore according to Chowdhury et al. (2012), the “level of sanitation amenities decides the social status of a family” (P, 130). In effect, the ability to access improved sanitation facilities would mean a step forward in improving the social status of an individual if the finding by UNICEF & WHO (2008) is anything to go by1. KVIP,
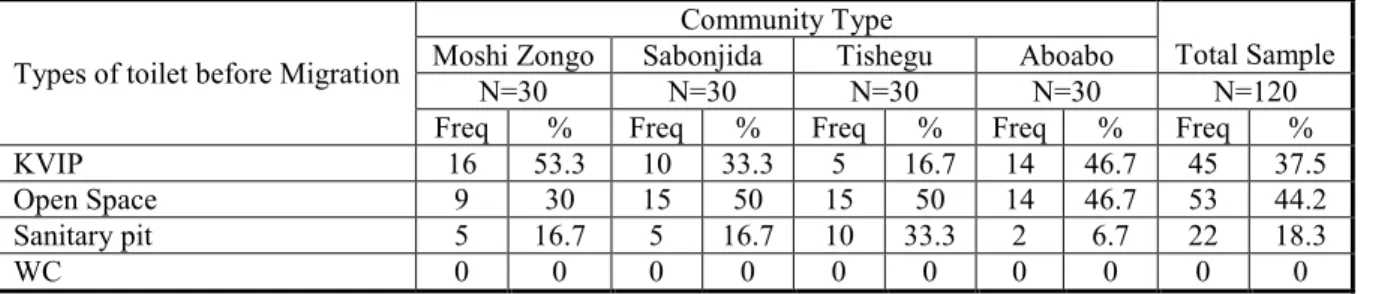
Open Space, Sanitary Pit and Water Closet (W. C) were used to represent the types of sanitation facilities in this study. From Table 5 below, the results showed that before migration, about 37.5% of respondents used KVIP, whiles the highest percentage of 44.2% of respondents responded to natures call in the open space confirming the initial baseline report by SUSA in 2011 as cited in Agyekum (2015). The high patronage of the open space by the rural folks was location driven since many rural areas and homes are closer to bushy environment coupled with the scattered nature of settlement in rural settlements of the country, similar to the findings in (Ibid). Furthermore, the study revealed that the use of the open space was not as a result of lack of facilities notably the KVIP but rather the inability to maintain the facilities, the cost involved in patronising the facility and the comfortability of the facility to the user. This can be related to the finding by (G.D.P. 2012) that people reject sanitation solutions offered by governments, donors, and NGOs when they are too expensive, unpleasant to use, or difficult to maintain. The study revealed that there was significant difference between migrants’ and sanitation facilities accessed before migration with a Chi- square test: p-value= 0.028 (significant at 5%).
Table 5: Sanitation facilities before migration
Types of toilet before Migration
Community Type
Total Sample
Moshi Zongo Sabonjida Tishegu Aboabo
N=30 N=30 N=30 N=30 N=120
Freq % Freq % Freq % Freq % Freq %
KVIP 16 53.3 10 33.3 5 16.7 14 46.7 45 37.5
Open Space 9 30 15 50 15 50 14 46.7 53 44.2
Sanitary pit 5 16.7 5 16.7 10 33.3 2 6.7 22 18.3
WC 0 0 0 0 0 0 0 0 0 0
Chi- square test: p-value= 0.028 (significant at 5%) Source: Fieldwork, 2016
However, after migration, the KVIP served as the only source of convenience for migrants’ as revealed in Table 6 below, indicating an improvement in migrants’ use of sanitation facilities compared to the majority who used to visit the bushes (open space) as shown in Table 5 above. This finding to some extent conforms to reports by (UNICEF & WHO 2008) that as at the year 2004, access to improved sanitation was two times more high in urban areas than in rural areas. So, considering the rate at which rural migrants’ migrate to urban areas, there is no doubt that they could be a contributory factor to the increase in access of improved sanitation in the country, though no migrant was found using W.C which is a much more improved facility than the KVIP. The findings of this study therefore imply that for the country to achieve the Millennium Development Goal Target of improved sanitation, enough attention should be given rural areas.
Table 6: Sanitation facilities after migration Types of toilet after Migration
Community Type
Total Sample
Moshi Zongo Sabonjida Tishegu Aboabo
N=30 N=30 N=30 N=30 N=120
Freq % Freq % Freq % Freq % Freq %
KVIP 30 100 30 100 30 100 30 100 30 100
Source: Fieldwork, 2016
4.2.4Social Capital of Migrants’ before and after Migration
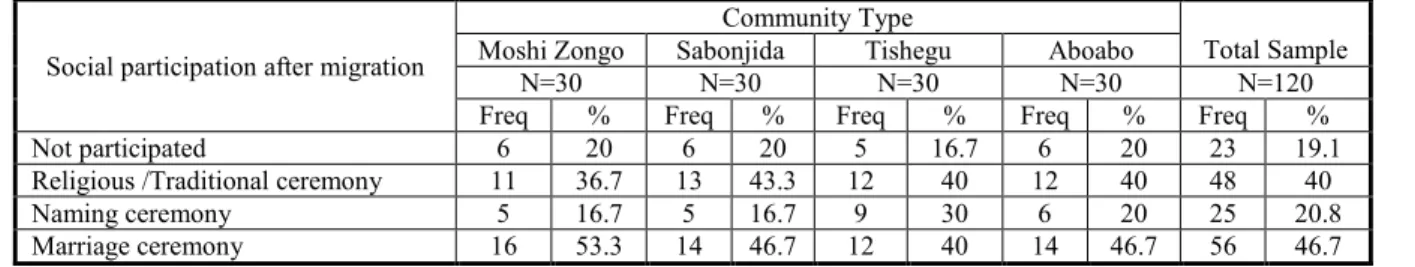
Social capital is a relationship grounded on mutuality and trust hence gives more consideration to kinship, family networks and close friends that the household will rely on when there is an emergency (DFID 1999). So, because social capital is a conjoint relationship among and within communities and households, in this study, social event participation like attending religious/traditional ceremonies; naming ceremonies and Marriage ceremonies were selected to represent social capital. The Tables 7 and 8 below show the results on migrants’ social capital before and after migration.
Table 7: Social capital of migrants’ before migration Events participated before
migration
Community Type
Total Sample Moshi
Zongo Sabonjida Tishegu Aboabo
N=30 N=30 N=30 N=30 N=120
Freq % Freq % Freq % Freq % Freq %
Not participated 0 0 0 9 0 0 0 0 9 7.5
Religious/Traditional ceremony 25 83.3 22 73.3 21 70 21 70 89 74.1
Naming ceremony 3 10 7 23.3 9 30 9 30 28 23.3
Marriage ceremony 8 26.7 6 20 5 16.7 6 20 26 21.7
Chi- square test: p-value= 0.438 (not significant at 10%) Source: Fieldwork, 2016 *Multiple responses possible
In this part of the country (The northern region), people are being recognized in the society through invitations and subsequent participation in social events. As such according to Chowdhury et al. (2012), social capital ultimately indicates social status. Therefore the more one participates in an event; the more he or she is being mentioned in the good books of society members which come with respect. Also the more the bond of relations and network, the stronger the social capital implying that the sense of belongingness among people is key in determining the social status of an individual or household.
Table 8: Social capital of migrant respondents after migration
Social participation after migration
Community Type
Total Sample Moshi Zongo Sabonjida Tishegu Aboabo
N=30 N=30 N=30 N=30 N=120 Freq % Freq % Freq % Freq % Freq % Not participated 6 20 6 20 5 16.7 6 20 23 19.1 Religious /Traditional ceremony 11 36.7 13 43.3 12 40 12 40 48 40 Naming ceremony 5 16.7 5 16.7 9 30 6 20 25 20.8 Marriage ceremony 16 53.3 14 46.7 12 40 14 46.7 56 46.7
Chi- square test: p-value= 0.936 (not significant at 10%) Source: Fieldwork, 2016. *Multiple responses possible
From the Tables (7 and 8) above, 7.5% of respondents did not participate in any social event before migration and after migration the percentage increased to 19.1%. Also, 74.1% of migrants’ before migration attended religious/traditional ceremonies and after migration the number reduced to 40%, and so did the participation of migrants’ in naming ceremony decrease from 23.3% before migration to 20.8% after migration. The results in (Tables 7 and 8) above therefore strengthens that social capital performs poorly in urban settlement than in the rural settlements as was also found by Timasilna (2007). The Chi-square test revealed no significant relationship between migrants’ and social capital both before and after migration with (P-values=0.438; 0.936 not significant at 10%) respectively. Considering therefore the participation of migrants’ in the social events above, social capital was found to be poor after migration, that is in urban areas.
Table 9: Social status index of migrants’ Social Status
Community Type
Total Sample
Moshi Zongo Sabonjida Tishegu Aboabo
N=30 N=30 N=30 N=30 N=120
Weight (wi) Freq % Freq % Freq % Freq % Freq %
Remained the same 0 6 20 3 10 2 6.7 3 10 14 11.7
Slightly improved 1 10 33.3 12 40 6 20 12 40 40 33.3
Improved 2 5 16.7 13 43.3 18 60 6 20 42 35
Highly improved 3 9 30 2 6.7 4 13.3 9 30 24 20
Source: Fieldwork, 2016.
Generally, migrants’ assessment of social status after moving to Tamale is revealed in Table 9 above. The outcome from Table 9 above thus shows that regardless of the community of residence of migrants’ and other differences such as sex, marital status etc., largely (54.4%) of the total migrant population studied assessed their social status to have improved after migrating to Tamale. This implies that migration has a positive effect on migrants’ social status. The social status index is expressed below
Social Status index (SSI) = ∑ *100
( 0 ∗ 14) + (1 ∗ 40) + (2 ∗ 42) + (3 ∗ 24) 120 ∗ 3
= = 54.4%. 4.3 Economic status of migrants’
The “Economic status index is a contemporary method used to interpret qualitative change in quantitative terms” (Islam et al. 2008. p, 420). An overall change of five economic indicators are used to calculate the economic status index of migrants’. They include income/expenditure, savings; migrants’ assets owned and land ownership (Ibid)1.
Then again, according to Ghana Living Standard Survey six (6), human capital development (education and health) is also an important indicator of economic status, hence was included among the indicators in the study. So in all four economic indicators were used to calculate the economic status index in the study. They are income, Savings, Education and Health (human capital development).
4.3.1 Income of migrants’
According to Chowdhury et al. (2012. p, 128), “Income is a principal variable to uncover the economic status of a migrant”. Following the study therefore, the monthly incomes of migrants’ were assessed and the results are shown in Tables 10 and 11 below. But before the results in Tables 10 and 11 below, the study revealed that out of a total population of one hundred and twenty (120) studied, only a total of thirty four (34) of the migrants’ representing 28.3% in all the four case areas earned income while they were in their rural areas. However, only twelve (12) out of the 34 migrants’ were able to estimate they earned a monthly income of </=200 Ghana Cedis. While the remaining 22 out of the 34 migrants’ who also earned income before migration were not able to estimate how much income they earned because, the study revealed that the 22 migrants’ were subsistent farmers who did not really sell their produce unless there was an urgent need.
However, after migration, the income earning status of migrants’ changed. While the Table 10 below measures migrants’ income distribution on monthly basis after migration, Table 11 presents the same information using mean index of migrants’ monthly income.
Table 10: Monthly income distribution of migrants’ after migration
Monthly Income
Community Type
Total Sample
Moshi Zongo Sabonjida Tishegu Aboabo
N=30 N=30 N=30 N=30 N=120
Freq % Freq % Freq % Freq % Freq %
</=200 7 23.3 9 30 3 10 12 40 31 25.8
201-850 9 30 6 20 10 33.3 6 20 31 25.8
851-1717 7 23.3 10 33.3 9 30 2 6.7 28 23.3
1718+ 7 23.3 5 16.7 8 26.7 10 33.3 30 25
Chi- square test: p-value= 0.111 (not significant at 10%) Source: Fieldwork, 2016.
Table 11: The max, min and average index of migrants’ monthly income
Community Type N Minimum Maximum Mean
Moshi Zongo 30 150 3500 1145.4
Sabonjida 30 0 2550 974.53
Tishegu 30 0 3428 1241.3
Aboabo 30 0 2690 1031.6
Total Sample 120 0 3500 1098.2
One-way ANOVA Test: p-value= 0.700 (not significant at 5%) Source: Fieldwork, 2016.
From Table 10 above, the distribution of the respondents by monthly income shows that 25.8% of the respondents earned below or equal to Gh200 monthly, whiles 25.0% respondents earned above Gh cedis 1, 717 in a month. From Table 11 also, it was revealed that the average income that migrants’ earned in each of the four communities studied did not vary significantly and the results are as follows, Moshi Zongo (1145.4 cedis), Sabonjida (974.53 cedis), Tishegu (1241.3 cedis) and Aboabo (1031.6 cedis).
In the study, two tests (Chi-square and One way ANOVA) were used to find out the difference or variation between migrants’ and income/average income earned in the various communities. However, both test revealed that there was no significant difference or variation between the migrants’ and the income/average income earned in all the communities. While the Chi-square test value was, p-value= 0.111 (not significant at 10%), the One-way ANOVA Test value was = 0.700 (not significant at 5%).
1 For the purpose of this study however, land possession and assets of migrants’ were combined together as (assets owned) and
4.3.2 Savings of migrants’
Fisher & Weber (2004) have reasoned that savings offer economic strength to poor households, considering that savings presents an opportunity to migrants or household to withstand circumstances of income deficits. Therefore, the ability of a person to save indicates one’s preparedness for any future circumstance and further demonstrates that one is economically doing well to some extent, since a poor person has no or little amount of money to save. Below were the responses of migrants’ regarding their saving status, and the amount they saved on monthly basis after migration.
Table 12: Savings status of migrants’
Migrants’ Saving Status
Community Type
Total Sample
Moshi Zongo Sabonjida Tishegu Aboabo
N=30 N=30 N=30 N=30 N=120
Freq % Freq % Freq % Freq % Freq %
Yes 27 90 25 83.3 25 83.3 25 83.3 102 85
No 3 10 5 16.7 5 16.7 5 16.7 18 15
Chi- square test: p-value= 0.853 (not significant at 10%) Source: Fieldwork, 2016.
The study revealed that (see Table 12 above), 85% of respondents in all the four case communities had savings whiles only a few of them (15%) did not save. Furthermore, it was revealed that the culture of savings to a very large extent helped them because, the proceeds of the savings were used to cater for their children’s school fees and other unforeseen situations confirming (Awumbila et al. 2014) who found that household savings can serve as likely capital spending in the education of children. The Chi-square test, with p-value= 0.853 indicates that there was no significant difference between migrants’ and saving status in all the communities (insignificant at 10%).
Table 13: Migrants’ monthly savings distribution
Monthly Savings
Community Type
Total Sample
Moshi Zongo Sabonjida Tishegu Aboabo
N=30 N=30 N=30 N=30 N=120
Freq % Freq % Freq % Freq % Freq %
</=30 10 33.3 12 40 6 20 11 36.7 39 32.5
31-60 10 33.3 7 23.3 7 23.3 8 26.7 32 26.7
61-150 7 23.3 5 16.7 10 33.3 8 26.7 30 25
151+ 3 10 6 20 7 23.3 3 10 19 15.8
Chi- square test: p-value= 0.606 (not significant at 10%) Source: Fieldwork, 2016.
Table 14: The max, min and average index of migrants’ monthly savings
Community Type N Minimum Maximum Mean
Moshi Zongo 30 0 300 75.2
Sabonjida 30 0 500 93.87
Tishegu 30 0 300 103
Aboabo 30 0 1000 105.5
Total Sample 120 0 1000 94.39
One-way ANOVA Test: p-value= 0.778 (not significant at 10%) Source: Fieldwork, 2016
The results of the monthly savings of migrants’ are shown in Tables 13 and 14 above. Whiles Table 13 measures migrants’ saving distribution monthly, Table 14 presents the same information using mean index of migrants’ monthly savings. From Table 13, the results indicate that 32.5% of the total migrant population saved either less than or equal to Gh cedis 30 in a month whiles 15.8% of respondents saved above Gh cedis 151 a month as of the time of the study. On average per each community in a month, Table 14 shows that in Moshi Zongo, migrants’ saved Gh75 cedis 20 pesewas and in Sabonjida the average amount migrants’ saved in a month was Gh93 cedis 87 pesewas. In the remaining communities, Tishegu and Aboabo, migrants’ average monthly savings were Gh103 cedis and Gh105 cedis, 50 pesewas respectively. Two tests (Chi-square and One way ANOVA) were used to find out the difference/variation between migrants’ and the total amount/average amount saved each month in the various communities. The results however indicate that whiles the Chi-square test value was, p-value= 0.606 (not significant at 10%), the One-way ANOVA Test p-value was = 0.778 (not significant at 10%).
4.3.3 Human asset development
Along with access to facilities as was presented in the social status indicators above, “education and health are also considered “basic needs” and should be seen as complementary to the consumption-based welfare indicator”
(Ghana Statistical Service 2014. p, 34). A developed human refers to the “labour available to the household: its education, skills, and health” (Carney 1998 cited in Ellis 2000:33-34 cited in Timasilna 2007, p,30)1.
4.3.3.1 Education, apprenticeship and experience
Human asset is improved by capital spending in training and education (Ellis 2000:33 cited in Timasilna 2007), as well as by the experience gained via practicing various careers. Hence, supplementary means of developing the human asset were considered together with education, including apprenticeship and experience which have the potential of adding value to the individual (Human asset) in order to improve production or earnings. Nonetheless, firstly the researchers sought to find out whether or not migrants’ have developed themselves or not after migration and the results are as below:
Table 15: Status of human asset development (education, apprenticeship and experience) of migrants’
Development of human asset Community Type
Moshi Zongo Sabonjida Tishegu Aboabo Total Sample
N=30 N=30 N=30 N=30 N=120
Freq % Freq % Freq % Freq % Freq %
Yes 22 73.3 26 86.7 24 80 17 56.7 89 74.2
No 8 26.7 4 13.3 6 20 13 43.3 31 25.8
Chi- square test: p-value= 0.051 (significant at 10%) Source: Fieldwork, 2016
As illustrated in the Table 15 above, majority (74.2%) of migrants’ responded they developed their human asset, with just 25.8% responding otherwise. The Chi-square test, with p-value=0.051, indicates a significant difference between migrants’ and the status of human asset development in all four communities (significant at 10%). Below are some views of migrants’ who responded otherwise. In the case of respondent ID16, a smock weaver from Daboya, he said:
The market base in Tamale brought me here. As for the work I knew it already and my uncle knows that when it comes to smock weaving, I have been in it since childhood, so what is it that am going to learn again?
Also, some said per the work they did, they could not add value to themselves. For instance in the case of respondent ID 25, a 56 years old watchman from Diyali, he said:
Apart from the pay I get, there is nothing to learn or improve my life. In my case if I go to sit at my work side in the morning, if not 5 o’clock pm I have nowhere to go. So tell me, how am going to add some value to my live?
Others felt that they had not really kept long in Tamale and as such, did not add any value to their lives. In addition, others mentioned age, lack of opportunity and resources among others as the reasons for their inability to develop themselves. Below is Table 16 revealing the means through which migrants’ developed their human asset:
Table 16: Means of human asset development of migrants’
Means of Human Asset Development
Community Type
Total Sample Moshi Zongo Sabonjida Tishegu Aboabo
N=30 N=30 N=30 N=30 N=30 Freq % Freq % Freq % Freq % Freq % Education 2 6.7 5 16.7 4 13.3 5 16.7 16 13.3 Skills acquisition(apprenticeship) 11 36.7 10 33.3 9 30 4 13.3 34 28.3 Experience 9 30 11 36.7 11 36.7 8 26.7 39 32.5
Chi- square test: p-value= 0.251 (not significant at 10%) Source: Fieldwork, 2016
Considering the means through which migrants’ developed themselves, the Table 16 above reveals the results as follows: a fair majority of the migrants’ (32.5%) were of the view that they had gained enough experience from the work they did after migrating to Tamale. Also, 28.3% had their human asset developed through skills acquisition or apprenticeship with 13.3% of migrants’ responding that through education they had developed their human asset. There was no significant difference between migrants’ and the means of human asset development in the case communities with Chi- square test indicating a p-value= 0.251 (insignificant at 10%).
4.3.3.2 Health facilities before and after migration
According to Ghana Statistical Service (2014 p, 34), “the health status of an individual is a convincing contributing factor of quality of life, level of longevity and productivity” for any productive society. As such in trying to measure the economic status of rural migrants’, the health facilities at the disposal of migrants’ were employed as
1 In this study however, education was not isolated as a primary means to develop human, there were other means through
which an individual could develop himself or herself example, apprenticeship and experience. As a result these two forms or means of training (apprenticeship and experience) were combined together with education and studied as complements.
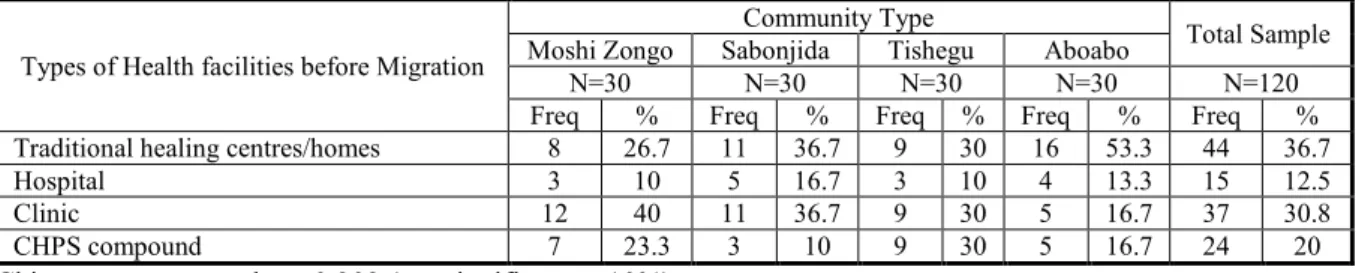
indicators. In this study, the types of health facilities taken into consideration were traditional healing centres or homes, hospitals, clinics and CHPS compounds. Below in Tables 17 and 18 were the results gathered.
Table17: Health facilities before migration
Types of Health facilities before Migration
Community Type
Total Sample Moshi Zongo Sabonjida Tishegu Aboabo
N=30 N=30 N=30 N=30 N=120 Freq % Freq % Freq % Freq % Freq % Traditional healing centres/homes 8 26.7 11 36.7 9 30 16 53.3 44 36.7 Hospital 3 10 5 16.7 3 10 4 13.3 15 12.5 Clinic 12 40 11 36.7 9 30 5 16.7 37 30.8 CHPS compound 7 23.3 3 10 9 30 5 16.7 24 20
Chi- square test: p-value= 0.302 (not significant at 10%) Source: Fieldwork, 2016
Table 17 above shows the health facilities migrants’ used in their rural origin before migration. The results indicate that 36.7% of migrants’ resorted to traditional healers as their source of health care whiles 12.5% of respondents used the hospital. Of the migrants’, prior to their migration, the Chi-square test showing a p-value= 0.302 reveals that there was no significant difference between migrants’ and health facilities accessed in all the case communities (insignificant at 10%).
Table 18: Health facilities after migration
Types of Health facilities after Migration
Community Type
Total Sample Moshi Zongo Sabonjida Tishegu Aboabo
N=30 N=30 N=30 N=30 N=120 Freq % Freq % Freq % Freq % Freq % Hospital 29 96.7 30 100 30 100 29 96.7 118 98.3 CHPS compound 1 3.3 0 0 0 0 1 3.3 2 1.7 Tradition healing centres/homes 0 0 0 0 0 0 0 0 0 0 Clinics 0 0 0 0 0 0 0 0 0 0
Chi- square test: p-value= 0.565 (not significant at 10%) Source: Fieldwork, 2016
After migration as shown in Table 18 above, majority (98.3%) of the respondents used the hospital facility as their primary source of health care, while a hand full of the respondents comprising only 1.7% used the CHPS facility after migration. The results from Table 18 imply that there has been an improvement in the health facilities assessed by migrants’ after migration. The Chi-square test reveals a p-value= 0.853 signifying that there was no significant difference between migrants’ and the health facilities accessed after migration in all the case communities (insignificant at 10%).
Table 19: Economic status index of migrants’
Economic Status Weight (wi) Community Type Total Sample
Moshi Zongo Sabonjida Tishegu Aboabo
N=30 N=30 N=30 N=30 N=120
Freq % Freq % Freq % Freq % Freq %
Remained the same 0 1 3.3 2 6.7 3 10 3 10 9 7.5
Slightly improved 1 3 10 3 10 2 6.7 8 26.7 16 13.3
Improved 2 21 70 21 70 16 53.3 11 36.7 69 57.5
Highly improved 3 5 16.7 4 13.3 9 30 8 26.7 26 21.7
Source: Fieldwork, 2016
Economic Status Index (ESI) = *100
( ∗ ) ( ∗ ) ( ∗ ) ( ∗ ) ∗
=
= = 64.4%
The assessment of the economic status of migrants’ after migrating to Tamale is revealed in Table 19 above. Of all the economic indicators assessed, the study revealed a general high percentage improvement in the economic status of migrants’ with a calculated and weighted economic status index value of 64.4%.
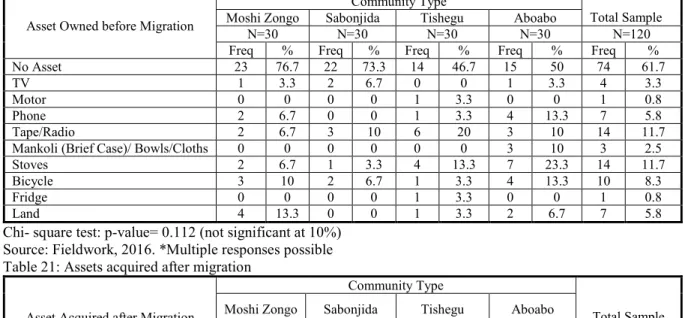
4.4 Assets possessed by migrants’ before and after migration
Increasing number of researchers and policymakers view assets as a vehicle for socioeconomic development (Nam et al. 2008). Thus assets possession serves as an indicator of transforming households’ standards of living (Ghana Statistical Service 2014). Below were the assets considered and the responses gathered in the study.
Table 20: Assets owned before migration
Asset Owned before Migration
Community Type
Total Sample Moshi Zongo Sabonjida Tishegu Aboabo
N=30 N=30 N=30 N=30 N=120 Freq % Freq % Freq % Freq % Freq % No Asset 23 76.7 22 73.3 14 46.7 15 50 74 61.7 TV 1 3.3 2 6.7 0 0 1 3.3 4 3.3 Motor 0 0 0 0 1 3.3 0 0 1 0.8 Phone 2 6.7 0 0 1 3.3 4 13.3 7 5.8 Tape/Radio 2 6.7 3 10 6 20 3 10 14 11.7 Mankoli (Brief Case)/ Bowls/Cloths 0 0 0 0 0 0 3 10 3 2.5 Stoves 2 6.7 1 3.3 4 13.3 7 23.3 14 11.7 Bicycle 3 10 2 6.7 1 3.3 4 13.3 10 8.3 Fridge 0 0 0 0 1 3.3 0 0 1 0.8 Land 4 13.3 0 0 1 3.3 2 6.7 7 5.8
Chi- square test: p-value= 0.112 (not significant at 10%) Source: Fieldwork, 2016. *Multiple responses possible Table 21: Assets acquired after migration
Asset Acquired after Migration
Community Type
Total Sample Moshi Zongo Sabonjida Tishegu Aboabo
N=30 N=30 N=30 N=30 N=120 Freq % Freq % Freq % Freq % Freq % No Asset 0 0 1 3.3 2 6.7 4 13.3 7 5.8 TV 7 23.3 4 13.3 8 26.7 5 16.7 24 20 Motor 4 13.3 6 20 5 16.7 4 13.3 19 15.8 Phone 12 40 11 36.7 4 13.3 10 33.3 37 30.8 Tape/Radio 1 3.3 3 10 1 3.3 2 6.7 7 5.8 Mankoli (Brief Case)/ Bowls/Cloths 3 10 3 10 1 3.3 4 13.3 11 9.2 Stoves 5 16.7 4 13.3 3 10 6 20 18 15 Bicycle 1 3.3 2 6.7 1 3.3 0 0 4 3.3 Fridge 0 0 0 0 1 3.3 1 3.3 2 1.7 Land 2 6.7 3 10 4 13.3 3 10 12 10
Chi- square test: p-value= 0.654 (not significant at 10%) Source: Fieldwork, 2016. *Multiple responses possible
The results from Tables 20 and 21 above indicate that apart from tape/radio and bicycles that migrants’ owned more with a percentage ownership of 11.7% and 8.3% respectively before migration, numerous of the migrants’ owned more assets in their destination settlements as compared to what they owned at their place of origin (see Tables 20 and 21) above. Notably from the study, the relative disparities regarding asset ownership before and after migration were connected to location based facilities and take-home pay factors confirming the findings of Awumbila et al. (2014) in their study. Example, electricity availability in the urban settlements than is available in rural settlements allows migrants’ in Tamale to possess more of electronic assets (see e.g. the % possession of TV, phones, fridge before and after migration by migrants’ in Table 20 and 21 above). However, contrary to the expectation by (ibid) that majority of households in rural areas (before migration) are expected to own more land because of the apparent need for land in a main agricultural based economy, compared to households in urban areas (after migration), the findings of this study shows otherwise. The reason for the disparity could be because, the study done by Awumbila et al. (2014) was limited to agricultural land unlike in this study, which did not specify the particular type of land that migrants’ owned.
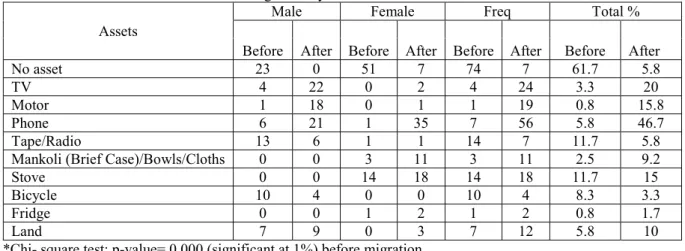
Further findings of assets ownership in the study established that the kind of assets migrants’ purchased were sex – influenced (see Table 22) below, confirming findings in a study conducted by Awumbila et al. (2014) that assets ownership by migrants’ are sex inclined.
Table 22: Assets owned before and after migration by sex
*Chi- square test: p-value= 0.000 (significant at 1%) before migration ** Chi- square test: p-value= 0.000 (significant at 1%) after migration Source: Field work, 2016. ***Multiple responses possible
From the Table 22 above, it was revealed that males owned more of the selected assets than females, both before and after migration with the exception of Stoves, the “mankoli”/bowls/Cloths and fridge where the females were found to own more than men. The Chi- square test between the assets owned and the sex of migrants’ revealed that there was a significant difference (significant at 1%) between the males and their female counterparts with a p-value= 0.000 both before migration and after migration (see Table 22) above.
5. Conclusion
Despite the negative perception about rural urban migration, it is found that through rural urban migration, migrants’ have being able to improve their social status by a calculated index of 54.4%. Also, respondents’ were assessed to have enhanced their economic status and the index value was calculated to be 64.4%. In addition it was found from the asset based approach of measuring poverty that the poverty level of migrants’ had improved after their migration since the number of migrants’ who had no asset before migration (61.7%) reduced to 5.8% after migration. The findings from the study therefore imply that rural urban migration contributes to the overall economic development of the country hence to achieve accelerated development rural people/areas should feature significantly in any development plan aimed at improving the living standard of citizens in the country at any level. References
Agyekum, E. O. (2015). Knowledge, Perception and Willingness to Pay for Faecal Waste Reuse in Agriculture by Farmers in the Ningo-Prampram and Shai-Osudoku Districts of Ghana. A Thesis Submitted to The Department of Agricultural Economics, Agribusiness & Extension, Kwame Nkrumah University of Science & Technology in partial Fulfillment of the Requirement for the Degree of Master of Philosophy in Agricultural Economics. Retrieved from ir.knust.edu.gh/bitstream/123456789/7510/1/ on 30th April, 2016
Amare, M., Hohfeld, L., Jitsuchon, S., & Waibel, H. (2012). Rural-urban migration and employment quality: A case study from Thailand. ADB Economics Working Paper Series No. 309. Retrieved from https://www.adb.org/sites/default/files/ publication/.../economics-wp-309.pdf 29th December, 2015
Awumbila, M., Owusu, G., & Teye, J. K. (2014). Can rural-urban migration into slums reduce poverty? Evidence
from Ghana. Migrating Out of Poverty Working Paper, 13, 1-41. Retrieved from
migratingoutofpoverty.dfid.gov.uk/ on 13th June, 2015
Bhowmik, S. K. (2005). Street vendors in Asia: a review. Economic and political weekly, 2256-2264. www.alnap.org/pool/files/bhowmik-street-vendors-in-asia.pdf on 30th December, 2014.
Byerlee, D. (1974). Rural-urban migration in Africa: Theory, policy and research implications. The International Migration Review, 8(4), 543-566.
Chakraborty, D. (2014). Migration and urban informal sector a study in west Bengal. Retrieved from Retrieved from shodhganga.inflibnet.ac.in/... on 5th August, 2015
Chaplin, M. F. (2001). Water: its importance to life. Biochemistry and Molecular Biology Education 29 (2001) 54-59
Chowdhury, I. A., Haque, N., Kamal, M. M., Islam, T., Khan, M. M., Islam, M. N., & Uddin, I. (2012). Internal migration and socio-economic status of migrants: a study in Sylhet City, Bangladesh. American Journal of Human Ecology, 1(4), 123-133.
De Haan, A. (1999). Livelihoods and poverty: The role of migration‐a critical review of the migration literature. The Journal of Development Studies, 36(2), 1-47.
Assets
Male Female Freq Total %
Before After Before After Before After Before After
No asset 23 0 51 7 74 7 61.7 5.8
TV 4 22 0 2 4 24 3.3 20
Motor 1 18 0 1 1 19 0.8 15.8
Phone 6 21 1 35 7 56 5.8 46.7
Tape/Radio 13 6 1 1 14 7 11.7 5.8
Mankoli (Brief Case)/Bowls/Cloths 0 0 3 11 3 11 2.5 9.2
Stove 0 0 14 18 14 18 11.7 15
Bicycle 10 4 0 0 10 4 8.3 3.3
Fridge 0 0 1 2 1 2 0.8 1.7
DfID, U. K. (1999). Sustainable livelihoods guidance sheets. London: DFID. Retrieved from www.eldis.org/vfile/upload/1/document/0901/section2.pdf on 7th July, 2015
Dremel, A. L. (2013). Rural depopulation and public service provision in Germany-How is public service provision in depopulated, rural regions in Germany organized and what can be learned from good practices in this field? (Bachelor's thesis, University of Twente). Retrieved from essay.utwente.nl/63375/1/Dremel_-_Bachelor_Thesis.pdf on 20 February, 2015
Fisher, M., & Weber, B. A. (2004). Does economic vulnerability depend on place of residence? Asset poverty across metropolitan and nonmetropolitan areas. The Review of Regional Studies, 34(2), 137-155.
Ghana Statistical Service (2014). Ghana Living Standard Survey Round 6. Poverty profile in Ghana (2005-2013).
Retrieved from www.statsghana.gov.gh/.../GLSS6 _Poverty on 6th May 2016
Global Development Program (2012). Water, sanitation & Hygiene. Bill Gate, Melinda Gates Foundation. Retrieved from www.gatesfoundation.org/water-sanitation-hygiene on 6th May, 2016.
Grau, H. R., & Aide, T. M. (2007). Are rural–urban migration and sustainable development compatible in
mountain systems? Mountain Research and Development, 27(2), 19-123.
Hove, M., Ngwerume, E., & Muchemwa, C. (2013). The urban crisis in Sub-Saharan Africa: A threat to human security and sustainable development. Stability: International Journal of Security and Development, 2(1), 1-14
Isaac, A., & Raqib, A. S. (2013). Rural-urban migration and rural community development: A case of Kpongu community of Upper West Region of Ghana. African Journal of History and Culture, 5(4), 72-77.
Islam, M. M., Ali, R. N., Salehin, M. M., & Islam, A. H. M. S. (2008). Rural women and poverty: A study on the role of RDRS for poverty alleviation in Bangladesh. Journal of the Bangladesh Agricultural University, 6(2), 415-421.
Lall, S. V., Selod, H., & Shalizi, Z. (2006). Rural-urban migration in developing countries: A survey of theoretical predictions and empirical findings. World Bank Policy Research Working Paper 3915. Retrieved from https://openknowledge.worldbank.org/handle/ 16th June, 2015
McCatty, M. (2004). The process of rural-urban migration in developing countries. An honours essay submitted in fulfilment of the degree of Bachelor of Arts to Department of Economics, Carleton University, Ottawa, Ontario. Retrieved from www.dphu.org/uploads/attachements/books/books_3290_0.pdf on 16th June, 2015 McGranahan, G., & Tacoli, C. (2006). Rural-urban migration in China: policy options for economic growth,
environmental sustainability and equity (Vol. 12). IIED. Retrieved from
http://pubs.iied.org/pdfs/10535IIED.pdf on 28th November, 2015
Miheretu, B. A. (2011). Causes and consequences of rural-urban migration: the case of Woldiya town, North Ethiopia. Retrieved from http://uir.unisa.ac.za/handle/ 10500/4756 on 14th July, 2015
Minjale, I. (2014). Livelihood Strategies for Recent Rural-Urban migrants in Slum Areas: A Case of Ndirande and Soche Townships in Blantyre-Malawi. Thesis Submitted to the Faculty of Social Science, University of Malawi in partial fulfillment of the requirements for the degree of Master of Arts (Development Studies) Misra, P., & Alam, M. S. (2014). Urban informal sector & migrants. International Journal of Business and
Administration Research Review, 2(4), 72-86.
Nam, Y., Huang, J., & Sherraden, M. (2008). Assets, Poverty, and Public Policy: Challenges in Definition and Measurement A Report in the Series Poor Finances: Assets and Low-Income Households. Retrieved from
http://s3.amazonaws.com/academia.edu.documents/40041 on 2nd April, 2016
Nsiah-Gyabaah (2003). Urbanization, Environmental Degradation and food security in Africa. A Global Environmental Change Research Community. 1 (1), 1-25
Sabates-Wheeler, R., Sabates, R. & Castaldo, A., 2008. Tackling poverty-migration linkages: evidence from Ghana and Egypt. Social Indicators Research, 87(2), 307-328.
Sen, A. (1999). Freedom as development. Retrieved from http://www.google.com.
gh/url?sa=t&rct=j&q=&esrc=s&source=web&cd on 6th August, 2015
Tacoli, C., McGranahan, G., & Satterthwaite, D. (2015). Urbanisation, rural-urban migration and urban poverty. Human Settlements Group, International Institute for Environment and Development. Retrieved from
https://www.iom.int/.../WMR-2015-Background-Paper- on 16th June, 2015
Tanle, A. (2014). Assessing livelihood status of migrants from northern Ghana resident in the Obuasi Municipality. Geography Journal, 79(5), 577-590.
Timalsina, K. P. (2007). Rural urban migration and livelihood in the informal sector: A study of street vendors of Kathmandu Metropolitan City, Nepal (Master's thesis, Geografisk institutt). Retrieved from
https://brage.bibsys.no/xmlui/bitstream/ handle/11250/265207/122401_FULLTEXT01.pdon 28th June, 2015
Tindigarukayo, J. K. (2014).The Impact of Rural-Urban Influx on Jamaican Society. International Journal of Humanities and Social Science. 4, 9(1); 35-40.
Todaro, M., & Smith, S. (2012). Economic development (11th ed.). Boston: Addison Wesley
Journal of the American Institute of Planners, 34(6), 354-363.
United Nations (2011). Population Distribution, urbanization, internal migration and Development: An international perspective. Development of Economic and social Affairs Population Division. Retrieved from
http://www.un.org/esa/ population/publications/on 31st December, 2014
Waddington, H. & Sabates-Wheeler, R. (2003). How Does Poverty Affect Migration Choice? A Review of Literature. Development Research Centre on Migration, Globalisation and Poverty: 1-22. Retrieved from http://www.migrationdrc. org/publications/working_papers/WP-T3.pdf on 12th March, 2016
WHO/UNICEF Joint Water Supply, Sanitation Monitoring Programme, World Health Organization, & UNICEF. (2008). Progress on drinking water and sanitation: special focus on sanitation. World Health Organization. Retrieved from https://www.wssinfo.org/fileadmin/user_upload/resources/1251794333-JMP_08_en.pdf on 13th April, 2016
Wolman, H., & Spitzley, D. (1996). The politics of local economic development. Economic Development Quarterly, 10(2), 115-150.
Wondimagegnhu, B. A. (2012). Economic Impact of Rural-Urban Migration on Income and Poverty of Migrant Sending Rural Households: With Evidences from Southern Ethiopia (Doctoral dissertation, Ruhr University of Bochum). Retrieved from on https://core.ac.uk/download/pdf/18212081.pdf 12th December, 2015.
Xie, Q., & Stough, R. (2002, June). Public-private partnerships in urban economic development and prospects of
their application in China. In International Conference “Transitions in Public Administration and
Governance, Beijing (pp. 15-19). Retrieved from http://unpan1.un.org/intradoc/groups/public/
documents/aspa/unpan004644.pdf on 29th December, 2014
Yankson, P. W., & Bertrand, M. (2012). Challenges of urbanization in Ghana. The Mobile City of Accra, 25. Retrieved from http://horizon.documentation.ird. fr/exl-doc/pleins_textes/divers13-04/010056998.pdf. on 15th February, 2014