Analyzing Test Driven Development based on
GitHub Evidence
Neil C. Borle, Meysam Feghhi, Eleni Stroulia, Russell Greiner, Abram Hindle
Department of Computing ScienceUniversity of Alberta Edmonton, Canada
Email: {nborle, feghhi, stroulia, rgreiner, hindle1}@ualberta.ca
Abstract—Testing is an integral part of the software-development lifecycle, approached with varying degrees of rigor by different process models. Agile process models advocate Test Driven Development (TDD) as one among their key practices for reducing costs and improving code quality. In this paper we comparatively analyze GitHub repositories that adopt TDD against repositories that do not, in order to determine how TDD affects a number of variables related to productivity and developer satisfaction, two aspects that should be considered in a cost-benefit analysis of the paradigm.
In this study, we searched through GitHub and found that a relatively small subset of Java-based repositories can be seen to adopt TDD, and an even smaller subset can be confidently identified as rigorously adhering to TDD. For comparison pur-poses, we created two same-size control sets of repositories. We then compared the repositories in these two sets in terms of number of test files, average commit velocity, number of commits that reference bugs, number of issues recorded, whether they use continuous integration, and the sentiment of their developers’ commits. We found some interesting and significant differences between the two sets, including higher commit velocity and increased likelihood of continuous integration for TDD repositories.
I. INTRODUCTION
Test Driven Development (TDD) is a practice advocated by agile software-development methodologies, in which tests are written in advance of source code development. These tests, bound to fail originally in the absence of any “real” code, effectively constitute a specification of the functionality and behavior of the software code, which can be tested as it is being developed [1]. The provision of immediate, specific and local feedback is believed to have a positive effect on code quality, may have an effect on the rate at which code is developed, and might also have an effect on the emotional state of the developers.
Ideally in TDD, all tests should be written in advance of all source code but this kind of rigor may not be consis-tently found among test-concious developers [2]. Since the consistency with which TDD is adopted by different software project varies, its effects are also likely to vary. In this paper, we report on a study designed to investigate the way TDD is actually practiced and the distinct characteristics that TDD projects exhibit, not typically found in non-TDD projects. More specifically, we study the prevalence and influence of TDD and TDD-like methodologies on software development processes in Java repositories hosted on GitHub in 2015.
Further we seek to determine if detectable differences in sentiment can be observed between repositories that practice TDD and those that do not. In our research we explore the following questions:
RQ1:Does the adoption of TDD improve commit velocity?
RQ2: Does the adoption of TDD reduce the number of bug-fixing commits?
RQ3: Does the adoption of TDD affect the number of issues reported for the project?
RQ4: Is continuous integration more prevalent in TDD development?
RQ5: Does the adoption of TDD affect developer or user satisfaction?
To find TDD repositories we use the capabilities of BOA [3] to look at the abstract syntax trees (ASTs) of source and test code to determine if they follow a testing paradigm. RQ1
andRQ2 are both answered through the analysis of commits in each repository, the former with commit timestamps and the latter by the commit messages themselves. Next, RQ3
is addressed by extracting the issues associated with the repositories in our study and counting the numbers of their occurrences. RQ4 is addressed by finding occurrences of travis.yml files, as evidence for the use of continuous integration. Finally, in the pursuit of RQ5, we applied senti-ment analysis to the revision logs, issues, issue comsenti-ments, and pull-request messages.
For our study, we had to construct sets of repositories that are not adopting TDD, against which to compare the ones we identified to follow TDD practices. The key requirement for this task is to develop a method for constructing these “control repository sets” so that they are comparable to the TDD-adopting repositories. To that end, we used K-means clustering to group repositories, and we randomly sampled control repositories that are comparable to the range of sizes in the clustered sets of repositories. Clustering is important in our study for performing stratified comparisons, which is a
way of controlling for the fact that many GitHub repositories have very few commits [4]. Finally, it is important to note that for all of the comparisons made between control groups and the repositories under test, we consider a p-value of 0.0023 or less to be of statistical significance. This is the Bonferroni [5] corrected alpha value (α=021.05 ≈0.0023) with21p-values.
The rest of this paper is organized as follows. Section II reviews related work. Sections III, IV and V explain our methdology for this study, report on our findings, and reflect on the threats to the study’s validity. Finally, in Section VI, we conclude with a summary of our work and the lessons we learned from it.
II. RELATEDWORK
A. TDD practices
In 2007, Hindleet al.described a taxonomy for classifying revisions based on the types of files being changed in a revi-sion. The classes of this taxonomy include source revisions, test revisions, build revisions and documentation revisions (STBD) [6]. In the context of Hindleet al.this study considers source code revisions and test revisions, the revision classes most relevant to TDD.
Zaidman et al. studied two different open source repos-itories to determine if testing strategies such as TDD are detectable [7]. Zaidmanet al.present a method of associating source code with test code by relying on a naming convention where the word “Test” is added as a postfix to a test file corresponding to a similarly named source file. They also reference the use of JUnit imports as a method of test file identification [7]. In our study we consider use of import statements as well as this naming convention for associating test files to source files when detecting TDD. We differ in that we perform case insensitive matching of the word “Test” to a file name instead of just considering “Test” as a postfix.
Beller et al. [2] studied the prevalence of TDD practices among several developers by having them install a tool that monitored their development in their integrated development environment (IDE). They found that TDD is rarely practiced by software developers. In other work Belleret al.[8] found that of a group of40students50%spent very little time testing their code. This suggests that an analysis of GitHub reposito-ries may yield small numbers of test files in repositoreposito-ries.
Athanasiou [9] found that there is a positive correlation between test code quality and throughput and productivity. This is relevant to our work because it shows that an emphasis placed on testing can result in software development benefits. In 2016, Santos and Hindle [10] studied the relationship between build failure in GitHub repositories and the “unusu-alness” of the commit messages that they found in those repos-itories. To achieve this, they looked specifically at repositories using Travis-CI, a tool for continuous integration that is widely used in the open-source community1 [10]. In our work we will determine how popular Travis-CI is among practitioners of TDD and TDD-like software development.
1https://travis-ci.org/
Vailescuet al.also studied Travis-CI use in GitHub. They looked at its prevalence and whether or not projects that had Travis-CI configured are actually using the integration system. Their work considered a sample of active GitHub repositories obtained using GHTorrent. They found that a large number of repositories are configured for Travis-CI but that less than
50% were making use of it [11].
B. Sentiment In Software Artifacts
To establish the credibility of extracting sentiment from software artifacts, Murgia et al. conducted a study to deter-mine if software developers left opinions behind during the development process. They concluded that developers do leave emotional content in their software artifacts. From this they suggest that the automated mining of developers’ emotions from their software artifacts is feasible [12]. Additionally, others have applied sentiment analysis in the context of StackOverflow showing breadth in this tools application to software engineering [13].
Guzmanet al. used sentiment analysis to extract opinions from commit messages belonging to GitHub projects. Their research identified relationships between positive and negative sentiment and factors such as the programming language used, team members’ geographic locations, day of the week and project approval [14]. Like Guzmanet al.we apply sentiment analysis to the messages left behind during the development process, but focused our approach on the comparisons of projects using TDD process with those not using TDD process.
C. Clustering for Sampling
One of the oldest problems in the field of computational geometry is that of partitioning d dimensional points in
IRd into appropriate groups (clusters) where members of a cluster are related to one another [15]. To achieve this goal for clustering repositories, we use the well known K-means algorithm. The generic K-means variant can be described in four steps [15]: first k initial points (centers) are arbitrarily selected in IRd space. Second, all points in IRd space are assigned to the closest center. Third, centers are recalculated to be the center of each cluster determined in the seconds step. Finally, steps two and three are repeated until there is no longer any change in the value of the centers calculated in step two.
To assess the quality of clusters generated from any cluster-ing method such as K-means, Rousseeuw developed a visu-alization technique for cluster quality known as the silhouette plot [16].
s(i) = b(i)−a(i)
max{a(i), b(i)} (1) In the above equation,s(i)is the silhouette of theith data point, a(i) is the average dissimilarity between the ith data point and the other members of its cluster, and b(i) is the minimum average dissimilarity between theithdata point and
the other clusters that exist in the partitioned space. Note that the reference to dissimilarity implies the use of some
distance metric. Using the above equation, we can obtain the average silhouette width from all the silhouette values for each cluster to determine the quality of the clusters individually. Alternatively, we can find the average silhouette width across all clusters to determine the quality of a particularkpartition of the data space using K-means clustering for example.
III. THESTUDYMETHOD
A. The Data Set
We used the BOA infrastructure [3] to obtain 256572Java repositories from a copy of GitHub, archived September2015. From each of these repositories, we obtained the repository URL, its commit logs, its commit timestamps, and its re-visions; for each revision, we collected the names of the Java files created in it. Further, we used GitHub’s application programming interface (API) to obtain the repository issues and pull requests.
Of these 256572Java repositories,41301 contain test files. An even smaller subset of 20590 repositories, to which we refer as TDD-like repositories, contain test files created in advance of the source-code files they test. Finally, a set of1954
repositories, to which we refer as TDD repositories, fulfill the TDD-like requirement and also exhibit high class coverage, as defined later.
In our study, we analyzed all TDD repositories (1954) and the 76the most substantial TDD-like repositories, the cluster where repositories had the largest numbers of authors and commits. For the purpose of comparing TDD and non-TDD projects, we created three corresponding control repository collections. Some descriptive statistics from our data set are reported in Table I, below.
Commits Issues Pull Requests
TDD CTRL TDD CTRL TDD CTRL
Cluster 9 189150 158168 1804 8384 497 2831
Cluster 1 9227 11454 141 206 96 74
Cluster 2 4102 3280 235 124 133 43
TABLE I: Distribution of Commits, Issues and Pull Requests
It is important to note here that the TDD/TDD-like sets were disjoint from their control sets and that each repository from each set had at least one commit and commit message.
B. Recognizing Repositories That Practice TDD
For this study, we take the following three characteristics of software projects as evidence of TDD adoption: (a) the inclusion of test files, (b) the development of tests before the development of the source-code these tests exercise, and (c) the high coverage of the overall source code by tests.
How many repositories include test files?: To determine how many repositories included test files we used the abstract syntax trees available through BOA to study the import statements in each Java file for each repository. This included import statements that matched the following regular
expres-sion where JUnit2, TestNG3 and Android test4are frameworks
and tools for implementing test cases. ‘ˆ(org\.junit\.\*)| (org\.junit\.Test)| (junit\.framework\.\*)| (junit\.framework\.Test)| (junit\.framework\.TestCase)| (org\.testng\.*)| (android\.test\.*)$‘
Once a file was shown to contain one of these imports, we considered the repository as containing test files, and thus meeting the first criterion for being considered as adopting TDD.
How many repositories write test files first (TDD-like)?:
We then reviewed all the revisions and all associated Java files created in each revision. Here, we excluded all repositories where there were no Java files that could be identified as test files and unlike the previous question, we only considered files that contained JUnit imports. This process involved four steps. Step 1. We partitioned the Java files into two sets, for each of the repositories. The first set included files identified as test files, because their filename matched the regular expression shown below and they imported JUnit. The second set contained the remaining Java files.
/.*test.*\.java/i
Step 2. For each file in each set we identified its creation time, based on the revision in which it was created.
Step 3. For each of the test files we found matching or similarly named files, under the assumption that Java programmers typically name their test files according to their source-code files. For example, “someFile.java” might have a corresponding test file called “TestSomeFile.java” or “someFileTest.java”. If no matching file could be found, we searched for similar files. Similar file names were identified using the Python Standard Library for string comparison. A similarity threshold of 0.8 was used, where 0 is completely dissimilar and 1 is exactly the same. This threshold was chosen because it could match, for example, words like “search” with “searching”. Here the file “searchTest.java” would be similar to “searching.java”. Finally, if no matching or similar files were found for a test file, that test file would be ignored in this step.
Step 4. Having identified pairs of files, including a test file and a source-code file with matched or similar name, we then ensured that the timestamp associated with the test file was either older or the same as the source file(s). This
2http://junit.org/junit4/ 3http://testng.org/doc/index.html
ensured that the test file was either committed before or at the same time as the source file(s).
How many repositories practice TDD?: For this question we again considered JUnit, Android and TestNG imports as identifying test files. Unlike the TDD-like repositories collected through the process above, to declare a repository as rigorously practicing TDD we added an additional criterion: in addition to having test files created at the same time or before source code files, TDD repositories had to have high class coverage where all the classes defined in the top level namespace of source files are referenced in at least one test file.
To determine if a repository has high class coverage we used the ASTs provided in the BOA framework. Each Java file in a repository is associated with an ASTRoot AST Type, a container class that holds the AST [3]. After obtaining this object, BOA allows navigation through the namespace of the source file (the Java package) so that the declarations made in the namespace can be observed. In our case, when looking through source files we only recorded class declarations in the namespaces provided by the ASTRoot. To deal with test files we looked at all the types that were referenced in the test file and recorded these. This includes types that were explicitly referenced in the initial declaration of a variable as well as any type changes that occur when a variable is reassigned. For example, if a variable of type “MyInterface” is declared and later assigned an instance of a class “ImplementsMyInter-faceClass”, we would detect the use of this class.
Finally combining the knowledge of types used in test files with classes declared in source files, we considered a repository to have high class coverage only if every class defined in all source files was referenced in at least one test file in the most current version of the repository.
C. Control Set Construction
Now that we had a method for obtaining TDD and TDD-like repositories, we needed a way to produce control sets of repositories against which we could compare those that we obtained. Again, we needed to be conscious of the many “perils” of GitHub [4] so we employed stratified sampling through K-means clustering to address this problem. In partic-ular, we used K-means clustering to group repositories based on their total number of commits and authors. These features were selected due to concerns that imbalances in the number of commits or authors (confounding factors) could lead to comparisons being made between large active repositories and small inactive repositories.
When clustering TDD-like repositories, we found that the distribution of our data points was not well suited to clustering initially, leading to highly imbalanced clusters. To mitigate this issue we applied the following transformation to the features:
F eaturenew=loge(Authors) +loge(Commits) (2)
The results of the clustering can be observed in Table II. This transformation was important because we wanted to
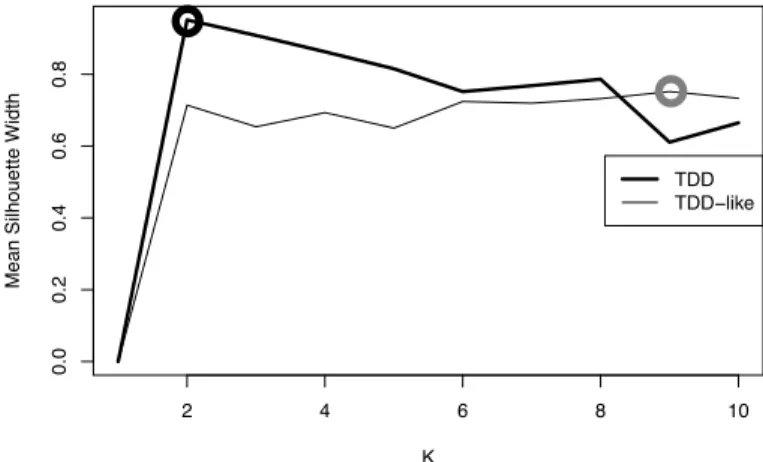
obtain a data partitioning, such that the cluster of repositories with the largest numbers of commits and authors was large enough to produce a sample from which we could achieve statistically significant conclusions. To select the values ofk to be used in K-means clustering we used mean silhouette width as our measure of clustering quality. For TDD-like repositories we restricted the value ofkto be within the range
2 to 10 to avoid creating clusters with too few repositories to make statistically meaningful conclusions. The plot of the mean silhouette values for the TDD-like clusters can be seen in Figure 1. 2 4 6 8 10 0.0 0.2 0.4 0.6 0.8 K
Mean Silhouette Width
TDD TDD−like
Fig. 1: Mean Silhouette Width for TDD/TDD-like K-means Considering the silhouette plot for the TDD-like clusters, we usedk= 9. From the resulting clusters we chose to work with cluster9 to answer the remaining research questions because it contained the most substantial repositories in terms of numbers of commits and authors. Finally, to generate a control set for the TDD-like repositories we randomly sampled 76
repositories where loge(Authors) +loge(Commits) values
were on the interval (9.36,14.07) to match the76 TDD-like repositories we had obtained.
For the set of TDD repositories k = 2 was used for clustering because it gave the highest mean silhouette value in Figure 1. For this task clustering was performed in two di-mensions and log transformations were not used because good clustering could be achieved without these manipulations.
The results of this clustering produced Table III below. To generate equivalently sized control sets for clusters 1 and2, we found the two repositories from each cluster where one had the smallest number of authors (Amin) and the other had
the smallest number of commits (Cmin). Then we found the
two repositories where one had the largest number of authors (Amax) and the other had the largest number of commits
(Cmax). Finally, random sampling took place for each cluster
so that every control repository had Cmin and Cmin values
greater than the smallest two repositories, andCmaxandCmax
values smaller than the largest two repositories in each cluster.
D. Investigating Our Research Questions
Having obtained a set of TDD and TDD-like repositories, we then used this set and the corresponding control set of
Size Amin Amedian Amax Cmin Cmedian Cmax sumlogmin sumlogmax Cluster 1 2970 1 1 1 1 1.0 1 0 0 Cluster 2 1791 1 1 1 2 2.0 2 0.69 0.69 Cluster 3 3732 1 1 2 2 3.0 5 1.10 1.61 Cluster 4 3819 1 1 3 3 6.0 11 1.79 2.40 Cluster 5 4079 1 2 5 4 12.0 30 2.48 3.40 Cluster 6 2456 1 2 8 7 23.0 96 3.43 4.56 Cluster 7 1242 1 3 13 16 53.0 394 4.57 6.11 Cluster 8 425 1 7 40 32 156.0 1305 6.11 9.22 Cluster 9 76 11 67 167 253 1289.5 7763 9.36 14.07
TABLE II: Clustered TDD-like Repositories
Size Amin Amedian Amax Cmin Cmedian Cmax
Cluster 1 1873 1 1 6 1 3 27
Cluster 2 81 1 2 18 28 42 116
TABLE III: Clustered TDD Repositories
equal cardinality to answer our research questions.
1) RQ1: Does TDD/TDD-like improve commit velocity?:
To address this question we extracted the timestamps associ-ated with all the commits collected and then noted the average of the timestamp differences (deltas) between commits in each repository.
2) RQ2: Does TDD/TDD-like reduce the required number of bug fixing commits?:
/.*((solv(ed|es|e|ing))|(fix(s|es|ing|ed)?) |((error|bug|issue)(s)?)).*/i
To address this question we used the regular expression shown above to identify bug fixing commits in the repositories. We consider this count to be an approximation of the number of bugs that had existed in that repository.
3) RQ3: Does TDD/TDD-like affect the number of issues that are associated with a repository?: To address this ques-tion we counted the number of issues associated with each repository from the two sets and observed the differences between them. Issues were obtained through the GitHub API.
4) RQ4: Is continuous integration more prevalent in TDD/TDD-like development?: To address this we used a part of a publicly available BOA script5 in order to determine if
a Travis-CI travis.yml file was present in a repository. While we focus specifically on Travis-CI, we used this as an approximation for counting the number of repositories that were using continuous integration.
5) RQ5: Does TDD affect developer or user satisfaction?:
To address this we applied the methodology described by Guzman et al. [14] using the software SentiStrength6 to the two TDD clusters we obtain. Once sentiment scores had been obtained for each of the commits, we then averaged the scores for each repository to obtain repository level sentiment scores. We used the commits obtained from BOA and the issues and pull requests obtained from the GitHub API
5http://boa.cs.iastate.edu/boa/?q=boa/job/public/30188 6http://sentistrength.wlv.ac.uk/
IV. ANALYSIS ANDFINDINGS
A. Repository Counts
Of the256572Java repositories available in our GitHub data set, we identified 41302 (16.1%) repositories as having test files,20590(8.0%) repositories as TDD-like where they create test files before creating source files, and 1954 repositories (0.8%) as practicing TDD according to our criteria.
B. How many Repositories have Test Files
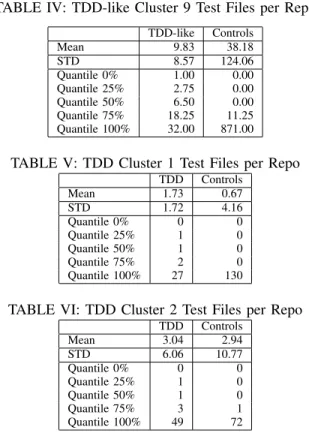
TABLE IV: TDD-like Cluster 9 Test Files per Repo TDD-like Controls Mean 9.83 38.18 STD 8.57 124.06 Quantile 0% 1.00 0.00 Quantile 25% 2.75 0.00 Quantile 50% 6.50 0.00 Quantile 75% 18.25 11.25 Quantile 100% 32.00 871.00 TABLE V: TDD Cluster 1 Test Files per Repo
TDD Controls Mean 1.73 0.67 STD 1.72 4.16 Quantile 0% 0 0 Quantile 25% 1 0 Quantile 50% 1 0 Quantile 75% 2 0 Quantile 100% 27 130
TABLE VI: TDD Cluster 2 Test Files per Repo TDD Controls Mean 3.04 2.94 STD 6.06 10.77 Quantile 0% 0 0 Quantile 25% 1 0 Quantile 50% 1 0 Quantile 75% 3 1 Quantile 100% 49 72
In Table IV, we see that the mean number of test files is much larger for the control group but the quantiles also indicate that the control group is highly skewed, and that the median number of test files is larger for the TDD-like cluster.
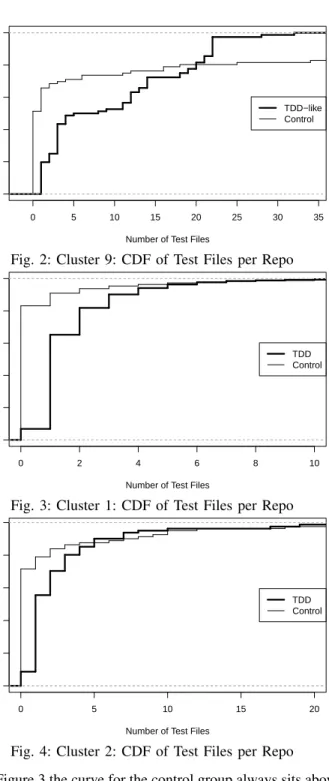
Looking at Figure 2 the vast majority of TDD repositories have more test files and that only the largest 20%of controls have a very large number of test files.
A two sample Mann–Whitney–Wilcoxon test for this data returns a p-value of 3.576e-06, indicating that TDD-like repositories have a significantly larger number of test files as compared to controls of the same size.
0 5 10 15 20 25 30 35 0.0 0.2 0.4 0.6 0.8 1.0
Number of Test Files
Cum
ulativ
e Density TDD−like
Control
Fig. 2: Cluster 9: CDF of Test Files per Repo
0 2 4 6 8 10 0.0 0.2 0.4 0.6 0.8 1.0
Number of Test Files
Cum
ulativ
e Density TDD
Control
Fig. 3: Cluster 1: CDF of Test Files per Repo
0 5 10 15 20 0.0 0.2 0.4 0.6 0.8 1.0
Number of Test Files
Cum
ulativ
e Density TDD
Control
Fig. 4: Cluster 2: CDF of Test Files per Repo In Figure 3 the curve for the control group always sits above the curve for the TDD group. Further, in Table V both the median and the mean values for the TDD group are greater than those of the control group. Taken together this strongly suggests that smaller sized TDD repositories have more test files on average than the control group.
A two sample Mann–Whitney–Wilcoxon test for this data returned “p-value < 2.2e-16”, confirming that there is ex-tremely strong evidence to conclude that smaller TDD repos-itories have more test files.
Similarly to Figure 2 we can see in Figure 4 that the density curve for the TDD group sits below the control group until approximately 90% of the TDD repositories, after which the density lines cross. Additionally, the quantiles indicate that the control data is highly skewed. From the CDF and observing that the mean and median values are larger for the TDD repositories, we can see that larger TDD files tend to have more test files than the controls.
To establish significance, a two sample Mann–Whitney– Wilcoxon test for this data returns a p-value of 3.576e-06, indicating that generally speaking TDD-like repositories have a significantly larger number of test files as compared to controls of the same size.
C. Results for RQ1 0.0 0.5 1.0 1.5 2.0 2.5 0.0 0.2 0.4 0.6 0.8 1.0
Average Commit Velocity
Cum
ulativ
e Density TDD−like
Control
Fig. 5: Cluster 9: CDF of Average Commit Velocity per Repo
0 5 10 15 20 25 30 0.0 0.2 0.4 0.6 0.8 1.0
Average Commit Velocity
Cum
ulativ
e Density TDD
Control
Fig. 6: Cluster 1: CDF of Average Commit Velocity per Repo
0 10 20 30 40 50 0.0 0.2 0.4 0.6 0.8 1.0
Average Commit Velocity
Cum
ulativ
e Density TDD
Control
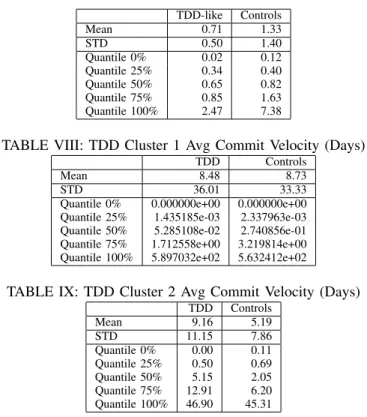
TABLE VII: TDD-like Cluster 9 Avg Commit Velocity (Days) TDD-like Controls Mean 0.71 1.33 STD 0.50 1.40 Quantile 0% 0.02 0.12 Quantile 25% 0.34 0.40 Quantile 50% 0.65 0.82 Quantile 75% 0.85 1.63 Quantile 100% 2.47 7.38
TABLE VIII: TDD Cluster 1 Avg Commit Velocity (Days)
TDD Controls
Mean 8.48 8.73
STD 36.01 33.33
Quantile 0% 0.000000e+00 0.000000e+00 Quantile 25% 1.435185e-03 2.337963e-03 Quantile 50% 5.285108e-02 2.740856e-01 Quantile 75% 1.712558e+00 3.219814e+00 Quantile 100% 5.897032e+02 5.632412e+02
TABLE IX: TDD Cluster 2 Avg Commit Velocity (Days) TDD Controls Mean 9.16 5.19 STD 11.15 7.86 Quantile 0% 0.00 0.11 Quantile 25% 0.50 0.69 Quantile 50% 5.15 2.05 Quantile 75% 12.91 6.20 Quantile 100% 46.90 45.31
As shown in Figure 5 the density curve for the TDD-like repositories sits above the density curve of the corresponding control set. This indicates that most of the TDD-like repos-itories have a smaller average time difference between their commits as compared to the controls. This is further supported by the mean and median values in Table VII where both are smaller for TDD-like repositories.
A two sample Mann–Whitney–Wilcoxon test for differences in TDD-like commits velocity returns a p-value of 0.004218. This is not a significant difference however due toα≈0.0023. As shown in Figure 6 the density curve for the TDD repositories with smaller numbers of commits also sits above the control density curve as did the TDD-like repositories. This indicates that most of these small TDD repositories have a smaller average time difference between their commits as compared to the controls. This is further supported by the mean and median values in Table VIII where both are smaller for TDD-like repositories.
A two sample Mann–Whitney–Wilcoxon test for this data returns a p-value of 4.732e-06, showing there is very strong evidence that control repositories generally have larger elapsed times between commits as compared to their TDD counter-parts.
In Figure 7 the density curve for the TDD repositories with larger numbers of commits sits below the control density curve contrary to the previous results showing that a larger proportion of TDD repositories have larger average velocities. Considering this with the mean and median values in Table IX this suggests that for TDD repositories with larger commits there is a slower commit velocity relative to controls.
A two sample Mann–Whitney–Wilcoxon test for this data returns a p-value of 0.1498, which means there is not suffi-cient evidence to be able to claim any difference in commit velocity between TDD and control repositories that have larger numbers of commits. D. Results for RQ2 0 500 1000 1500 2000 2500 3000 0.0 0.2 0.4 0.6 0.8 1.0
Number of Bug Fixing Commits
Cum
ulativ
e Density TDD−like
Control
Fig. 8: Cluster 9: CDF of Bug Fixing Commits per Repo
0 2 4 6 8 0.0 0.2 0.4 0.6 0.8 1.0
Number of Bug Fixing Commits
Cum
ulativ
e Density TDD
Control
Fig. 9: Cluster 1: CDF of Bug Fixing Commits per Repo
0 5 10 15 20 25 0.0 0.2 0.4 0.6 0.8 1.0
Number of Bug Fixing Commits
Cum
ulativ
e Density TDD
Control
Fig. 10: Cluster 2: CDF of Bug Fixing Commits per Repo In Figure 8 the density curve for the TDD repositories always sits above the density curve for the control repositories, and we see in Table X that the mean and median are smaller for control repositories. This is contrary to the authors’ hypothesis that TDD-like behaviour would reduce the number of bug fixing commits.
A two sample Mann–Whitney–Wilcoxon test for this data returns a p-value of 0.0009295, showing there is strong evi-dence that control repositories generally have smaller numbers of bug fixing commits.
TABLE X: TDD-like Cluster 9 Bug Fixing Commits TDD-like Controls Mean 951.25 678.71 STD 885.07 934.12 Quantile 0% 96.00 7.00 Quantile 25% 323.00 175.50 Quantile 50% 519.00 274.00 Quantile 75% 1512.75 908.00 Quantile 100% 2896.00 6793.00
TABLE XI: TDD Cluster 1 Bug Fixing Commits TDD Controls Mean 0.26 0.41 STD 0.73 1.08 Quantile 0% 0 0 Quantile 25% 0 0 Quantile 50% 0 0 Quantile 75% 0 0 Quantile 100% 7 10
TABLE XII: TDD Cluster 2 Bug Fixing Commits TDD Controls Mean 3.53 4.57 STD 4.49 6.03 Quantile 0% 0 0 Quantile 25% 0 1 Quantile 50% 2 3 Quantile 75% 4 6 Quantile 100% 25 38
As shown in Figure 9, the density curve for the TDD repositories always sits above the density curve for the control repositories showing that these TDD repositories have fewer numbers of commits referencing bugs. This is also supported by the mean value shown in Table XI.
A two sample Mann–Whitney–Wilcoxon test for this data returns a p-value of 0.0009526, showing there is strong evi-dence that control repositories generally have larger numbers of bug fixing commits relative to smaller TDD repositories.
As shown in Figure 10, the density curve for the TDD repositories always sits above the density curve for the control repositories showing that these TDD repositories have fewer commits referencing bugs. This is also supported by the mean and median values shown in Table XII.
A two sample Mann–Whitney–Wilcoxon test for this data returns a p-value of 0.1834, which indicates that despite the evidence in the two figures above there is insufficient evidence to conclude that there is a difference in the number of bug fixing commits between larger TDD repositories and controls.
E. Results for RQ3
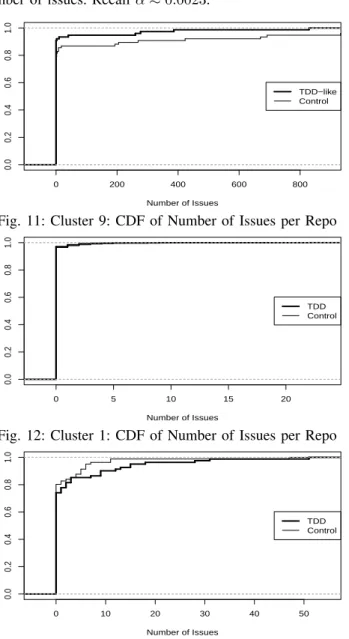
As shown in Figure 11, the density curve for the TDD-like repositories sits above the density curve for the control repositories showing that these TDD-like repositories have fewer numbers of issues. This is also supported by the mean value shown in Table XIII.
A two sample Mann–Whitney–Wilcoxon test for this data returns a p-value of 0.02656, showing there is not enough evidence to conclude that control repositories have a larger number of issues. Recall α≈0.0023.
0 200 400 600 800 0.0 0.2 0.4 0.6 0.8 1.0 Number of Issues Cum ulativ e Density TDD−like Control
Fig. 11: Cluster 9: CDF of Number of Issues per Repo
0 5 10 15 20 0.0 0.2 0.4 0.6 0.8 1.0 Number of Issues Cum ulativ e Density TDD Control
Fig. 12: Cluster 1: CDF of Number of Issues per Repo
0 10 20 30 40 50 0.0 0.2 0.4 0.6 0.8 1.0 Number of Issues Cum ulativ e Density TDD Control
Fig. 13: Cluster 2: CDF of Number of Issues per Repo While a comparison of the means in Table XIII and an inspection of the density curves in Figure 11 seem to suggest that TDD repositories have fewer numbers of issues, a two sample Mann–Whitney–Wilcoxon test for this data produced a p-value of 0.2574. This shows that there is insufficient evidence to conclude that there is any difference between the number of issues in control repositories and smaller TDD repositories.
While a comparison of the means in Table XIII and an inspection of the density curves in Figure 11 seem to suggest that TDD repositories have larger numbers of issues, a two sample Mann–Whitney–Wilcoxon test for this data produced a p-value of 0.3. This shows that there is insufficient evidence to conclude that there is any difference between the number of issues on control repositories and smaller TDD repositories.
TABLE XIII: TDD-like Cluster 9 Issues TDD-like Controls Mean 23.74 110.32 STD 111.92 363.48 Quantile 0% 0 0 Quantile 25% 0 0 Quantile 50% 0 0 Quantile 75% 0 0 Quantile 100% 829 2037
TABLE XIV: TDD Cluster 1 Issues TDD Controls Mean 0.08 0.11 STD 0.70 0.78 Quantile 0% 0 0 Quantile 25% 0 0 Quantile 50% 0 0 Quantile 75% 0 0 Quantile 100% 22 16
TABLE XV: TDD Cluster 2 Issues TDD Controls Mean 2.90 1.53 STD 7.97 5.63 Quantile 0% 0 0 Quantile 25% 0 0 Quantile 50% 0 0 Quantile 75% 1 0 Quantile 100% 51 47 F. Results for RQ4
TABLE XVI: Repositories using Travis-CI Travis-CI Cluster size Percentage
Cluster 9 (TDD-like) 1 76 1.32% Cluster 9 (CTRL) 5 76 6.58% Cluster 1 (TDD) 54 1873 2.88% Cluster 1 (CTRL) 9 1873 0.48% Cluster 2 (TDD) 10 81 12.35% Cluster 2 (CTRL) 0 81 0.00%
Table XVI presents a summary of the repositories that use Travis-CI. From this table, some clear differences can be seen in the counts between the TDD clusters and their controls. To determine the significance of the TDD/TDD-like sets and their controls two sample Mann–Whitney–Wilcoxon tests were performed. For the comparison between TDD-like cluster 9 and its control group a p-value of 0.09787 was obtained. For the comparison between TDD cluster 1 and its control a p-value of 1.085e-08 was obtained and for the comparison between TDD cluster 2 and its control and p-value of 0.001152 was obtained. The p-values for the TDD clusters are significant as α≈0.0023.
From the table and the reported p-values it can be seen that there is no significant difference between TDD-like repos-itories and the control group in terms of reposrepos-itories that use Travis-CI, having a travis.yml file. However, there is a statistically significant difference for both sets of TDD repositories such that the TDD repositories are significantly more likely to be using Travis-CI.
TABLE XVII: P-values for Sentiment Comparisons TDD C1 vs. CTR TDD C2 vs. CTR
Commits 0.3099 0.8987
Issues 0.5081 0.1269
Pull Requests 0.6283 0.0748
G. Results for RQ5
Table XVII reports the results of multiple two sample Mann–Whitney–Wilcoxon tests that were conducted to exam-ine if any differences in sentiment between TDD repositories and control repositories could be detected in commit messages, Issues and issues comments or pull request comments. As can be seen in table XVII there were no significant p-values obtained for any of the tests. This means that statistically speaking, we were unable to conclusively determine that practicing TDD has any effect on the sentiment captured in software repository artifacts.
V. THREATS TOVALIDITY
In this work, internal validity is threatened by our choice to use file names as our basis of TDD identification. In particular, this approach does not consider file contents and not all developers use the source/test file naming convention we assumed. They may instead name files by their use case. Also, it may be the case that repositories truly employing TDD were omitted from our count due to low test to source file ratio. Another threat to internal validity was our use of hand crafted regular expressions for the identification of bugs fixing commits. This may have resulted in an over or underestimation of the true number of bugs. A final threat to internal validity is that the data used for this study was a byproduct of software development and was not collected specifically to study TDD. Construct validity is threatened in this work by not con-sidering dynamic code such as Java reflections, where the behaviour of a class changes at run time7. Therefore we may be erroneously excluding repositories that are practicing TDD. Another threat to construct validity is that we only consider repositories that follow a TDD-like or TDD process from their conception to their current state. This excludes any repositories that either switch from using TDD to another paradigm, or switch from another paradigm to a TDD-like or TDD paradigm. Construct validity is further threatened by our choice to only consider file creation times as this does not account for the order in which the contents of files are completed. Therefore we cannot know if TDD is truly being practiced (all the test code in a test file is written before the source code that it tests). Finally, construct validity is threatened by our choice to measure test files by their imports of JUnit, TestNG and Android test frameworks. This may not capture all testing activities as developers may test with other frameworks or without the use of a framework.
External validity is threatened by our choice to only work with Java files. This was done out of convenience but means that this work may not generalize to other programming
languages. Another threat to external validity was our choice to measure the occurrence of continuous integration by only looking Travis-CI and the presence of atravis.ymlfile. It is possible that repositories practicing continuous integration were ignored in this study for not using Travis-CI. A final threat to external validity was our choice to not exclude small or personal projects from the study. While we have studied a set of repositories that are representative of GitHub, this work may not necessarily generalize to enterprise level software.
VI. CONCLUSIONS ANDFUTUREWORK
In this work we studied Java repositories on GitHub and compared those practicing Test Driven Development (or a TDD-like approach) to those that did not. While our results are interesting, this study cannot claim that any of these results are the direct effect of implementing a TDD-like or TDD paradigm as there may be confounding factors in the data.
In our study we found that 16.1%(41302) of Java reposi-tories on GitHub have test files,8.0%(20590) create test files before they create source code files, and0.8%(1954) practiced TDD in September 2015. This corroborates evidence by Beller
et al.that TDD in not commonly practiced [2]. Of particular interest was our finding that TDD repositories tend to be fairly small, where the largest TDD repository we found had 116
commits.
When compared to the control repositories we found that TDD-like repositories have significantly more bug-fixing com-mits, whereas significance could not be established for commit velocity or number of issues. These results, particularly for the number of bug-fixing commits, contradict the authors’ expec-tations as it was predicted that a TDD-like approach would improve productivity and code quality. Currently we are not able to provide an explanation for why this is the case. When comparing TDD repositories to their respective controls, we found that TDD repositories with smaller numbers of commits and authors have significantly faster commit velocities and fewer numbers of bug fixing commits as the authors expected. We could not find any significant difference in the number of issues for smaller TDD repositories. For the set of TDD repositories with larger numbers of commits we could not find any significant difference in the number of bug fixing commits, average commit velocity or number of issues. This indicates that TDD is an effective paradigm when developing small repositories but may not be particularly effective when developing larger code repositories.
Another interesting finding of this work was that repos-itories that practice TDD according to our definition are significantly more likely to be using Travis-CI as a continuous integration system, and by extension are more likely to be using continuous integration. This indicates that TDD practi-tioners may make better use of available continuous integration technologies.
Finally, our study of difference in sentiment between TDD repositories and control repositories showed that sentiment may not be a meaningful metric with which to compare different software development paradigms.
Having studied the differences between repositories practic-ing TDD and those that do not, future work needs to be done to more rigorously determine if these are the direct results of implementing a TDD methodology and to identify, if any, confounding factors that may have influenced these results. Extensions of this work will involve studying the order in which methods within classes are developed and tested, as well as investigating how source and test files correlate over time between TDD repositories and repositories using other development methodologies.
ACKNOWLEDGMENT
The authors wish to acknowledge the support of NSERC. REFERENCES
[1] K. Beck, Test-driven development: by example. Addison-Wesley Professional, 2003.
[2] M. Beller, G. Gousios, A. Panichella, and A. Zaidman, “When, how, and why developers (do not) test in their ides,” inProceedings of the 2015 10th Joint Meeting on Foundations of Software Engineering. ACM, 2015, pp. 179–190.
[3] R. Dyer, H. A. Nguyen, H. Rajan, and T. N. Nguyen, “Boa: A language and infrastructure for analyzing ultra-large-scale software repositories,” in 35th International Conference on Software Engineering, ser. ICSE 2013, May 2013, pp. 422–431.
[4] E. Kalliamvakou, G. Gousios, K. Blincoe, L. Singer, D. M. German, and D. Damian, “The promises and perils of mining github,” inProceedings of the 11th working conference on mining software repositories. ACM, 2014, pp. 92–101.
[5] Y. Hochberg, “A sharper bonferroni procedure for multiple tests of significance,”Biometrika, vol. 75, no. 4, pp. 800–802, 1988.
[6] A. Hindle, M. W. Godfrey, and R. C. Holt, “Release pattern discovery via partitioning: Methodology and case study,” in Mining Software Repositories, 2007. ICSE Workshops MSR’07. Fourth International Workshop on. IEEE, 2007, pp. 19–19.
[7] A. Zaidman, B. Van Rompaey, S. Demeyer, and A. Van Deursen, “Mining software repositories to study co-evolution of production & test code,” inSoftware Testing, Verification, and Validation, 2008 1st International Conference on. IEEE, 2008, pp. 220–229.
[8] M. Beller, G. Gousios, and A. Zaidman, “How (much) do developers test?” in Software Engineering (ICSE), 2015 IEEE/ACM 37th IEEE International Conference on, vol. 2. IEEE, 2015, pp. 559–562. [9] D. Athanasiou, A. Nugroho, J. Visser, and A. Zaidman, “Test code
quality and its relation to issue handling performance,” Software En-gineering, IEEE Transactions on, vol. 40, no. 11, pp. 1100–1125, 2014. [10] E. A. Santos and A. Hindle, “Judging a commit by its cover; or can a commit message predict build failure?” PeerJ PrePrints, 2016. [Online]. Available: https://doi.org/10.7287/peerj.preprints.1771v1 [11] B. Vasilescu, S. Van Schuylenburg, J. Wulms, A. Serebrenik, and
M. G. van den Brand, “Continuous integration in a social-coding world: Empirical evidence from github.** updated version with corrections**,”
arXiv preprint arXiv:1512.01862, 2015.
[12] A. Murgia, P. Tourani, B. Adams, and M. Ortu, “Do developers feel emotions? an exploratory analysis of emotions in software artifacts,” in Proceedings of the 11th Working Conference on Mining Software Repositories. ACM, 2014, pp. 262–271.
[13] B. Bazelli, A. Hindle, and E. Stroulia, “On the personality traits of stackoverflow users,” in 2013 IEEE International Conference on Software Maintenance. IEEE, 2013, pp. 460–463.
[14] E. Guzman, D. Az´ocar, and Y. Li, “Sentiment analysis of commit comments in github: an empirical study,” in Proceedings of the 11th Working Conference on Mining Software Repositories. ACM, 2014, pp. 352–355.
[15] D. Arthur and S. Vassilvitskii, “k-means++: The advantages of careful seeding,” in Proceedings of the eighteenth annual ACM-SIAM sym-posium on Discrete algorithms. Society for Industrial and Applied Mathematics, 2007, pp. 1027–1035.
[16] P. J. Rousseeuw, “Silhouettes: a graphical aid to the interpretation and validation of cluster analysis,” Journal of computational and applied mathematics, vol. 20, pp. 53–65, 1987.