Canterbury Christ Church University’s repository of research outputs http://create.canterbury.ac.uk
Please cite this publication as follows:
Afrifa, G. (2016) Net working capital, cash flow and performance of UK SMEs. Review of Accounting and Finance, 15 (1). pp. 21-44. ISSN 1475-7702.
Link to official URL (if available):
http://dx.doi.org/10.1108/RAF-02-2015-0031
This version is made available in accordance with publishers’ policies. All material made available by CReaTE is protected by intellectual property law, including copyright law. Any use made of the contents should comply with the relevant law.
Canterbury Christ Church University’s repository of research outputs http://create.canterbury.ac.uk
Please cite this publication as follows:
Afrifa, Godfred Adjapong (2016) Net Working Capital, Cash Flow and Performance of UK SMEs. Review of Accounting and Finance, 51 (1). (In Press)
Link to official URL (if available):
This version is made available in accordance with publishers’ policies. All material made available by CReaTE is protected by intellectual property law, including copyright law. Any use made of the contents should comply with the relevant law.
1
Net Working Capital, Cash Flow and Performance of UK SMEs
Godfred Adjapong Afrifa1
Abstract
This paper examines the influence of cash flow on the relationship between net working capital and firm performance. The paper employs unbalanced panel data regression analysis on a sample of 6,926 non-financial small and medium enterprises in the United Kingdom for the period from 2004 to 2013. The results indicate a strong concave relationship between net working capital and performance in the absence of cash flow; however, the relationship becomes convex after taking cash flow into consideration. The results further show that firms with cash flow below the sample median exhibit lower investment in working capital but firms with cash flow above the sample median have higher investment in working capital. The results suggest that managers should consider their firms cash flow when determining the appropriate investment to be made in working capital, so as to improve performance. Overall, the results suggest that whilst firms with limited cash flow should strive to reduce investment in working capital, firms with available cash flow should increase investment in working capital in order to improve performance. This current study incorporates the relevance of cash flow in assessing the association between WCM and firm performance.
Key words: Net working capital, performance, SMEs, cash Flow
1
Senior Lecturer in Accounting & Finance at The Business School, Canterbury Christ Church University, North Holmes
2 1 Introduction
Most of the documented empirical evidence of net working capital (NWC) focuses on the relevance of working capital management (WCM) to firm performance (Deloof, 2003; Faulkender and Wang, 2006; Fazzari and Petersen, 1993). However, the effect of cash flow on the relationship between WCM and firm performance is scant. This paper examines the cash flow implications of the effect of NWC on performance of Small and Medium Enterprises (SMEs) in the United Kingdom (UK). WCM is important to firms because it involves a trade-off between risk and performance (Deloof, 2003; Smith, 1980). Nasr and Afza (2009) contend that firms can minimise risk and increase performance by understanding the importance of working capital.
Research indicates that WCM is more important to SMEs than to larger firms (Baños-Caballero et al., 2010; Peel and Wilson, 1996). This is because SMEs lack access to external finance (Fazzari and Petersen, 1993; Petersen and Rajan, 1997; Whited, 1992) and rely heavily on WCM as a vital source of finance (Padachi, 2006). Also, comparatively SMEs have more current assets and liabilities as a percentage of total assets and total liabilities than larger firms (Padachi, 2006) and therefore the need for proper management. For example, Vanhorne and Wachowicz (2001) estimate that for a typical manufacturing SME, current assets account for over half of its total assets. Further, a study by Garcia-Teruel and Martinez-Solano (2007) found that current assets of Spanish SMEs represent 69% of their total assets, while their current liabilities represent more than 52% of their total liabilities. The high proportion of both current assets and current liabilities in relation to total assets and total liabilities respectively means that managers should devote a considerable proportion of their time to working capital matters (VanHorne and Wachowiez, 2001).
3
LessNWC means a lower investment in working capital while a higher NWC denotes a higher investment in working capital. Higher NWC may help improve the performance of firms because it can stimulate sales (Baños-Caballero et al., 2010), prevent production interruptions (Blinder and Maccini, 1991), strengthen a firm’s long term relationship with their customers (Ng et al., 1999) and influence the acquisition of merchandise at times of low demand (Emery, 1987). However, Soenen (1993) suggests that higher investment in working capital might be a fundamental cause of bankruptcy of firms. This is because investment in working capital represents the amount of money locked up, which could have been invested in profitable opportunities. A higher NWC means that a firm should find alternative ways of financing the investment in working capital (Kieschnick et al., 2011). However, there are costs involved with raising finance and as argued by Myers and Majluf (1984), external finance is more expensive than internal finance. The expensive nature of external finance stems from the problem of asymmetric information between investors and management (Baños-Caballero et al., 2014). The problem of asymmetric information is more acute in SMEs (Belghitar and Khan, 2013) because of the high cost of monitoring, less information made publicly and less analyst following (Mantecon, 2008). This suggests that the availability of cash flow in SMEs will help improve WCM performance because of the low cost associated with it.
Some research shows that minimising the investment in working capital will result in higher performance because of lack of finance in general and the expensive nature of external finance in particular (Baños-Caballero et al., 2014). Following this line of thinking, Autukaite and Molay (2011), state that firms can reduce their dependence on outside financing, lower their financing cost and enjoy financial flexibility through effective management of working capital. They also argue that effective WCM leads to a reduction in riskiness of a firm, which attracts cheaper financing from both shareholders and lenders. Ganessan (2007) asserts that reducing the investment in working capital leads to less need for financing and less cost of capital, which increases the cash available to shareholders. However, other evidence also shows that the
4
availability of cash flow will increase the investment in working capital (Chiou et al., 2006; Hill et al., 2010). For example, Fazzari and Petersen (1993) argue that investment in working capital is sensitive to cash flow. Their findings show that firms that have larger capacity to generate internal finance have higher current asset levels. Chiou et al. (2006) also provide evidence from Taiwan to point to the influence of cash flow on investment in working capital and suggest that firms with greater cash flow have higher investment in working capital. Hill et al. (2010) show that firms with available internal cash flow capacity and capital market access invest more in working capital. By contrasting the two spectrums of researches, it can be suggested that the level of investment in working capital depends on the cash flow availability of firms (Fazzari et al., 1988). As argued by Banos-Caballero et al. (2014), a positive working capital level needs financing, and therefore cash flow availability plays an important role in the relationship between WCM and firm performance.
These positive and negative influences of NWC on performance suggest that investment in working capital involve a trade-off (Baños-Caballero et al., 2012; Deloof, 2003). Therefore, to test the effect of cash flow on the relationship between NWC and performance, I estimate a non-linear regression similar to that of Banos-Caballero et al. (2012) and Banos-Caballero et al. (2014). In this regard, it can be argued that whilst firms with limited cash flow should strive to achieve a reduction in working capital investment so as to avoid the need for expensive external finance; on the contrary, firms with available internal cash flow should increase investment in working capital in order to improve performance. Banos-Caballero et al. (2014) conclude in their research that managers should avoid negative effects on firm performance because of additional financing expenses. Internal cash flow can be used to finance investments in working capital without the need to raise costly external finance (Autukaite and Molay, 2011). Banos-Caballero et al. (2014) examined the functional form of the relation between investment in working capital and corporate performance by taken into account financial constraint and found a convex relationship between investment in working capital and firm performance.
5
This study seeks to make a number of new contributions to the extant WCM literature on SMEs. First, the study makes a contribution by reporting the results of the effect of NWC on performance of SMEs. The available literature on the effect of WCM on firm performance almost exclusively focuses on larger firms (Baños-Caballero et al., 2014; Deloof, 2003; Hill et al., 2010; Wang, 2002), with limited empirical information on SMEs. An examination of the existing literature reveals few studies that have exclusively looked into the relationship between WCM and SMEs performance including: Garcia-Teruel and Martinez-Solano (2007), in Spain, Afeef (2011) in Pakistan, Stephen and Elvis (2011) in Kenya and Tauringana and Afrifa (2013) in the UK. This paper differs from the above mentioned studies because none of them considers the possible influence of cash flow on the relationship between WCM and firm performance.
Second, the paper investigates the impact of cash flow on the relationship between NWC and firm performance. Despite the extant research on the relationship between WCM and firm performance, only Banos-Caballero et al. (2014) have considered the possible impact that cash flow may have on this relationship. Banos-Caballero et al. (2014) investigated the financial constraints and WCM-firm performance relation by using different proxies to measure financial constraint. They reported a concave relationship between WCM and firm performance but a convex association after introducing financial conditions. The availability of cash flow may influence the association between NWC and performance because a firm with available cash flow can offer more generous credit terms to its customers (Danielson and Scott, 2000). Also, a firm with available cash flow may refuse credit period extended to it by suppliers (Baños-Caballero et al., 2014). Several researchers have suggested the lack of cash flow as a plausible explanation for the negative association between investment in working capital and firm performance (Baños-Caballero et al., 2014; García‐Teruel and Martínez‐Solano, 2007; Padachi, 2006; Padachi et al., 2011).
Third, the regression models were estimated by using panel data methodology. Panel data allows for the control of individual heterogeneity (Hsiao, 2003). This can be possible by the use of
6
either one-way or two-way analysis to control for the individual and time invariant variables, but a time-series study or a cross-section study alone cannot. Panel data also gives more informative data, more variability, more degree of freedom and more efficiency (Baltagi, 2005). Also, by combining time-series and cross-section observations, panel data can significantly increase the number of observations. Finally, panel data can be used to obtain consistent estimators in the presence of omitted variables (Wooldridge, 2002).
To systematically address these points the paper is structured as follows: In Section 2, a literature review is conducted on NWC in relation to firm performance as well as on cash flow effect on NWC and performance relationship. These provide the context for the two research hypotheses to be presented. In Section 3, the methodological process and data are presented with the empirical results and discussions shown in Section 4. Finally, the concluding remarks sums up the research in Section 5.
2 Literature Review and Hypotheses Development
2.1 Net Working capital and firm performance
The WCM of a firm has an important influence on its performance and liquidity (Aktas et al., 2014; Shin and Soenen, 1988). The particular type of strategy adopted will determine the level of investment in working capital. Typically, a firm may decide to pursue either an aggressive strategy by reducing investment in working capital or alternatively by adopting conservative working capital policy designed to increase the level of investment in working capital (García‐Teruel and Martínez‐ Solano, 2007; Tauringana and Afrifa, 2013).
An aggressive strategy of WCM will lead to reductions in both inventory holding and accounts receivable (Baños-Caballero et al., 2012; García‐Teruel and Martínez‐Solano, 2007). A reduction in inventory holding will lead to improvement in performance by minimising inventory holding costs including: warehouse storage costs, insurance costs, cost of spoilage, theft of inventory, etc. (Deloof, 2003). A reduction in accounts receivable may also increase performance
7
because it will increase the cash flow available to a firm, which can be used to run the day-to-day operations (Tauringana and Afrifa, 2013). However, a reduction in both inventories and accounts receivable may harm sales, thereby decreasing performance (Baños-Caballero et al., 2012). Wang (2002) contend that a firm may lose out on sales and profitability if inventory holding is reduced too low. An aggressive strategy of WCM may also increase performance by delaying payment to suppliers (Deloof, 2003). Tauringana and Afrifa (2013) argue that the longer a firm delays its payments to suppliers, the higher the cash flow it reserves and uses in order to improve performance. However, an attempt to demand more credit from suppliers may hinder performance as the firm may lose out on the discounts, which can exceed 20% depending on the discount rate and discount period granted (Ng et al., 1999; Wilner, 2000).
A firm can also adopt a conservative strategy of WCM which leads to an increase in investment in working capital (García‐Teruel and Martínez‐Solano, 2007). This strategy is aimed at stimulating sales by increasing both inventories and accounts receivable in order to improve performance (Baños-Caballero et al., 2012). An increase in inventories may prevent production disruptions (García‐Teruel and Martínez‐Solano, 2007), reduce the risk of stock out situation (Deloof, 2003), and reduce supply costs and price fluctuations (Blinder and Maccini, 1991). Also an increase in accounts receivable can increase sales because it allows customers time to pay (Deloof and Jegers, 1996; Long et al., 1993), reduces the information asymmetry between buyer and seller (Baños-Caballero et al., 2012). Higher accounts receivable can help customers to differentiate between products (Deloof and Jegers, 1996; Shipley and Davies, 1991), can be used as an effective price cut (Brennan et al., 1988; Petersen and Rajan, 1997), and strengthens long-term supplier/customer relationships (Wilner, 2000). However, increasing investment in working capital may result in opportunity cost of cash tied-up in inventory and accounts receivable (Tauringana and Afrifa, 2013). De Almeida and Eid Jr. (2014) find that, on average, extra cash invested in working capital is significantly less than an extra investment in cash.
8
Because of the costs and benefits associated with both the aggressive and conservative WCM strategies, there may be a concave relationship between a firm's performance and investment in working capital (Baños-Caballero et al., 2012; Baños-Caballero et al., 2014). Thus, a firm's performance is expected to increase as a result of investment in working capital up to a certain level of working capital investment, beyond which any further increases will result in reduction in performance. At a certain level of working capital investment, the higher performance will not offset the high risk borne by liquidity constraint (Smith, 1980). Banos-Caballero et al. (2014) argue that as investment in working capital increases, it is more likely that a firm will experience financial distress and face the threat of bankruptcy. Thus, a nonlinear relationship between NWC and firm performance is likely. Therefore, the study hypothesizes that:
H1:A firm’s performance and working capital relate positively at low levels of working
capital investment and negatively at higher levels.
2.2 Cash flow effect on NWC and performance relationship
The importance of cash flow to firm performance is evident from the amounts of cash that are kept by firms. For example, a research by Guney et al. (2003) found that British firms’ on average hold 10.3% of their total assets in cash allowing them to for instance pay their bills on time (Deloof, 2003). The availability of cash flow may improve performance by reducing the costs of rising outside capital (Greenwald et al., 1984). Particularly for SMEs, the benefits of cash flow to performance is high because transaction costs are relatively higher for SMEs compared to larger firms since the latter benefit from economies of scale (Tauringana and Afrifa, 2013). Cash flow also serves as a buffer against unexpected events (Opler et al., 1999). As argued by Gill and Shah (2012), cash flow availability helps firms to pay off their obligations on time. Cash flow can also help firms avoid the likelihood of financial distress, especially for firms with more volatile cash flows (Ferreira and Vilela, 2004). Belghitar and Khan (2013) indicate that market imperfections such as financial distress are more severe in SMEs.
9
The availability of cash flow has an influence on the relationship between NWC and performance of firms (Chiou et al., 2006; Fazzari et al., 1988; Fazzari and Hubbard, 1988; Fazzari and Petersen, 1993). Research has shown that availability of cash flow leads to higher investment in working capital (Baños-Caballero et al., 2014; Hill et al., 2010). Banos-Caballero et al. (2010) found in their research that whilst the cost of financing has negative effect on firms’ working capital, better access to capital markets increases the investment in working capital of firms. A study by Banos-Caballero et al. (2014) indicates that the optimal level of investment in working capital differs between firms based on their financial strength. Modiglani and Miller (1958) also argue that in a perfect capital market, working capital investment and financing decisions are independent because firms have unlimited access to sources of finance and that internal and external funds are perfect substitutes. In that situation, a higher level of working capital would have no opportunity cost because firms could obtain external finance without problems and at a reasonable price. However, because of imperfections in the capital market, internal and external financing are not perfect substitutes and that external finance may be more expensive than internal finance (Greenwald et al., 1984; Myers and Majluf, 1984).
Banos-Caballero et al. (2014) argue that despite the importance of finance to the relationship between WCM and firm performance, only few empirical researches have taken that into account. Fazzari et al. (1988) states that a firm’s working capital investment depends on financial factors such as the availability of internal finance, access to capital markets and cost of financing. This means that a firm’s investment in working capital may result in higher performance or verse versa, depending on the financial resources available. In this line of argument, Banos-Caballero et al. (2014) suggest that investment in working capital should be lower in financially constraint firms but higher in financially unconstraint firms. Moreover, Hill et al. (2010) argue that firms with greater internal financing capacity and capital market access have a higher working capital level.
10
The extant research in WCM literature suggests a negative association between NWC and performance (García‐Teruel and Martínez‐Solano, 2007; Jose, Lancaster et al., 1996; Wang, 2002), justifying this relationship on the premise of the expensive nature of financing investment in working capital (Baños-Caballero et al., 2014). Notwithstanding this argument, there is evidence of the benefits to firms’ performance from investment in working capital (Baños-Caballero et al., 2012; Hill et al., 2010). It can therefore be argued that availability of cash flow will lead to a positive relationship between NWC and firm performance. Cash flow availability will allow a firm to extend more credit to customers, which may entice them to purchase more (Lee and Stowe, 1993; Long et al., 1993), even in times of low demand (Emery, 1987). Availability of cash flow means that a firm will be able to pay suppliers upfront (Deloof, 2003). This has the advantage of improving the performance of the firm because of the cash discount to be enjoyed (Ng et al., 1999; Wilner, 2000).
Since higher investment in working capital needs to be financed (Baños-Caballero et al., 2014), one would expect firms with limited cash flow to reduce investment in working capital. Conversely, given the improvements in firms performance arising from investment in working capital (Baños-Caballero et al., 2014), it is expected that firms with available cash flow will increase investment in working capital. Therefore H2 states:
H2:Cash flow availability leads to a positive association between firm performance and
working capital at higher levels of working capital investment and negatively at lower levels.
3 Model and Data
3.1 Data: sample selection, sources and description
The data used in this study was obtained from the AMADEUS database, a commercial database provided by Bureau Van Dijk Electronic Publishing. This is a comprehensive database containing financial information on over 10 million public and private firms. The sample for the study is drawn from SMEs in the UK for the period from 2004 to 2013. Financial firms such as banks and
11
insurance were excluded because they have different accounting requirements (see, Deloof, 2003; Hill et al., 2010). Moreover, firm-years with anomalies in their accounts such as negative values in assets, sales, current assets, fixed assets were omitted (see, Hill et al., 2010). Also, firms missing substantial amount of information were excluded. Finally, all variables were winsorized at 1% (see, Garcia-Teruel and Martinez-Solano, 2007; Hill et al., 2010). The final sample of SMEs, which is based on the requirements established by the European Commission’s recommendation 2003/361/CE of 6rd May, 2003, on the definition of SMEs, therefore consists of an unbalanced
panel of 6,926 firms for which information is available. It represents 65,244 firm-year observations. Specifically, the following criteria are used for the selection of SMEs2:
Turnover less than €50 million; and
Possession of less than €43 million of total assets.
By allowing for both entry and exit, the use of an unbalanced panel partially mitigates potential selection and survivor bias. The sample firms are further separated into eight different industries based on each firm’s primary industry. Following Garcia-Teruel and Martinez-Solano (2010), the eight industries are: agricultural, mining, manufacturing, construction, wholesale trade, retail trade, services and transport and public services. This is important because research has found that significant differences exist between WCM measures across industries (Filbeck and Krueger, 2005; García‐Teruel and Martínez‐Solano, 2007; Hill et al., 2010).
3.2 Regression model specification
The following regression analysis models are specified to examine the relationship between NWC and performance. it i K t i t i t i it NWC NWC CONTROLS E PERFORMANC
6 1 1 , 2 1 , 2 2 1 , 1 0 ( ) ( ) (1)2 The average exchange rate per each year from 2014-2013 was used to convert the total assets and turnover values
12 it i K t i t i t i t i t i it CONTROLS CFLOW NWC CFLOW NWC E PERFORMANC
6 1 1 , 2 1 , 1 , 2 2 1 , 1 , 1 0 ( * ) ( * ) (2) it i K t i t i t i t i t i it CONTROLS CHOLD NWC CHOLD NWC E PERFORMANC
6 1 1 , 2 1 , 1 , 2 2 1 , 1 , 1 0 ( * ) ( * ) (3)We define all variables in Table 1 below. In Equations 1-3, all right-hand side variables are lagged by a period of one in order to alleviate the concern that NWC and firm performance may be simultaneously determined in equilibrium.
The dependent variable PERFORMANCE represents two measurements; namely return on assets (ROA) and Tobin’s Q (Q-ratio) which are used as proxies for accounting and market-based measures of financial performance respectively. The use of these two performance measures is necessary given that some of the firms in the sample are quoted on the London Stock Exchange (LSE).
Following past studies (García-Teruel et al., 2014; Martínez-Sola et al., 2014), cash flow (CFLOW) and cash holdings (CHOLD) are used as the two proxies for cash availability. Following Deloof (2003), Garcia-Teurel and Martinez-Solano (2007) and Hill et al. (2010) control variables, annual sales growth (GROWTH), firm age (AGE), firm size (SIZE), tangible fixed assets (ATAN), financial leverage (LEV) are included. The subscript denotes the firm ( , … , 6,9 6 , and the subscript t denotes the year , … , is the unobservable heterogeneity (individual effects), which is specific for each firm, and is the error term.
[Table 1 about here]
Since a non-linear equation is proposed, it is important to investigate the possibility that PERFORMACE may be a nonlinear function. Therefore, the Ramsey’s RESET test of functional misspecification is employed to detect whether there is any evidence of nonlinearity in the first place (Ramsey, 1969). To test, Equation 1 is run and the fitted values of the dependent variable
13
are saved. These are then included in Equation 1 in order to pick up any possible non-linearity. The results obtained but not reported confirm the nonlinear relationship between NWC and firm performance; hence, the need to incorporate the squared of the explanatory variable. Since panel data regression is used, the Hausman’s test is utilised to decide whether to employ the Fixed Effects (FE) model or Random Effect (RE) model by first determining whether there is a correlation between the unobservable heterogeneity of each firm and the explanatory variables of the model. The Hausman test was performed, which rejected the null hypothesis that the unobserved heterogeneity is uncorrelated with the regressors. This finding means that the RE is significantly different from the FE, and therefore the FE is more consistent and efficient method to use.
3.3 Description of sample
Filbeck and Krueger (2005) and Garcia-Teruel and Martinez-Sola (2007) argue that WCM measures significantly vary across industries. Thus, Table 2 reports the lagged values for ROA, NWC, CFLOW and CHOLD by sector of activity. The wholesale industry is the most profitable with ROA of 10%, followed by manufacturing with roughly 9% of ROA. Mining industry has a mean ROA of 8%, followed by construction and service industries with 7% of ROA apiece. The penultimate industry is agriculture and least profitable industry is transport and public services with 6% and 4% respectively. With regards to NWC, the industry with the highest NWC is wholesale with 20%, followed by mining and manufacturing with 18% apiece. The next industries with the highest NWC are construction and retail with 17% each, followed by agriculture and service industries with 14% each. The industry with the lowest NWC is transport and public services with a mean of 12%. In terms of CFLOW and CHOLD, wholesale industry firms have the highest in both with 7% and 11% respectively, construction industry firms in the sample have CFLOW and CHOLD averages of 7% and 10% respectively. Mining industry firms have means of 5% for CFLOW and 6% for CHOLD; whiles manufacturing industry has averages of 6% for both CFLOW and CHOLD. Agriculture industry has means of 3% and 4% for CFLOW and
14
CHOLD respectively; retail industry firms have averages of 2% and 4% of CFLOW and CHOLD respectively. The averages of CFLOW and CHOLD for service industry are 1% and 3% respectively. Finally, the averages of CFLOW and CHOLD for transport and public services are 0.1% and 6% respectively. Table 2 shows that differences in the means across industries are statistically significant (ANOVA test).
The results show that wholesale firms in the sample are the most profitable but they also possess the highest NWC, CFLOW and CHOLD. On the other hand, the least profitable industry in the sample is transport and public services, which also has the lowest NWC, and CFLOW. Therefore, these results support the studies by Hill et al. (2010) and Banos-Caballero et al. (2014) who found that financially less constraint firms have higher NWC.
[Table 2 about here]
Table 3 reports the descriptive statistics of the variables included in the regression analyses as a whole. ROA is on average 6.62%, while the median is 5.42%. The mean ratio of QRATIO is 1.40 (median is 0.87)3. The average NWC is 16%, which is lower than the results obtained by (Hill
et al., 2010) for larger firms but similar to a study by (Banos-Caballero et al., 2012) on SMEs, which suggests that on average larger firms have higher investments in working capital. The average GROWTH is 8.7% with a median of 5.5%. Mean CFLOW is 4%, and the average CHOLD is 6%. The mean AGE is about 19 years. Mean and median SIZEs are £9.66M and £7.81M, respectively. The sampled firms’ ATAN is 28.66%, with median of 18.80%. The ATAN average of 29% shows that the majority of the firms have less assets in the form of fixed assets, which is very common in SMEs who tend to have more current assets than fixed assets (see, Padachi, 2006; Garcia-Teruel and Martinez-Solano, 2007; Padachi et al., 2008). The mean and median LEV is 23.62% and 19.11% respectively.
[Table 3 about here]
3 The firm-year observation for QRATIO is lower than all the observations of the other variables. This is because
the QRATIO is used in a separate regression to examine the NWC-performance relationship for only quoted firms in the sample.
15
3.4 Correlation analysis
Table 4 contains the correlation matrix for the variables included to test for multicollinearity. The correlation result indicates a significant and positive association between ROA and QRATIO at the 1% level. The correlation between ROA and NWC is negative and significant at the 1% level, similar to the results by Deloof (2003) and Garcia-Teruel and Martinez-Solano (2007). GROWTH and ROA is positive and significantly correlated at the 1% level. The correlation between CFLOW and ROA is positive at the 1% level of significance. CHOLD and ROA are positively correlated at the 1% level of significance. Finally, the correlations among the independent variables suggest that multicollinearity should not be a problem in the panel data regression analysis, since the coefficient values are well below the 0.80 limit prescribed by Field (2005).
However, Myers (1990) argues that a certain degree of multicollinearity can still exist even when none of the correlation coefficients are very large. Therefore, the variance inflation factors (VIFs) were examined in all models to further test for multicollinearity and all were well below the threshold value of 10 suggested by Field (2005) indicating that multicollinearity does not pose a problem in the regressions.
[Table 4 about here]
4 Empirical Results
4.1 Regression Analysis Results and Discussion 4.1.1 Effects of working capital investment on performance (ROA)
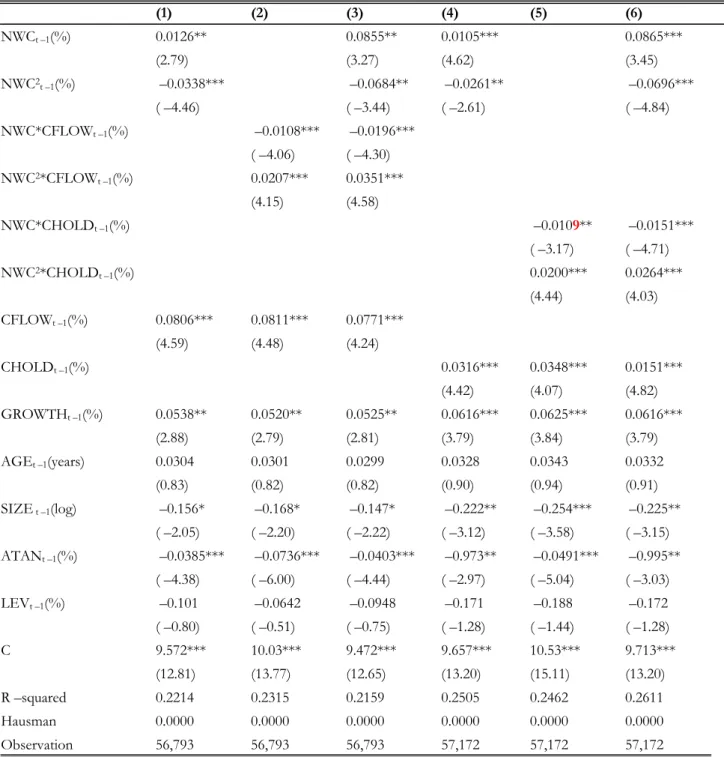
In Table 5, columns 1 to 3 contain results of the estimation involving CFLOW, whilst columns 4 to 6 involve CHOLD. The results contained in columns 1 and 4 show a concave relationship between NWC and ROA, since the coefficients in columns 1 and 4 for the NWC are (0.0126) and (0.0105) and significant at the 5% and 1% levels respectively , and that for NWC2 are (–
16
0.0338) and (–0.0261) and significant at the 1% and 5% levels respectively4 . This is
consistent with results found by (Banos-Caballero et al., 2014) and supports H1. These findings
indicate that there is an optimal level of NWC which maximises performance (Banos-Caballero et al., 2012), and that NWC below the optimal level will increase performance. Contrariwise, NWC above the optimal level causes a reduction in firm performance. The coefficients of NWC and NWC2 help to determine the reflection points. The reflections points in columns 1 and 4 are 18.6%
and 20% respectively, which is similar to the 66.95 days ((66.95 days * 100)/365 = 18.34 %) results obtained by Banos-Caballero et al. (2014).
[Table 5 about here]
4.1.2 Cash flow effect on working capital investment on performance (ROA)
Researchers such as Hill et al. (2010) and Banos-Caballero et al. (2014) indicate that the availability of cash flow leads to higher investment in working capital. Moreover, a research by Fazzari and Petersen (1993) found that investment in working capital is sensitive to cash flow. Therefore, this section examines the possible influence of cash flow availability measured by CFLOW and CHOLD on the relationship between NWC and performance. The results of the interaction of NWC with CFLOW and CHOLD are contained in columns 2 and 5 of Table 5. The results show a convex relationship of ROA with NWC*CFLOW and NWC*CHOLD, since the coefficients of NWC*CFLOW (–0.0108) and NWC*CHOLD (–0.0108) in columns 2 and 5 respectively are negative and significant at the 1% and 5% respectively , and that for NWC2*CFLOW
(0.0207) and NWC2*CHOLD (0.0200) are positive and significant at the 1% level
apiece5. These results support H
2, and shed some light on the influence of cash flow on
NWC-performance relationship.
4Concave relationships between ROA and each individual component of NWC (inventories to sales ratio, accounts
receivable to sales ratio and accounts payable to sales ratio) were also obtained.
5 Convex relationship between ROA and each individual component of NWC (inventories to sales ratio, accounts
17
The result also shows that with the availability of cash flow, lower level of NWC adversely affects performance, whilst higher level will positively influences performance (Banos-Caballero et al., 2014). This result also shows that firms lacking cash flow have lower optimal level of working capital (Chiou et al., 2006). The results of a higher investment in working capital as a result of the availability of cash flow is consistent with studies by Fazzari and Petersen (1993), Chiou et al. (2006), Banos-Caballero et al. (2014) and Hill et al. (2010).
Columns 3 and 6 contain the results from including NWC, its square and the interactive variables in one regression. Like the other columns, the concave relationship between NWC and ROA and convex association of NWC*CFLOW and NWC*CHOLD with ROA still hold.
4.1.3 Effects of working capital investment on performance (QRATIO)
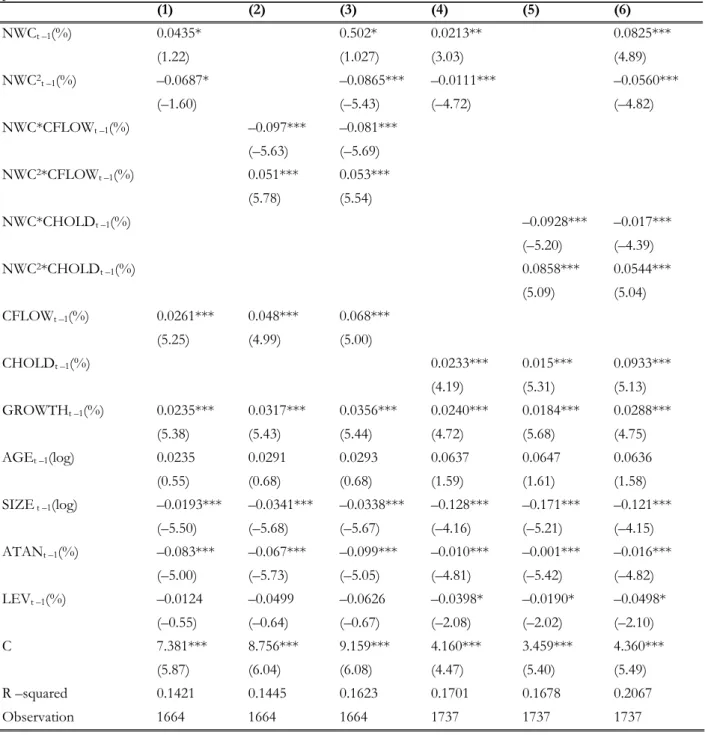
Ntim (2009) argue that market-based performance measure is best suited for quoted firms, therefore, in this section; the QRATIO is employed to examine the relationship with NWC for the performance of quoted firms in the sample6. The results are contained in Table 6, and once
again columns 1 to 3 involve CFLOW, whilst 4 to 6 involve CHOLD. Consistent with the ROA measure of firm performance in Table 5, the results contained in columns 1 and 4 show concave relationships between NWC and QRATIO, since the coefficient of NWC2 is negative and
significant at the 10% and 5% respectively. In terms of the interaction effects of cash flow the result shows a convex relationship, since the coefficients of NWC*CFLOW and NWC*CHOLD are negative and significant at the 1% apiece; whilst the coefficients of NWC2*CFLOW and
NWC2*CHOLD are positive and significant at the 1% in both columns. Columns 3 and 6 contain
the results from including NWC, its square and the interactive variables in one regression. Like the other columns, the concave relationship between NWC and QRATIO and convex association of NWC*CFLOW and NWC*CHOLD with QRATIO still hold.
6 Banos-Caballero et al. (2012) used QRATIO when they investigated the NWC-performance relationship for quoted
18
[Table 6 about here]
4.1.4 Effects of working capital investment and performance (ROA) across industries
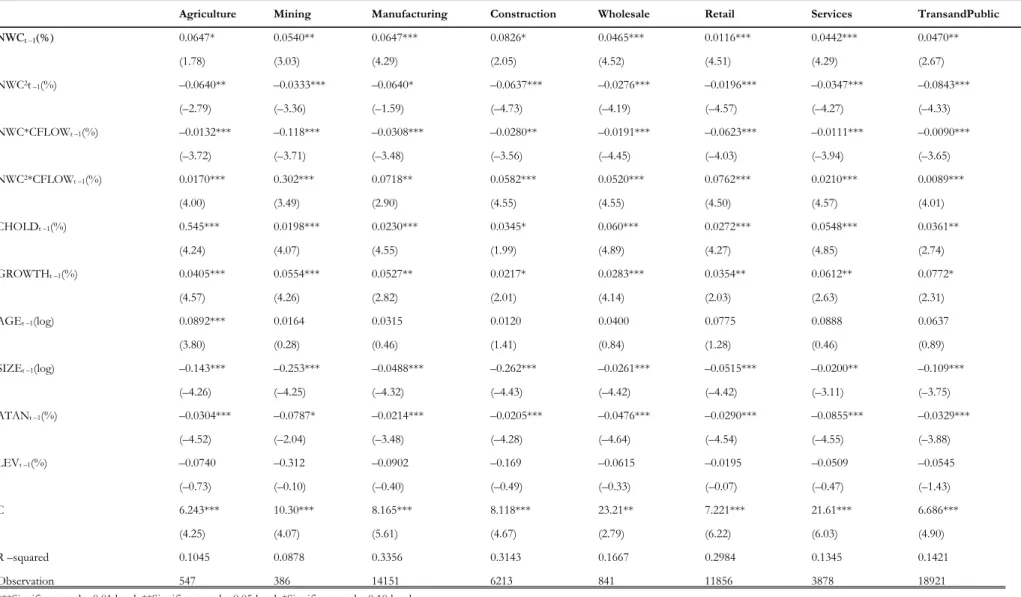
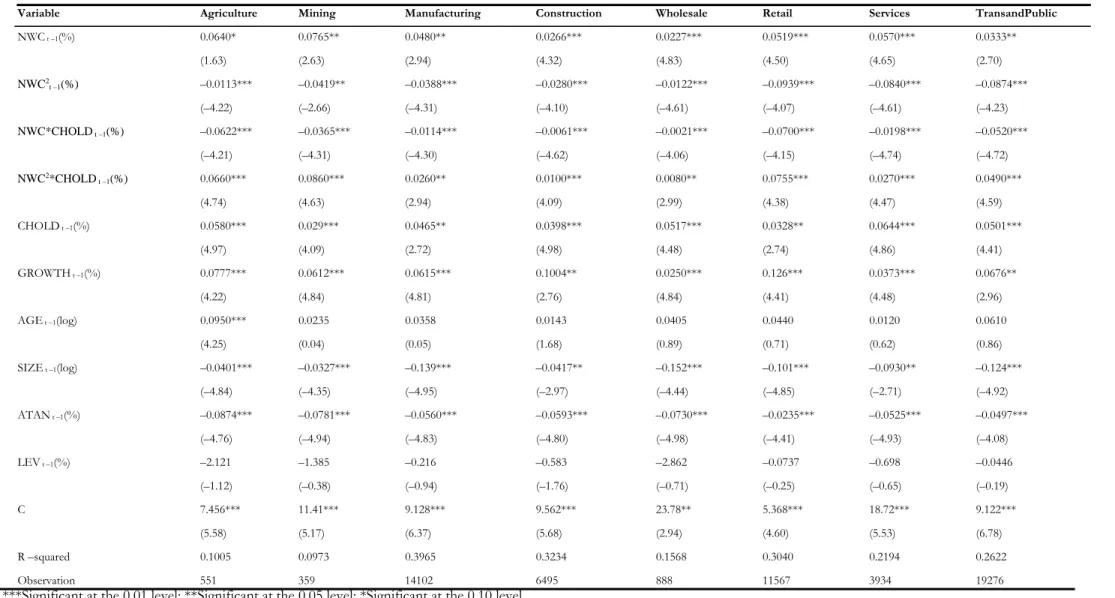
In this section, the NWC-performance including the interaction effects of cash flow is examined across all eight industries, similar to the approach by Banos-Caballero et al. (2012). Ohman (2014) empirically examined the relationship between investment in working capital and firm performance and found a negative association across all industries, whilst Banos-Caballero (2012) found a concave relationship7. Consistent with Ohman (2014) the ANOVA test performed in
Table 2 indicates significant differences of NWC across industries. Table 7 contains the results of NWC-performance relationship and the interaction effects of CFLOW, whilst Table 8 examines the interaction effects of CHOLD.
[Table 7 about here] [Table 8 about here]
Evident from Tables 7 and 8, a concave relationship between NWC and performance is observed across all eight industries. However, the introduction of the interacting effects of cash flow results in a convex relationship. These results suggest that despite the differences in NWC across industries (Ohman, 2014; Garcia-Teruel and Martinez-Solano, 2007), the outcome with performance is the same and that in the absence of cash flow, a firm should seek to reduce investment in working capital regardless of the industry it belongs. On the contrary, a firm with availability of cash flow, regardless of the industry should seek to improve performance by increasing investment in working capital. In terms of the optimal levels of working capital investment, the reflection points based on Table 7 ranges from 9% for transport and public industry to 33% for wholesale industry. The reflection points based on Table 8 ranges from 7% for transport and public industry to 35% for wholesale industry.
19
The trends of the reflection points of the coefficients for NWC in Tables 7 and 8 clearly show that despite the similar pattern of results across industries, the optimal points at which working capital investments affect performance varies considerably. This result suggests that working capital investment issues are industry specific (Hill et al., 2010; Ohman, 2014) and that investment in working capital affects performance differently for firms in different industries.
4.2 Robustness test
The robustness of the main findings is assessed by carrying out two additional analyses. First, following the procedure by Banos-Caballero et al. (2014), in Equations 2 and 3 above, CFLOW and CHOLD are replaced with variables DCFLOW and DCHOLD that distinguishes between firms more likely to face cash flow problems and those that are less likely. DCFLOW and DCHOLD are dummy variables that take the value of 1 for more financially constrained and 0 otherwise. A firm is considered to be facing cash flow problems if that firm’s CFLOW and CHOLD are below the respective median values, similar to Banos-Caballero et al. (2014). Since a higher level of working capital investment needs financing, it is expected that firms that are faced with cash flow problems are likely to have lower levels of working capital investment. The results in Table 9, columns 1 and 2 confirm that firms with cash flow problems have lower levels of working capital investment, which is consistent with the findings by Banos-Caballero et al. (2014). Even though the concave relationship still exists, the presence of cash flow conditions shows a convex relationship. In support of the findings above, this result indicate that the optimal level of working capital investment is lower for those firms that have lower cash flow and higher for firms with higher cash flow.
[Table 9 about here]
Second, the non-linear relationship between NWC and performance is tested for periods before the recession, during the recession and after the recession. This is important since the firms and variables used in this study could be affected by the financial crisis that started as a sub-prime
20
crisis in 2007 but unfolded into recession in 2009. Therefore, the sample years are partitioned into three: pre-recession period is for 2004-2007; in-recession period is for 2008-20108; and
post-recession period is for 2011-2013. Columns 1 to 3 of Table 10 incorporate the interaction effects of CFLOW; whilst columns 4 to 6 include the interaction effects of CHOLD. The results show that the non-linear relationship between NWC and performance exist across different economic conditions, since the coefficients of NWC and NWC2 are significantly positive and negative
respectively across columns 1 to 6; and conversely the coefficients of NWC*CFLOW and NWC*CHOLD are negative but that of NWC2*CFLOW and NWC2*CHOLD are positive.
[Table 10 about here] 5 Conclusions
The paper provides empirical evidence and assessment of the relationship between NWC and performance by taking cash flow into consideration. The study is based on an unbalanced panel data of 6,926 SMEs in the UK over a ten year period (2004-2013). The results show that NWC relationship to performance is concave, however, after taking into consideration the interaction effects of the availability of cash flow the relationship becomes convex. This indicates the importance of cash flow to firms’ WCM policies. The results highlight the fact that in the event of cash flow unavailability firms should strive to reduce the investment in working capital. On the other hand, it supports the notion that firms with available cash flow should increase investment in working capital in order to improve performance. This study justifies the assertion that internally generated funds impact on firms’ working capital decisions.
The results also hold when the QRATIO is used as a measure of market-based performance for quoted SMEs in the sample, which indicate that quoted firms can improve their shareholders' value by observing the optimal level of working capital investment at which performance is improved and taking into consideration cash flow. The results garnered from
21
running separate regressions for all eight industries also confirm a concave relationship between NWC and performance and a convex relationship when the interaction effects of cash flow is considered. The results from partitioning the total sample according to cash flow and economic conditions of firms further provide evidence of the importance of cash flow to the relationship between NWC and performance.
Reference
Afeef, M. (2011). “Analyzing the Impact of Working Capital Management on the Profitability of SME’s in Pakistan”, International Journal of Business and Social Science, 2(22), 175 – 183. Aktas, N., Croci, E. and Petmezas, D. (2014). “Is working capital management value-enhancing?
Evidence from firm performance and investments”, Journal of Corporate Finance(0), Forthcoming. doi: http://dx.doi.org/10.1016/j.jcorpfin.2014.12.008
Autukaite, R. and Molay, E. (2011). “Cash holdings, working capital and firm value: Evidence from France. Paper presented at the International Conference of the French Finance Association (AFFI), May. Baltagi, B. H. (2005). “ Econometric Analysis of Panel Data (3rd ed.). “ New York: John.
Baños-Caballero, S., García-Teruel, P. and Martínez-Solano, P. (2012). “How does working capital management affect the profitability of Spanish SMEs?”, Small Business Economics, 39(2), 517-529.
Baños-Caballero, S., García-Teruel, P. J. and Martínez-Solano, P. (2010). “Working capital management in SMEs”, Accounting and Finance, 50(3), 511-527.
Baños-Caballero, S., García-Teruel, P. J. and Martínez-Solano, P. (2014). “Working capital management, corporate performance and financial constraints”, Journal of Business Research, 67(3), 332-338.
Belghitar, Y. and Khan, J. (2013). “Governance mechanisms, investment opportunity set and SMEs cash holdings”, Small Business Economics, 40(1), 59-72.
Blinder, A. S. and Maccini, L. J. (1991). “The Resurgence of Inventory Research: What Have We Learned? ”, Journal of Economic Surveys, 5(4), 291-328.
Brennan, M. J., Maksimovics, V. and Zechner, J. (1988). “Vendor Financing”, The Journal of Finance, 43(5), 1127-1141.
Chiou, J. R., Cheng, L. and Wu, H. W. (2006). “The determinants of working capital management”,
22
Danielson, M. and Scott, J. (2000). “Additional Evidence on the Use of Trade Credit by Small Firms: The Role of Trade Credit Discounts”, Working Paper, SSRN Electronic Library. De Almeida, J. R. and Eid Jr, W. (2014). “Access to finance, working capital management and
company value: Evidences from Brazilian companies listed on BMandamp; FBOVESPA”,
Journal of Business Research, 67(5), 924-934.
Deloof, M. (2003). “Does Working Capital Management Affect Profitability of Belgian Firms?”,
Journal of Business Finance and Accounting, 30(3-4), 573-588.
Deloof, M. and Jegers, M. (1996). “Trade Credit, Product Quality and Intragroup Trade: Some European Evidence”, Financial Management, 25(3), 33-43.
Emery, G. W. (1987). “An Optimal Financial Response to Variable Demand”, The Journal of
Financial and Quantitative Analysis, 22(2), 209-225.
Faulkender, M. and Wang, R. (2006). “Corporate Financial Policy and the Value of Cash”, The
Journal of Finance, 61(4), 1957-1990.
Fazzari, S., Hubbard, R. G. and Petersen, B. (1988). “Financing Constraints and Corporate Investment”, Brookings Papers on Economic Activity, 1, 141-195.
Fazzari, S. and Petersen, B. (1993). “Working Capital and Fixed Investment: New Evidence on Financing Constrains”, RAND Journal of Economics, 24, 328-342.
Ferreira, M. A. and Vilela, A. S. (2004). “Why Do Firms Hold Cash? Evidence from EMU Countries”, European Financial Management, 10(2), 295-319.
Filbeck, G. and Krueger, T. M. (2005). “An Analysis of Working Capital Management Results Across Industries”, American Journal of Business, 20(2), 11-20.
Ganesan, V. (2007). “An analysis of working capital management efficiency in telecommunication equipment industry”, River Academic Journal, 3(2), 1-10.
García-Teruel, P. J., Martínez-Solano, P. and Sánchez-Ballesta, J.P. (2014). “Supplier Financing and Earnings Quality”, Journal of Business Finance and Accounting, n/a-n/a. doi: 10.1111/jbfa.12090
García‐Teruel, P. J. and Martínez‐Solano, P. (2007). “Effects of working capital management on SME profitability”, International Journal of Managerial Finance, 3(2), 164-177.
Gill, A. and Shah, C. (2012). “Determinants of corporate cash holdings: Evidence from Canada”,
International Journal of Economics and Finance, 4(1), 70-79.
Greenwald, B., Stiglitz, J. E. and Weiss, A. (1984). “Informational Imperfections in the Capital Market and Macroeconomic Fluctuations”, The American Economic Review, 74(2), 194-199. Guney, Y., Ozkan, A. and Ozkan, N. (2003). “Additional international evidence on corporate cash
23
Hill, M.D., Kelly, G.W. and Highfield, M. J. (2010). “Net Operating Working Capital Behavior: A First Look”, Financial Management, 39(2), 783-805.
Hsiao, C. (2003). Analysis of Panel Data (2nd edn. ed.). Cambridge: Cambridge University Press. Jose, M., Lancaster, C. and Stevens, J. (1996). “Corporate returns and cash conversion cycles”,
Journal of Economics and Finance, 20(1), 33-46.
Kieschnick, R. L., Laplante, M. and Moussawi, R. (2011). “Working Capital Management and Shareholder Wealth. Working Paper, SSRN Electronic Library, SSRN-ID: 1431165.
Lee, Y. W. and Stowe, J. D. (1993). “Product Risk, Asymmetric Information and Trade Credit”,
The Journal of Financial and Quantitative Analysis, 28(2), 285-300.
Long, M., Malitz, I. and Ravid, S. (1993). “Trade Credit, Quality Guarantees and Product Marketability”, Financial Magement, 22(4), 117-127.
Mantecon, T. (2008). “An analysis of the implications of uncertainty and agency problems on the wealth effects to acquirers of private firms”, Journal of Banking and Finance, 32(5), 892-905. Martínez-Sola, C., García-Teruel, P. and Martínez-Solano, P. (2014). “Trade credit and SME
profitability”, Small Business Economics, 42(3), 561-577.
Modigliani, F. and Merton, H. M. (1958). “The Cost of Capital, Corporation Finance and the Theory of Investment”, The American Economic Review, 48(3), 261-297.
Myers, S. C. and Majluf, N. S. (1984). “Corporate financing and investment decisions when firms have information that investors do not have”, Journal of Financial Economics, 13(2), 187-221. Nazir, M. S. and Afza, T. (2009). “Impact of aggressive working capital management policy on
firms’ profitability”, The IUP Journal of Applied Finance, 15(8), 19-30.
Ng, C. K., Smith, J. K. and Smith, R. L. (1999). “Evidence on the Determinants of Credit Terms Used in Interfirm Trade”, The Journal of Finance, 54(3), 1109-1129.
Opler, T., Pinkowitz, L., Stulz, R. and Williamson, R. (1999). “The determinants and implications of corporate cash holdings”, Journal of Financial Economics, 52(1), 3-46.
Padachi, K. (2006). “Trends in working capital management and its impact on firms performance: an analysis of Mauritian small manufacturing firms”, International Review of Business Research
Papers, 22, 45-58.
Padachi, K., Howorth, C. and Narasimhan, M.S. (2011). “Working Capital Financing Preferences: The
Case of Mauritian Manufacturing SMEs”, Paper presented at the Cambridge Business and
Economics Conference, London: Cambridge.
Peel, M. J. and Wilson, N. (1996). “Working Capital and Financial Management Practices in the Small Firm Sector”, International Small Business Journal, 14(2), 52-68.
24
Petersen, M.A. and Rajan, R.G. (1997). “Trade credit: theories and evidence”, Review of Financial
Studies, 10(3), 661-691.
Ramsey, J. B. (1969). “Tests for Specification Errors in Classical Linear Least-Squares Regression Analysis”, Journal of the Royal Statistical Society. Series B (Methodological), 31(2), 350-371. Shin, H. and Soenen, L. (1988). “Efficiency of working capital and corporate profitability”,
Financial Practice and Education, 8(2), 37-45.
Shipley, D. and Davies, L. (1991). “The Role and Burden-Allocation of Credit in Distribution Channels”, Journal of Marketing Channels, 1(1), 3-22.
Smith, K. (1980). “ Profitability versus liquidity tradeoffs in working capital management. In K.V. Smith (Ed.): West Publishing Company.
Soenen, L. A. (1993). “Cash conversion cycle and corporate profitability”, Journal of Cash
Management, 134, 53-58.
Stephen, M. and Elvis, K. (2011). “Influence of Working Capital Management on Firms Profitability: A Case of SMEs in Kenya”, International Business Management, 5(5), 279-286. Tauringana, V. and Afrifa, G.A. (2013). “ The relative importance of working capital management
and its components to SMEs' profitability”, Journal of Small Business and Enterprise
Development, 20(3), 453-469.
VanHorne, J. C. and Wachowiez, J. M. (2001). “Fundamentals of Financial Management (11th edn. ed.). New York: Prentice Hall Inc.
Wang, Y.-J. (2002). “Liquidity management, operating performance and corporate value: evidence from Japan and Taiwan”, Journal of Multinational Financial Management, 12(2), 159-169. Whited, T. M. (1992). “Debt, Liquidity Constraints and Corporate Investment: Evidence from
Panel Data”, The Journal of Finance, 47(4), 1425-1460.
Wilner, B. S. (2000). “The Exploitation of Relationships in Financial Distress: The Case of Trade Credit”, The Journal of Finance, 55(1), 153-178.
25
Net Working Capital, Cash Flow and Performance of UK SMEs Dependent variable Acronym Description
Return on total assets ROA
Earnings before interest and tax (EBIT) as a percentage of total assets
Tobin's Q ratio QRATIO
Ratio of market value of equity plus the book value of total assets minus the book value of equity divided by the book value of total assets
Net Working Capital NWC
(Inventories/sales) plus (accounts receivable/sales) minus (accounts payable/sales) multiplied by 100
Annual Sales Growth GROWTH
percentage change in sales revenue over the previous year
Operating Cash Flow CFLOW
Operating income before depreciation and amortisation minus interest expense and income tax expense scaled by net assets (total assets minus current liabilities).
Cash Holdings CHOLD
Cash and cash equivalents as a percentage of net assets (total assets minus cash and short-term investments)
Firm Age AGE
Number of years between incorporation and the calendar year end of each firm
Firm Size SIZE Value of firms total assets in British pounds sterling Tangible Fixed Assets ATAN Fixed assets as a percentage of total assets
26
Table 2. Industry Distribution of Sample
The table provides the distribution of the sample across industries for 65,244 firm–years across 6,926 unique UK SMEs over the period 2004-2013. Industry classifications follow Garcia-Teruel and Martinez-Solano (2007) indsutry classification system. ROA is the earnings before interest, tax and depreciation as a percentage of total assets. NWC is inventories plus receivables minus payables as a percentage of sales revenue. CFLOW is operating income before depreciation and amortisation minus interest expense and income tax expense scaled by net assets. CHOLD is the cash and cash equivalents
as a percentage of net assets. ANOVA (F) is the significant variance of ROA, NWC, CFLOW, CHOLD across industries
at 0.01 significant level.
INDUSTRY ROA t –1(%) NWCt –1(%) CFLOW t –1(%) CHOLD t –1(%)
AGRICULTURE Mean 5.5080 13.8862 3.2418 4.1545 Std. Dev. 3.2057 16.0163 7.2332 4.4491 MINING Mean 7.7675 18.4528 5.0720 6.4496 Std. Dev. 4.4351 18.9206 8.1812 9.1348 MANUFACTURING Mean 9.1740 17.9935 6.4018 6.1810 Std. Dev. 8.3709 16.8574 5.1948 9.1253 CONSTRUCTION Mean 7.0035 16.9410 6.8728 9.9869 Std. Dev. 4.5744 13.2720 4.3064 8.3782 WHOLESALE Mean 9.9094 19.6778 7.4827 11.9883 Std. Dev. 8.0882 14.4476 7.1760 16.3430 RETAIL Mean 6.5338 17.0312 2.4869 3.6869 Std. Dev. 3.7341 13.2249 3.4843 4.7042 SERVICES Mean 7.0331 14.1071 1.2821 2.8609 Std. Dev. 2.6285 35.1850 3.3011 1.7788 TRANSPORT AND PUBLIC Mean 3.8424 11.8334 0.1499 5.6765 Std. Dev. 2.0998 10.4456 1.8850 9.0228 ANOVA 0.0000 0.0000 0.0000 0.0000
27 Table 3. Descriptive Statistics
The table provides the sample characteristics of 65,244 firm-years across 6,926 unique UK SMEs over the period 2004-2013. ROA is the earnings before interest, tax and depreciation as a percentage of total assets. QRATIO is the ratio of market value of equity plus the book value of total assets minus the book value of equity divided by the book value of total assets. NWC is inventories plus receivables minus payables as a percentage of sales revenue. CFLOW is operating income before depreciation and amortisation minus interest expense and income tax expense scaled by net assets. CHOLD is the cash and cash equivalents as a percentage of net assets. GROWTH is the percentage chagne in sales revenue over the previous year. AGE is the number of years between incorporation and the calendar year end of each firm. SIZE is the value of firms total assets in British pounds sterling. ATAN is the fixed assets as a percentage of total assets. LEV is the debt as a percentage of total assets.
Variables Obs. Mean Std Dev perc 25 Median perc 75 ROA(%) 61,909 6.6162 4.6421 0.5940 5.4170 13.3400 QRATIO(ratio) 2,193 1.4038 1.3894 0.3653 0.8729 1.8255 NWCt –1(%) 65,244 16.2404 15.9905 –1.4417 4.6197 68.0742 GROWTHt –1(%) 60,998 8.7019 4.9203 –4.9380 5.4976 18.1334 CFLOWt –1(%) 60,872 4.1240 5.0953 2.5890 5.6007 10.7109 CHOLDt –1(%) 61,017 6.3731 7.8670 0.7782 1.1728 19.3597 AGEt –1(years) 65,244 19.7171 21.0201 6.0603 12.9260 45.4932 SIZEt –1(£M) 65,244 9.6600 6.6500 4.4400 7.8100 13.8500 ATANt –1(%) 59,972 28.6610 28.6943 4.1424 18.8020 46.3855 LEVt –1(%) 61,912 23.6234 9.6959 0.8201 19.0722 73.9517
28 Table 4. Pearson Correlation Coefficients
The table provides Pearson correlation coefficients for the 65,244 firm-years across 6,926 unique UK SMEs over the period 2004-2013. ROA is the earnings before interest, tax and depreciation as a percentage of total assets. QRATIO is the ratio of market value of equity plus the book value of total assets minus the book value of equity divided by the book value of total assets. NWC is inventories plus receivables minus payables as a percentage of sales revenue. CFLOW is operating income before depreciation and amortisation minus interest expense and income tax expense scaled by net assets. CHOLD is the cash and cash equivalents as a percentage of net assets. GROWTH is the percentage chagne in sales revenue over the previous year. AGE is the natural log of the years between incorporation and the calendar year end of each firm. SIZE is the natural log of firms total assets. ATAN is the fixed assets as a percentage of total assets. LEV is the debt as a percentage of total assets. p –values are below coefficients.
Variables ROA QRATIO NWC CFLOW CHOLD GROWTH AGE SIZE ATAN LEV
ROA (%) 1.00 QRATIO (ratio) 0.02 1.00 NWCt –1(%) 0.00 –0.09 –0.10 1.00 0.00 0.00 CFLOWt –1 (%) 0.22 0.23 0.01 1.00 0.00 0.00 0.00 CHOLDt –1(%) 0.15 0.17 0.03 1.00 1.00 0.00 0.00 0.00 0.01 GROWTHt –1(%) 0.33 0.29 0.11 –0.08 –0.32 1.00 0.00 0.00 0.00 0.00 0.01 AGEt –1(years) 0.00 0.29 –0.05 –0.09 –0.02 –0.02 1.00 0.13 0.01 0.06 0.02 0.34 0.39 SIZEt –1(%) –0.04 –0.06 –0.00 –0.07 –0.04 –0.12 0.02 1.00 0.00 0.00 0.36 0.00 0.14 0.00 0.00 ATANt –1(%) –0.14 –0.31 –0.09 –0.22 –0.03 –0.32 –0.10 0.33 1.00 0.00 0.00 0.00 0.00 0.28 0.00 0.00 0.00 LEVt –1(%) –0.14 –0.25 –0.13 –0.12 –0.02 0.00 –0.04 –0.06 0.00 1.00 0.00 0.00 0.00 0.00 0.00 0.10 0.20 0.02 0.73
29
Table 5. Return on Assets, Cash Availability and Net Working Capital
This table presents firm fixed effects regression with ROA as the dependent variable. ROA is the earnings before interest, tax and depreciation as a percentage of total assets. NWC is inventories plus receivables minus payables as a percentage of sales revenue. CFLOW is operating income before depreciation and amortisation minus interest expense and income tax expense scaled by net assets. CHOLD is the cash and cash equivalents as a percentage of net assets. GROWTH is the percentage change in sales revenue over the previous year. AGE is the natural log of the years between incorporation and the calendar year end of each firm. SIZE is the natural log of firms total assets. ATAN is the finxed assets as a percentage of total assets. LEV is the debt as a percentage of total assets. The sample consists of 65,244 firm-years across 6,926 unique UK
SMEs over the period 2004-2013. t–values are in parentheses below coefficients.
(1) (2) (3) (4) (5) (6) NWCt –1(%) 0.0126** 0.0855** 0.0105*** 0.0865*** (2.79) (3.27) (4.62) (3.45) NWC2t –1(%) –0.0338*** –0.0684** –0.0261** –0.0696*** ( –4.46) ( –3.44) ( –2.61) ( –4.84) NWC*CFLOWt –1(%) –0.0108*** –0.0196*** ( –4.06) ( –4.30) NWC2*CFLOWt –1(%) 0.0207*** 0.0351*** (4.15) (4.58) NWC*CHOLDt –1(%) –0.0109** –0.0151*** ( –3.17) ( –4.71) NWC2*CHOLDt –1(%) 0.0200*** 0.0264*** (4.44) (4.03) CFLOWt –1(%) 0.0806*** 0.0811*** 0.0771*** (4.59) (4.48) (4.24) CHOLDt –1(%) 0.0316*** 0.0348*** 0.0151*** (4.42) (4.07) (4.82) GROWTHt –1(%) 0.0538** 0.0520** 0.0525** 0.0616*** 0.0625*** 0.0616*** (2.88) (2.79) (2.81) (3.79) (3.84) (3.79) AGEt –1(years) 0.0304 0.0301 0.0299 0.0328 0.0343 0.0332 (0.83) (0.82) (0.82) (0.90) (0.94) (0.91) SIZE t –1(log) –0.156* –0.168* –0.147* –0.222** –0.254*** –0.225** ( –2.05) ( –2.20) ( –2.22) ( –3.12) ( –3.58) ( –3.15) ATANt –1(%) –0.0385*** –0.0736*** –0.0403*** –0.973** –0.0491*** –0.995** ( –4.38) ( –6.00) ( –4.44) ( –2.97) ( –5.04) ( –3.03) LEVt –1(%) –0.101 –0.0642 –0.0948 –0.171 –0.188 –0.172 ( –0.80) ( –0.51) ( –0.75) ( –1.28) ( –1.44) ( –1.28) C 9.572*** 10.03*** 9.472*** 9.657*** 10.53*** 9.713*** (12.81) (13.77) (12.65) (13.20) (15.11) (13.20) R –squared 0.2214 0.2315 0.2159 0.2505 0.2462 0.2611 Hausman 0.0000 0.0000 0.0000 0.0000 0.0000 0.0000 Observation 56,793 56,793 56,793 57,172 57,172 57,172
30
Table 6. Tobin's Q Ratio, Cash Availabilty and Net Working Capital
This table presents firm fixed effects regression with QRATIO as the dependent variable. QRATIO is the ratio of market value of equity plus the book value of total assets minus the book value of equity divided by the book value of total assets. NWC is inventories plus receivables minus payables as a percentage of sales revenue. CFLOW is operating income before depreciation and amortisation minus interest expense and income tax expense scaled by net assets. CHOLD is the cash and cash equivalents as a percentage of net assets. GROWTH is the percentage chagne in sales revenue over the previous year. AGE is the natural log of the years between incorporation and the calendar year end of each firm. SIZE is the natural log of firms total assets. ATAN is the finxed assets as a percentage of total assets. LEV is the debt as a percentage of total
assets. The sample consists of 65,244 firm-years across 6,926 unique UK SMEs over the period 2004-2013. t-values are in
parentheses below coefficients.
(1) (2) (3) (4) (5) (6) NWCt –1(%) 0.0435* 0.502* 0.0213** 0.0825*** (1.22) (1.027) (3.03) (4.89) NWC2t –1(%) –0.0687* –0.0865*** –0.0111*** –0.0560*** (–1.60) (–5.43) (–4.72) (–4.82) NWC*CFLOWt –1(%) –0.097*** –0.081*** (–5.63) (–5.69) NWC2*CFLOW t –1(%) 0.051*** 0.053*** (5.78) (5.54) NWC*CHOLDt –1(%) –0.0928*** –0.017*** (–5.20) (–4.39) NWC2*CHOLDt –1(%) 0.0858*** 0.0544*** (5.09) (5.04) CFLOWt –1(%) 0.0261*** 0.048*** 0.068*** (5.25) (4.99) (5.00) CHOLDt –1(%) 0.0233*** 0.015*** 0.0933*** (4.19) (5.31) (5.13) GROWTHt –1(%) 0.0235*** 0.0317*** 0.0356*** 0.0240*** 0.0184*** 0.0288*** (5.38) (5.43) (5.44) (4.72) (5.68) (4.75) AGEt –1(log) 0.0235 0.0291 0.0293 0.0637 0.0647 0.0636 (0.55) (0.68) (0.68) (1.59) (1.61) (1.58) SIZE t –1(log) –0.0193*** –0.0341*** –0.0338*** –0.128*** –0.171*** –0.121*** (–5.50) (–5.68) (–5.67) (–4.16) (–5.21) (–4.15) ATANt –1(%) –0.083*** –0.067*** –0.099*** –0.010*** –0.001*** –0.016*** (–5.00) (–5.73) (–5.05) (–4.81) (–5.42) (–4.82) LEVt –1(%) –0.0124 –0.0499 –0.0626 –0.0398* –0.0190* –0.0498* (–0.55) (–0.64) (–0.67) (–2.08) (–2.02) (–2.10) C 7.381*** 8.756*** 9.159*** 4.160*** 3.459*** 4.360*** (5.87) (6.04) (6.08) (4.47) (5.40) (5.49) R –squared 0.1421 0.1445 0.1623 0.1701 0.1678 0.2067 Observation 1664 1664 1664 1737 1737 1737
31 Table 7. Return on Assets, Cash Flow and Net Working Capital: Conditional on Industry Classification
This table presents firm fixed effects regression with ROA as the dependent variable. ROA is the earnings before interest, tax and depreciation as a percentage of total assets. NWC is inventories plus receivables minus payables as a percentage of sales revenue. CFLOW is operating income before depreciation and amortisation minus interest expense and income tax expense scaled by net assets. CHOLD is the cash and cash equivalents as a percentage of net assets. GROWTH is the percentage chagne in sales revenue over the previous year. AGE is the natural log of the years between incorporation and the calendar year end of each firm. SIZE is the natural log of firms total assets. ATAN is the finxed assets as a percentage of total assets. LEV is the debt as a percentage of total assets. The sample consists of 65,244 firm-years across 6,926 unique UK SMEs over the period 2004-2013. t-values are in parentheses below coefficients.
Agriculture Mining Manufacturing Construction Wholesale Retail Services TransandPublic
NWCt –1(%) 0.0647* 0.0540** 0.0647*** 0.0826* 0.0465*** 0.0116*** 0.0442*** 0.0470** (1.78) (3.03) (4.29) (2.05) (4.52) (4.51) (4.29) (2.67) NWC2t –1(%) –0.0640** –0.0333*** –0.0640* –0.0637*** –0.0276*** –0.0196*** –0.0347*** –0.0843*** (–2.79) (–3.36) (–1.59) (–4.73) (–4.19) (–4.57) (–4.27) (–4.33) NWC*CFLOWt –1(%) –0.0132*** –0.118*** –0.0308*** –0.0280** –0.0191*** –0.0623*** –0.0111*** –0.0090*** (–3.72) (–3.71) (–3.48) (–3.56) (–4.45) (–4.03) (–3.94) (–3.65) NWC2*CFLOWt –1(%) 0.0170*** 0.302*** 0.0718** 0.0582*** 0.0520*** 0.0762*** 0.0210*** 0.0089*** (4.00) (3.49) (2.90) (4.55) (4.55) (4.50) (4.57) (4.01) CHOLDt –1(%) 0.545*** 0.0198*** 0.0230*** 0.0345* 0.060*** 0.0272*** 0.0548*** 0.0361** (4.24) (4.07) (4.55) (1.99) (4.89) (4.27) (4.85) (2.74) GROWTHt –1(%) 0.0405*** 0.0554*** 0.0527** 0.0217* 0.0283*** 0.0354** 0.0612** 0.0772* (4.57) (4.26) (2.82) (2.01) (4.14) (2.03) (2.63) (2.31) AGEt –1(log) 0.0892*** 0.0164 0.0315 0.0120 0.0400 0.0775 0.0888 0.0637 (3.80) (0.28) (0.46) (1.41) (0.84) (1.28) (0.46) (0.89) SIZEt –1(log) –0.143*** –0.253*** –0.0488*** –0.262*** –0.0261*** –0.0515*** –0.0200** –0.109*** (–4.26) (–4.25) (–4.32) (–4.43) (–4.42) (–4.42) (–3.11) (–3.75) ATANt –1(%) –0.0304*** –0.0787* –0.0214*** –0.0205*** –0.0476*** –0.0290*** –0.0855*** –0.0329*** (–4.52) (–2.04) (–3.48) (–4.28) (–4.64) (–4.54) (–4.55) (–3.88) LEVt –1(%) –0.0740 –0.312 –0.0902 –0.169 –0.0615 –0.0195 –0.0509 –0.0545 (–0.73) (–0.10) (–0.40) (–0.49) (–0.33) (–0.07) (–0.47) (–1.43) C 6.243*** 10.30*** 8.165*** 8.118*** 23.21** 7.221*** 21.61*** 6.686*** (4.25) (4.07) (5.61) (4.67) (2.79) (6.22) (6.03) (4.90) R –squared 0.1045 0.0878 0.3356 0.3143 0.1667 0.2984 0.1345 0.1421 Observation 547 386 14151 6213 841 11856 3878 18921
32 Table 8. Return on Assets, Cash Holding and Net Working Capital: Conditional on Industry Classification
This table presents firm fixed effects regression with ROA as the dependent variable. ROA is the earnings before interest, tax and depreciation as a percentage of total assets. NWC is inventories plus receivables minus payables as a percentage of sales revenue. CFLOW is operating income before depreciation and amortisation minus interest expense and income tax expense scaled by net assets. CHOLD is the cash and cash equivalents as a percentage of net assets. GROWTH is the percentage chagne in sales revenue over the previous year. AGE is the natural log of the years between incorporation and the calendar year end of each firm. SIZE is the natural log of firms total assets. ATAN is the finxed assets as a percentage of total assets. LEV is the debt as a percentage of total assets. The sample consists of 65,244 firm–years across 6,926 unique UK SMEs over the period 2004-2013. t –values are in parentheses below coefficients.
Variable Agriculture Mining Manufacturing Construction Wholesale Retail Services TransandPublic
NWC t –1(%) 0.0640* 0.0765** 0.0480** 0.0266*** 0.0227*** 0.0519*** 0.0570*** 0.0333** (1.63) (2.63) (2.94) (4.32) (4.83) (4.50) (4.65) (2.70) NWC2 t –1(%) –0.0113*** –0.0419** –0.0388*** –0.0280*** –0.0122*** –0.0939*** –0.0840*** –0.0874*** (–4.22) (–2.66) (–4.31) (–4.10) (–4.61) (–4.07) (–4.61) (–4.23) NWC*CHOLD t –1(%) –0.0622*** –0.0365*** –0.0114*** –0.0061*** –0.0021*** –0.0700*** –0.0198*** –0.0520*** (–4.21) (–4.31) (–4.30) (–4.62) (–4.06) (–4.15) (–4.74) (–4.72) NWC2*CHOLD t –1(%) 0.0660*** 0.0860*** 0.0260** 0.0100*** 0.0080** 0.0755*** 0.0270*** 0.0490*** (4.74) (4.63) (2.94) (4.09) (2.99) (4.38) (4.47) (4.59) CHOLD t –1(%) 0.0580*** 0.029*** 0.0465** 0.0398*** 0.0517*** 0.0328** 0.0644*** 0.0501*** (4.97) (4.09) (2.72) (4.98) (4.48) (2.74) (4.86) (4.41) GROWTH t –1(%) 0.0777*** 0.0612*** 0.0615*** 0.1004** 0.0250*** 0.126*** 0.0373*** 0.0676** (4.22) (4.84) (4.81) (2.76) (4.84) (4.41) (4.48) (2.96) AGE t –1(log) 0.0950*** 0.0235 0.0358 0.0143 0.0405 0.0440 0.0120 0.0610 (4.25) (0.04) (0.05) (1.68) (0.89) (0.71) (0.62) (0.86) SIZE t –1(log) –0.0401*** –0.0327*** –0.139*** –0.0417** –0.152*** –0.101*** –0.0930** –0.124*** (–4.84) (–4.35) (–4.95) (–2.97) (–4.44) (–4.85) (–2.71) (–4.92) ATAN t –1(%) –0.0874*** –0.0781*** –0.0560*** –0.0593*** –0.0730*** –0.0235*** –0.0525*** –0.0497*** (–4.76) (–4.94) (–4.83) (–4.80) (–4.98) (–4.41) (–4.93) (–4.08) LEV t –1(%) –2.121 –1.385 –0.216 –0.583 –2.862 –0.0737 –0.698 –0.0446 (–1.12) (–0.38) (–0.94) (–1.76) (–0.71) (–0.25) (–0.65) (–0.19) C 7.456*** 11.41*** 9.128*** 9.562*** 23.78** 5.368*** 18.72*** 9.122*** (5.58) (5.17) (6.37) (5.68) (2.94) (4.60) (5.53) (6.78) R –squared 0.1005 0.0973 0.3965 0.3234 0.1568 0.3040 0.2194 0.2622 Observation 551 359 14102 6495 888 11567 3934 19276