Durham Research Online
Deposited in DRO:
03 October 2018Version of attached le:
Accepted VersionPeer-review status of attached le:
Peer-reviewedCitation for published item:
Alhassan, Zakhriya and McGough, A. Stephen and Alshammari, Riyad and Daghstani, Tahani and Budgen, David and Al Moubayed, Noura (2018) 'Stacked Denoising Autoencoders for mortality risk prediction using imbalanced clinical data.', IEEE 17th International Conference on Machine Learning and Applications (ICMLA 2018). Orlando, Fl, USA, 17-20 December 2018.
Further information on publisher's website:
https://www.icmla-conference.org/icmla18/Publisher's copyright statement:
c
2018 IEEE. Personal use of this material is permitted. Permission from IEEE must be obtained for all other uses, in
any current or future media, including reprinting/republishing this material for advertising or promotional purposes, creating new collective works, for resale or redistribution to servers or lists, or reuse of any copyrighted component of this work in other works.
Use policy
The full-text may be used and/or reproduced, and given to third parties in any format or medium, without prior permission or charge, for personal research or study, educational, or not-for-prot purposes provided that:
• a full bibliographic reference is made to the original source • alinkis made to the metadata record in DRO
• the full-text is not changed in any way
The full-text must not be sold in any format or medium without the formal permission of the copyright holders. Please consult thefull DRO policyfor further details.
Durham University Library, Stockton Road, Durham DH1 3LY, United Kingdom Tel : +44 (0)191 334 3042 | Fax : +44 (0)191 334 2971
Stacked Denoising Autoencoders for Mortality Risk
Prediction Using Imbalanced Clinical Data
1
stZakhriya Alhassan
Department of Computer Science Durham University
Durham, United Kingdom [email protected]
2
ndA. Stephen McGough
School of Computing Newcastle University
Newcastle upon Tyne, United Kingdom [email protected]
3
rdRiyad Alshammari
KSAU for Health Sciences Public Health and Health Informatics
Riyadh, Saudi Arabia [email protected]
4
thTahani Daghstani
KSAU for Health Sciences
College of Public Health and Health Informatics
Riyadh, Saudi Arabia [email protected]
5
thDavid Budgen
Department of Computer Science Durham University
Durham, United Kingdom [email protected]
6
thNoura Al Moubayed
Department of Computer Science Durham University
Durham, United Kingdom [email protected]
Abstract—Clinical data, such as evaluations, treatments, vital sign and lab test results, are usually observed and recorded at hospital systems. Making use of such data to help physicians evaluating the mortality risk of in-hospital patients provides an invaluable source of information which ultimately help improving the health-care services. Therefore, quick and accurate prediction of mortality can be critical for physicians to make intervention decisions. In this work, we introduce a predictive Deep Learning model aiming to evaluate the mortality risk of in-hospital patients. Stacked Desoising Autoencoder (SDA) is trained using a unique time-stamped dataset (King Abdullah International Research Center - KAIMRC) which is naturally imbalanced. The work is compared to common deep learning approaches using different methods for data balancing. The proposed model demonstrated here to overcome the problem of imbalanced data and outperform common deep learning approaches with an accuracy of 77.13% for the Recall macro.
Index Terms—Mortality risk, Deep Learning, Stacked Desois-ing Autoencoder,KDesois-ing Abdullah International Research Center, Data Imbalance, Recall Macro
I. INTRODUCTION
Predicting the mortality risk of patients is a major concern for physicians in the medical domain. Accurate prediction of the mortality (referred in some studies as discharge type) can introduce improvable heath care services for the survival of patients. The quick and timely interpretation of clinical data is needed by physicians to improve patients outcome [1]. Thus, the early prediction of in-hospital mortality risk is one of the major areas of interest for research.
Patient clinical data usually comprises of a set of readings for vital signs and lab tests. The data used in this study is the King Abdullah International Research Centre (KAIMRC) dataset [2]. It is a unique time-stamped dataset that contains a full history of patient’s details, vital signs and lab test readings for each patient’s visit.
The availability of this data can bring considerable oppor-tunities for machine learning research. However, there are several common issues that can accompany the collection of
the clinical data, such as irregular or missing data. A major challenge in building machine learning solutions to understand clinical data is the imbalanced nature of the data [3]. Imbal-ance happens when the presence of one class in the dataset is more than the counterpart class. Most clinical datasets (including KAIMRC) are subject to this problem [4]. The distribution of the dataset classes can effect the performance of most classification algorithms. Batista et al. [3] placed emphasis on the imbalanced data problem as an obstacle for machine learning by applying ten different balancing solutions to 25 different datasets. Depending on the dataset and it’s size, this problem is traditionally solved either by artificially creating more samples for the minority class or eliminating samples from the majority class.
Autoencoders were introduced by Hinton et al. [5] in 1986. The Autoencoders are unsupervised learning algorithms as they are used to learn representation of the input from unlabelled data [6]. Autoencoders have been used effectively in tasks that involve dimensions reduction and single-class learning (anomaly detection) [7]. They can learn the corre-lations between the input features by transforming the input into a latent space with new encoded dimensions. Decoding the latent space to original input can help the Autoencoder to learn hidden features, correlations and patterns of the data.
In this work, we investigate the performance of the Au-toencoder models to predict the mortality risk of in-hospital patients using KAIMRC clinical data. Since the proposed data is naturally imbalanced, we formulate the mortality risk classification problem as a problem of anomaly detection (patient discharged home as normal and died as abnormal) and use the Autoencoders with unlabelled data.
To the best of our knowledge, this work is the first to inves-tigate the use of a predictive model for mortality prediction in general (regardless of the health problem) using the Stacked Denoising Autoencoder (SDA). The proposed model is trained and tested using single class of KAIMRC dataset. The main
contributions of this paper are:
• Applying SDA to predict the mortality risk after 24 hours of in-hospital patients admission using clinical data. • Studying the impact of different data scaling methods and
data corruption levels on the performance of the proposed models.
• Comparing the performance of the SDA model (trained on single-class) with common deep learning algorithms (trained on over-sampled binary-classes)
II. RELATEDWORK
The prediction of a patient mortality risk is usually eval-uated by physicians using traditional scoring systems, such as Simplified Acute Physiology Score (SAPS), EuroSCORE, Acute Physiology and Chronic Health Evaluation (APACHE), Mortality Probability Models (MPMs) and Pediatric Risk of Mortality (PRISM) [8]. Physicians use these for different clinical conditions. These systems differ in the used clinic and biologic variables but they all aim to calculate the mor-tality score. The most common traditional scoring system that physicians use as an indicator for patient acuity status is the Simplified Acute Physiology Score (SAPS). A SAPS score is calculated manually using 14 clinical and biological variables after the first 24 hours of patient admission [9]. EuroSCORE, for instance, is another scoring system which is used to calculate the patients mortality risk after a heart surgery [10].
With the help of Electronic Health Records (EHR), clin-ical data developed into an interesting frontier for machine learning research. The traditional acuity scoring methods were accompanied with some shallow machine learning algorithms for the forecast of mortality status. The Ghassemi et al. model [11], used Multi-Task Gaussian Process, achieved better when adding the SAPS scores to the input features. Luo et al. [1] converted MIMIC-II time series into graphs representation to discover temporal patterns [12]. Extracted patterns were then grouped using a non-negative matrix factorization method. The groups were used with the Logistic Regression (LR) classifier for mortality risk prediction.
Neural networks have also been used for mortality predic-tion for specific health condipredic-tions such as the mortality of pneumonia patients which was investigated by Caruna et al. [13] using two different models of neural network. Another study by Celi et al. [14] who employed LR, the Bayesian Network (BN) and the Artificial Neural Network (ANN) using MIMIC dataset for predicting the mortality of acute kidney in-jury (1,400 cases) and Subarachnoid Hemorrhage (223 cases) patients. They used SAPS and EuroSCORE results to compare with the results of their models. Another study by Shi et al. [15] compared the neural network with LR for the prediction of mortality after doing a liver cancer surgery with an accuracy of 84%. The conventional neural network models in these studies have achieved a better performance and outperformed shallow models such LR and BN [16]. However, the above studies are not comparable to our work as their models are used to predict the mortality for patients with a specific health
condition whereas our proposed model is trained to learn to predict the mortality for 97 health conditions.
Since our proposed models investigate the use of deep learning techniques to predict the patients mortality risk (dis-charge type) using patients clinical data, we focus on recent studies that applied deep learning models. In recent years, Deep Learning models have shown powerful capabilities of analyzing and understanding complex clinical data in a variety of medical applications. However, deep neural networks mod-els have not been explored for the prediction of the mortality risk for in-hospital patients [17].
A deep learning model, the Long Short-Term Memory (LSTM), was used by Harutyunyan et al. [17] to predict the mortality using the MIMIC-III dataset [18]. This study used the LSTM for mortality risk classification after 48 hours of pa-tient admission. Their model achieved 86.25% using the Area Under the Receiver Operator Curve (AUROC) and %51.69 using the Area Under the Precision-Recall Curve (AUPRC). However, the dataset used in this study was imbalanced (90% discharged home and 10% for died). Therefore, using the AUROC (86.25% ) measure for the model evaluation can be misleading as it gives same weight for both minority and majority classes [19]. However, the AUPRC (%51.69) can be more sensible measure for evaluating models trained using imbalanced data.
In this work, we propose the use of the SDA for mortality risk prediction. Unlike previous studies that formulated the mortality prediction into binary classification problem for specific health conditions and with the data of 48 hours after admission, this work investigates the performance of predicting an in-hospital patient’s mortality risk in general (regardless of the health condition types) and after only 24 hours of patient admission using a unique dataset (KAIMRC).
III. DATASET
KAIMRC is one of the leading institutions in health research in the Middle East. The KAIMRC1 dataset was collected by
Ministry of National Guard Health Affairs (NGHA) from three main National Guard Hospitals2.
The KAIMRC dataset contains the full history of patients for the period between 2010 and 2015. In addition, it contains 41 million time-stamped lab test readings, such as Blood Urea Nitrogin (BUN), cholesterol (Chol) and Mean Corpuscular Hemoglobin (MCH). It also holds time-stamped data about vital signs, such as Body Mass Index (BMI) and Hypertension. Other important features were also collected from each visit, such as visit type (in-patient, or emergency), gender, patient visit age, service type (such as Cardiology, Neurology or En-docrinology), length of stay (LOS) and discharge type (home, referred to another hospital, patient died or administrative reason discharge).
1Access to KAIMRC dataset can be obtained upon an official request to
KAIMRC.
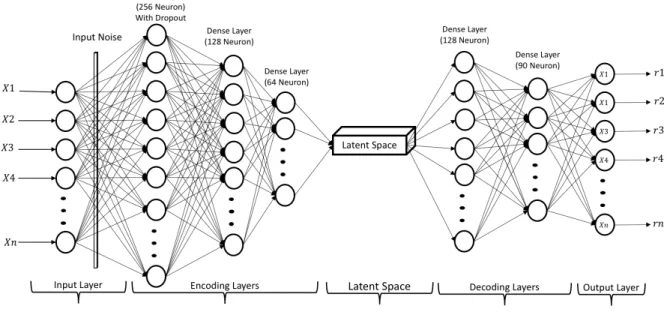
Fig. 1. Proposed SDA Model
A. Data Pre-processing
Each patient visit is described by a set of measures. These are represented as episodes. The episodes contain the data list of irregularly collected vital signs and lab readings. In addition to that, the non-sequential data (gender, age and service provided) are also integrated into the episodes.
For the purpose of our experiment (predicting the mortality after 24 hours), only the data of the patients with two or more days of length of stay were considered. Patient visits with less than two days of hospitality have been excluded. The patients discharged with administrative reasons have also been excluded making the experimental data set size to 3,557 patient visits (Table I).
TABLE I
STATISTICS OFKAIMRC DATASET
Characteristic Overall Used
Number of patient visits 14,609 3,557 Number of features 500+ 86 Number of different health conditions 99 97 Number of patient visit types 4 2 Number of discharge types 8 2
There are 86 features: gender, age, service, specialty, visit type and 81 vital signs and lab results 3. To give an early
prediction for the discharge type of a patient visit, the values for the first day of the patient visit are selected to train and test the proposed models. Some features are frequently changing as they may have been collected on an hourly basis, such as vital signs. In these cases, the average value for these readings on that day are used. In case of missing readings, the first available value for that readings taken on the next days is
3For space reasons the full list of features can not be listed here.
considered. If there are no readings taken in the whole visit, we consider it to be missing data and replace them with zeros.
1) Imbalanced Data: Normally the in-hospital patient mor-tality after admission event is rare compared with patients being discharged home. The majority of the patient visits of KAIMRC dataset are labelled with discharge home (95%). The remaining 5% of the data are labelled with patient died. It is noticeable that the experimental dataset is severely imbalanced. We propose investigating common solutions to overcome the problem of imbalanced data for the base-line models. Over-sampling is applied on the samples with minor-ity labels. The Synthetic Minorminor-ity Over-Sampling Technique (SMOTE) [20] is one of the common methods for over-sampling. SMOTE is based on the synthetic creation of new examples of the minority class. The nearest neighbours of the created samples are randomly chosen based on the number of needed examples.
There are several versions of the SMOTE algorithm to evaluate and solve the imbalance problem. Borderline SMOTE (bSMPTE) is a version of SMOTE that considers the examples close to the minority borderlines during the process of over-sampling [21] [22]. Support Vector Machine SMOTE (SVM-SMOTE) [20] is another version that uses SVM classifier to create number of synthetic examples around the negative class points [23]. In this work, we applied bSMOTE and SVM-SMOTE methods to overcome the problem of imbalanced data when using the supervised learning algorithms in the base-line models.
2) Data Scaling: Data scaling is a process of making the ranges for the dataset features into the same scale. This process is usually part of the data pre-processing task. Normalization and standardization are two common methods for data scaling. Normalization uses minimum and maximum values for each
feature to re-scale values between 0 and 1. Standardization changes the distribution of the feature values to be centred on 0 and the standard deviation of 1. These methods can be used as part of data pre-processing and before building and feeding the models with the input data.
IV. METHODS
Autoencoder networks have shown capability for tasks that involve anomaly detection. Unlike other deep learning meth-ods, Autoencoders are trained using unsupervised algorithms that can learn from single-class data, attempting to represent it’s input xas reconstructions r. The Autoencoder networks consist of an encoder function h = f(x), and a decoder function which generates the reconstructions using the decoder functionr=g(h)[24] [25]. A Stacked Autoencoder (SA) uses more than one encoding and/or decoding layers (functions). The output of each layer is used as input for the successive layer.
The Autoencoder’s main task is to minimize the error (called reconstruction error) between the input values xand the reconstructions using loss functionsL (Eq. 1).
L(x, g(f(x))) (1)
The identity function problem occurs when the Autoencoder network cannot extract important features from the input and memorize the data instead of learning the patterns. This can be avoided by limiting the number of units in the hidden layers be to less than the number of input units. This means mapping the input to a lower dimensional space (new features). This can help the network to learn correlations between the input features. These encoded-aggregated features are called latent-features. On the other hand, having a greater number of hidden units can also be helpful for the Autoencoder network, especially when imposing sparsity on the hidden units.
The Denoising Autoencoder (DAE) is an extended version of the basic Autoencoder. DAE tends to force the hidden units to extract features from a corrupted version x˜ of the original input x. Decoding the corrupted input can help the network to learn extracting important features and avoid the identity function problem by undoing the corruption. The DAE tries to minimize the reconstruction error using x˜ (Eq. 2).
L(x, g(f(˜x))) (2)
In our work, we investigate the performance of a Stacked Denoising Autoencoder (SDA) model using a sequences of patient observations as input x : x1, x2, ...x86. We use the
Mean Squared Error (MSE) function (Eq. 3) to calculate the reconstruction error after fitting the model with the test data.
M SE= 1 n n X i=1 (y−r)2 (3)
V. MODELS ANDEXPERIMENTALSETUP
The input layer for the SDA neural network model contains three stacked hidden layers for the encoder, as shown in Fig 1. Prior to the encoder, a noise is added to the input layer using the Gaussian noise method [26]. The first layer of the encoder was attached with a dropout of 0.1. The number of neurons for the encoder layers are 256, 128 and 64 respectively. Tanh activation function is used in the first layer and relu is used for remaining encoder layers. The model also contains two hidden layers for the decoder. The first decoding hidden layer holds 128 neurons with relu and the second hidden layer holds 90 neurons with tanh activation function.
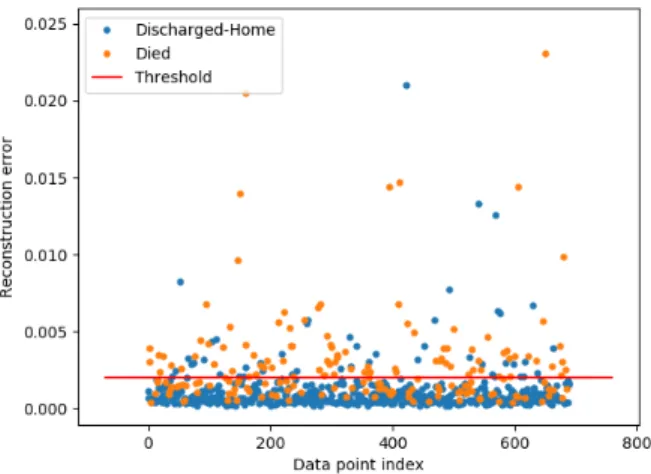
Fig. 2. SDA Predicted Data Points Space Using Normalized data
Fig. 3. SDA Predicted Data Points Space Using Standardized data
The SDA model is trained and validated using 80% and 10% respectively of the majority class data only. The remaining 10% of the majority class is then used along with minority class data (anomaly samples) for testing. The model uses RMSprop optimizer with Mean Squared Error as loss function. Before preforming the prediction on the test data, the model
TABLE II
CLASSIFIERS PERFORMANCE FORMORTALITYRISKPREDICTION
Model Over-Sampling Scaling F1 macro Recall macro Precision macro
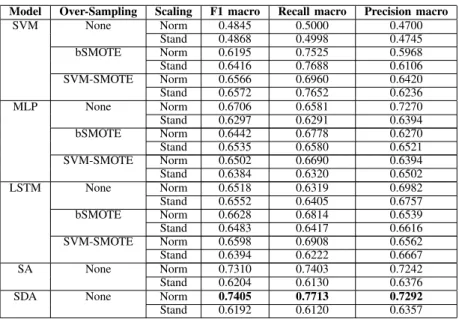
SVM None Norm 0.4845 0.5000 0.4700 Stand 0.4868 0.4998 0.4745 bSMOTE Norm 0.6195 0.7525 0.5968 Stand 0.6416 0.7688 0.6106 SVM-SMOTE Norm 0.6566 0.6960 0.6420 Stand 0.6572 0.7652 0.6236 MLP None Norm 0.6706 0.6581 0.7270 Stand 0.6297 0.6291 0.6394 bSMOTE Norm 0.6442 0.6778 0.6270 Stand 0.6535 0.6580 0.6521 SVM-SMOTE Norm 0.6502 0.6690 0.6394 Stand 0.6384 0.6320 0.6502 LSTM None Norm 0.6518 0.6319 0.6982 Stand 0.6552 0.6405 0.6757 bSMOTE Norm 0.6628 0.6814 0.6539 Stand 0.6483 0.6417 0.6616 SVM-SMOTE Norm 0.6598 0.6908 0.6562 Stand 0.6394 0.6222 0.6667 SA None Norm 0.7310 0.7403 0.7242 Stand 0.6204 0.6130 0.6376
SDA None Norm 0.7405 0.7713 0.7292
Stand 0.6192 0.6120 0.6357 Table II: Shows the performance metrics for the base-line, SA and SDA classifiers.
was trained for 100 epochs. In our experiment, we investigated the performance of the model with the first 24 hours patient data after admission. Since the test data are imbalanced, we report F1-macro, Recall-macro and Precision-macro scores to evaluate the performance of the proposed models. A threshold is then chosen to decide on the outliers (anomalies) based on the calculated MSE values (Eq. 3).
A. Base-line Models
We compare our results against three commonly used base-line models: Support Vector Machine (SVM), Multi-Layer Perceptron (MLP) and Long Short-Term Memory (LSTM) [24] [27]. These models need balanced data. Therefore an over-sampling method is used to generate more samples from the minority class data. bSMOTE and SVM-SMOTE over-sampling methods are used for balancing the data.
VI. RESULTS
Table II shows the performance metrics obtained using SVM, MLP, LSTM, SA and SDA models. The models are trained with and without sampling. In case of over-sampling, bSMOTE and SVM-SMOTE are used for data balancing and training the models. To evaluate the models accurately and robustly, only real data from both classes are used for testing (no artificially generated samples are used for testing). For training the base-line models, real data from the majority class with the over-sampled data from the minority class are used. Table II shows the results when the models are trained with scaled data using normalization and standardization techniques. SDA model with normalization, achieved an accuracy of 74.05% for F1-macro, 77.13% for Recall-macro and 72.92% for Precision-macro. This result is
outperforming the models in the related work section and the base-line.
In table II, the results emphasize the impact of the method used for scaling the data when applying SA and SDA. Scaling the data using the normalization in SDA model achieved 74.05% for F1-macro while standardization achieved signif-icantly less results with 61.92% in the same model using the same data. The test data points with reconstruction error values are presented in Fig 2 and Fig 3. The predicted data using standardization contrasts with the reconstruction error value for normal and anomalous data points. The results also show that the Autoencoders (SA and SDA) can perform better when noise is added to the input layer. The Gaussian noise provides the Autoencoder with more generalized input which helps the model to detect the anomalies.
Table II also shows that balancing the data using over-sampling algorithms (bSMOTE and SVM-SMOTE) for deep learning models (MLP and LSTM), has a minor impact on the result compared to the imbalanced data. This is not the case for SVM models, which show better accuracy when using artificially balanced data.
VII. DISCUSSION ANDCONCLUSION
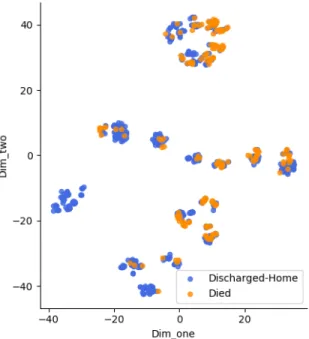
The task of predicting the mortality risk can be challenging. Fig 4 demonstrates this challenge by visualizing the overlap in the SDA latent space in the test data between the two classes using t-SNE [28]. In this paper, we investigated a novel application of the Stacked Denoising Autoencoder for in-hospital patients mortality risk prediction. The proposed model, using patients clinical data from a variety of health conditions and without intensive feature engineering, achieved promising results using only the first 24 hours data for patients after admission. The model was trained using only the majority
class data of KAIMRC dataset. It was tested using a mixture of majority and minority classes.
Our model outperformed the base-line classifiers and achieved an accuracy of 74.05% for F1-macro, 77.13% for Recall-macro and 72.92% for Precision-macro. The results for these measures also outperformed the deep learning model (51.69% for AUPRC using two days data) in the literature of this work. The proposed model (SDA) gives promising mortality risk prediction results within 24 hours only of patients admission. This can be very significant for clinicians to make quicker intervention decision to provide an improved health-care services to the patients (especially for those under the risk of mortality). Further work may investigate the impact of applying different techniques for handling the missing data in KAIMRC data.
Fig. 4. SDA Latent Space Visualization for Test Data Using t-SNE
REFERENCES
[1] Y. Luo, Y. Xin, R. Joshi, L. A. Celi, and P. Szolovits, “Predicting icu mortality risk by grouping temporal trends from a multivariate panel of physiologic measurements.” inAAAI, 2016, pp. 42–50.
[2] Z. Alhassan, A. S. McGough, R. Alshammari, T. Daghstani, D. Bud-gen, and N. Al Moubayed, “Type-2 diabetes mellitus diagnosis from time series clinical data using deep learning models,” inInternational Conference on Artificial Neural Networks. Springer, 2018, in press. [3] G. E. Batista, R. C. Prati, and M. C. Monard, “A study of the behavior
of several methods for balancing machine learning training data,”ACM SIGKDD explorations newsletter, vol. 6, no. 1, pp. 20–29, 2004. [4] M. M. Rahman and D. Davis, “Addressing the class imbalance problem
in medical datasets,” International Journal of Machine Learning and Computing, vol. 3, no. 2, p. 224, 2013.
[5] D. E. Rumelhart and J. L. McClelland, “Parallel distributed processing: explorations in the microstructure of cognition. volume 1. foundations,” 1986.
[6] R. Chalapathy, A. K. Menon, and S. Chawla, “Anomaly detection using one-class neural networks,”arXiv preprint arXiv:1802.06360, 2018. [7] L. Van Der Maaten, E. Postma, and J. Van den Herik, “Dimensionality
reduction: a comparative,”J Mach Learn Res, vol. 10, pp. 66–71, 2009.
[8] G. Doig, K. Inman, W. Sibbald, C. Martin, and J. Robertson, “Modeling mortality in the intensive care unit: comparing the performance of a back-propagation, associative-learning neural network with multivariate logistic regression.” inProceedings of the Annual Symposium on Com-puter Application in Medical Care. American Medical Informatics Association, 1993, p. 361.
[9] J. G. Le, P. Loirat, A. Alperovitch, P. Glaser, C. Granthil, D. Mathieu, P. Mercier, R. Thomas, and D. Villers, “A simplified acute physiology score for icu patients.”Critical care medicine, vol. 12, no. 11, pp. 975– 977, 1984.
[10] S. A. Nashef, F. Roques, P. Michel, E. Gauducheau, S. Lemeshow, R. Salamon, and E. S. Group, “European system for cardiac opera-tive risk evaluation (euro score),”European journal of cardio-thoracic surgery, vol. 16, no. 1, pp. 9–13, 1999.
[11] M. Ghassemi, M. A. Pimentel, T. Naumann, T. Brennan, D. A. Clifton, P. Szolovits, and M. Feng, “A multivariate timeseries modeling approach to severity of illness assessment and forecasting in icu with sparse, heterogeneous clinical data.” inAAAI, 2015, pp. 446–453.
[12] M. Saeed, M. Villarroel, A. T. Reisner, G. Clifford, L.-W. Lehman, G. Moody, T. Heldt, T. H. Kyaw, B. Moody, and R. G. Mark, “Multipa-rameter intelligent monitoring in intensive care ii (mimic-ii): a public-access intensive care unit database,” Critical care medicine, vol. 39, no. 5, p. 952, 2011.
[13] R. Caruana, S. Baluja, and T. Mitchell, “Using the future to” sort out” the present: Rankprop and multitask learning for medical risk evaluation,” in
Advances in neural information processing systems, 1996, pp. 959–965. [14] L. A. Celi, S. Galvin, G. Davidzon, J. Lee, D. Scott, and R. Mark, “A database-driven decision support system: customized mortality pre-diction,”Journal of personalized medicine, vol. 2, no. 4, pp. 138–148, 2012.
[15] H.-Y. Shi, K.-T. Lee, H.-H. Lee, W.-H. Ho, D.-P. Sun, J.-J. Wang, and C.-C. Chiu, “Comparison of artificial neural network and logistic regression models for predicting in-hospital mortality after primary liver cancer surgery,”PloS one, vol. 7, no. 4, p. e35781, 2012.
[16] G. Clermont, D. C. Angus, S. M. DiRusso, M. Griffin, and W. T. Linde-Zwirble, “Predicting hospital mortality for patients in the intensive care unit: a comparison of artificial neural networks with logistic regression models,”Critical care medicine, vol. 29, no. 2, pp. 291–296, 2001. [17] H. Harutyunyan, H. Khachatrian, D. C. Kale, and A. Galstyan,
“Mul-titask learning and benchmarking with clinical time series data,”arXiv preprint arXiv:1703.07771, 2017.
[18] A. E. Johnson, T. J. Pollard, L. Shen, H. L. Li-wei, M. Feng, M. Ghas-semi, B. Moody, P. Szolovits, L. A. Celi, and R. G. Mark, “Mimic-iii, a freely accessible critical care database,”Scientific data, vol. 3, p. 160035, 2016.
[19] S. L. Phung, A. Bouzerdoum, and G. H. Nguyen, “Learning pattern classification tasks with imbalanced data sets,” 2009.
[20] N. V. Chawla, K. W. Bowyer, L. O. Hall, and W. P. Kegelmeyer, “Smote: synthetic minority over-sampling technique,”Journal of artificial intel-ligence research, vol. 16, pp. 321–357, 2002.
[21] H. Han, W.-Y. Wang, and B.-H. Mao, “Borderline-smote: a new over-sampling method in imbalanced data sets learning,” in International Conference on Intelligent Computing. Springer, 2005, pp. 878–887. [22] H. M. Nguyen, E. W. Cooper, and K. Kamei, “Borderline over-sampling
for imbalanced data classification,”International Journal of Knowledge Engineering and Soft Data Paradigms, vol. 3, no. 1, pp. 4–21, 2011. [23] Y. Tang, Y.-Q. Zhang, N. V. Chawla, and S. Krasser, “Svms modeling
for highly imbalanced classification,” IEEE Transactions on Systems, Man, and Cybernetics, Part B (Cybernetics), vol. 39, no. 1, pp. 281– 288, 2009.
[24] Y. LeCun, Y. Bengio, and G. Hinton, “Deep learning,”Nature, vol. 521, no. 7553, pp. 436–444, 2015.
[25] J. An and S. Cho, “Variational autoencoder based anomaly detection using reconstruction probability,”Special Lecture on IE, vol. 2, pp. 1– 18, 2015.
[26] P. Vincent, H. Larochelle, I. Lajoie, Y. Bengio, and P.-A. Manzagol, “Stacked denoising autoencoders: Learning useful representations in a deep network with a local denoising criterion,” Journal of machine learning research, vol. 11, no. Dec, pp. 3371–3408, 2010.
[27] S. Hochreiter and J. Schmidhuber, “Long short-term memory,”Neural computation, vol. 9, no. 8, pp. 1735–1780, 1997.
[28] L. v. d. Maaten and G. Hinton, “Visualizing data using t-sne,”Journal of machine learning research, vol. 9, no. Nov, pp. 2579–2605, 2008.