OECD Programme for International Student
Assessment (PISA)
National and International Surveys
2012
PISA 2009 Technical Report
PISA 2009 Technical Report
John Cresswell (ed)
Australian Council for Educational Research (ACER), [email protected]
Follow this and additional works at:
https://research.acer.edu.au/pisa
Part of the
Educational Assessment, Evaluation, and Research Commons
Recommended Citation
Recommended Citation
Cresswell, John (2012). "PISA 2009 Technical Report". Paris: OECD https://research.acer.edu.au/pisa/10
This Report is brought to you by the National and International Surveys at ACEReSearch. It has been accepted for inclusion in OECD Programme for International Student Assessment (PISA) by an authorized administrator of ACEReSearch. For more information, please contact [email protected].Please cite this publication as:
OECD (2012), PISA 2009 Technical Report, PISA, OECD Publishing.
http://dx.doi.org/10.1787/9789264167872-en
This work is published on the OECD iLibrary, which gathers all OECD books, periodicals and statistical databases. Visit www.oecd-ilibrary.org, and do not hesitate to contact us for more information.
PISA 2009 Technical Report
The PISA 2009 Technical Report describes the methodology underlying the PISA 2009 survey. It examines additional features related to the implementation of the project at a level of detail that allows researchers to understand and replicate its analyses. The reader will fi nd a wealth of information on the test and sample design, methodologies used to analyse the data, technical features of the project and quality control mechanisms.
Contents
Chapter 1. Programme for International Student Assessment: An overview Chapter 2. Test design and test development
Chapter 3. The development of the PISA context questionnaires Chapter 4. Sample design
Chapter 5. Translation and verifi cation of the test and survey material Chapter 6. Field operations
Chapter 7. Quality assurance
Chapter 8. Survey weighting and the calculation of sampling variance Chapter 9. Scaling PISA cognitive data
Chapter 10. Data management procedures Chapter 11. Sampling outcomes
Chapter 12. Scaling outcomes Chapter 13. Coding reliability studies Chapter 14. Data adjudication
Chapter 15. Profi ciency scale construction
Chapter 16. Scaling procedures and construct validation of context questionnaire data Chapter 17. Digital reading assessment
Chapter 18. International database
THE OECD PROGRAMME FOR INTERNATIONAL STUDENT ASSESSMENT (PISA)
PISA focuses on young people’s ability to use their knowledge and skills to meet real-life challenges. This orientation refl ects a change in the goals and objectives of curricula themselves, which are increasingly concerned with what students can do with what they learn at school and not merely with whether they have mastered specifi c curricular content. PISA’s unique features include its: – Policy orientation, which highlights differences in performance patterns and identifi es features common to high-performing
students, schools and education systems by linking data on learning outcomes with data on student characteristics and other key factors that shape learning in and outside of school.
– Innovative concept of “literacy”, which refers both to students’ capacity to apply knowledge and skills in key subject areas and to their ability to analyse, reason and communicate effectively as they pose, interpret and solve problems in a variety of situations. – Relevance to lifelong learning, which goes beyond assessing students’ competencies in school subjects by asking them to report
on their motivation to learn, their beliefs about themselves and their learning strategies. – Regularity, which enables countries to monitor their progress in meeting key learning objectives.
– Breadth of geographical coverage and collaborative nature, which, in PISA 2009, encompasses the 34 OECD member countries and 41 partner countries and economies.
P
IS
A
2
00
9 T
ec
h
n
ic
al
R
ep
o
rt
PISA 2009 Technical Report
PISA 2009
This document and any map included herein are without prejudice to the status of or sovereignty over any territory, to the delimitation of international frontiers and boundaries and to the name of any territory, city or area.
ISBN 978-92-64-04018-2 (print)
ISBN 978-92-64-16787-2 (PDF)
Series: PISA
ISSN 1990-8539 (print)
ISSN 1996-3777 (online)
The statistical data for Israel are supplied by and under the responsibility of the relevant Israeli authorities. The use of such data by the OECD is without prejudice to the status of the Golan Heights, East Jerusalem and Israeli settlements in the West Bank under the terms of international law.
Photo credits: Cover © .
Corrigenda to OECD publications may be found on line at: www.oecd.org/publishing/corrigenda. © OECD 2012
You can copy, download or print OECD content for your own use, and you can include excerpts from OECD publications, databases and multimedia products in your own documents, presentations, blogs, websites and teaching materials, provided that suitable acknowledgement of OECD as source and copyright owner is given. All requests for public or commercial use and translation rights should be submitted to [email protected]. Requests for permission to photocopy portions of this material for public or commercial use shall be addressed directly to the Copyright Clearance Center (CCC) at [email protected] or the Centre français d’exploitation du droit de copie (CFC) at [email protected].
Please cite this publication as:
OECD (2012), PISA 2009 Technical Report, PISA, OECD Publishing. http://dx.doi.org/10.1787/9789264167872-en
Foreword
The OECD’s Programme for International Student Assessment (PISA) surveys, which take place every three years, have been designed to collect information about 15-year-old students in participating countries. PISA examines how well students are prepared to meet the challenges of the future, rather than how well they master particular curricula. The data collected during each PISA cycle are an extremely valuable source of information for researchers, policy makers, educators, parents and students. It is now recognised that the future economic and social well-being of countries is closely linked to the knowledge and skills of their populations. The internationally comparable information provided by PISA allows countries to assess how well their 15-year-old students are prepared for life in a larger context and to compare their relative strengths and weaknesses.
PISA is methodologically highly complex, requiring intensive collaboration among many stakeholders. The successful implementation of PISA depends on the use, and sometimes further development, of state-of-the-art methodologies and
technologies. The PISA 2009 Technical Report describes those methodologies, along with other features that have enabled
PISA to provide high quality data to support policy formation and review. The descriptions are provided at a level that will enable review and, potentially, replication of the implemented procedures and technical solutions to problems.
This report contains a description of the theoretical underpinning of the complex techniques used to create the PISA 2009 Database, which includes information on 470 000 students in 65 countries.1 The database includes not only
information on student performance in the three main areas of assessment – reading, mathematics and science – but also their responses to the Student Questionnaire that they completed as part of the assessment. Data from the principals of
participating schools are also included. The PISA 2009 Database was used to generate information and to be the basis
for analysis for the PISA 2009 initial report.
The information in this report complements the PISA Data Analysis Manuals (OECD, 2009), which give detailed accounts
of how to carry out the analyses of the information in the database.
The PISA surveys are guided by the governments of the participating countries on the basis of shared policy-driven interests. The PISA Governing Board, which decides on the assessment and reporting of results, is composed of representatives from each participating country.
The OECD recognises the creative work of Raymond Adams, of the Australian Council for Educational Research (ACER), who is project director of the PISA Consortium and John Cresswell who acted as editor for this report. The team supporting them comprised Alla Berezner, Wei Buttress, Steve Dept, Andrea Ferrari, Cees Glas, Béatrice Halleux, Khurrem Jehangir, Nora Kovarcikova, Sheila Krawchuk, Greg Macaskill, Barry McCrae, Juliette Mendelovits, Alla Routitsky, Keith Rust, Ross Turner and Maurice Walker. A full list of the contributors to the PISA project is included in Annex H of this report. The editorial work at the OECD Secretariat was carried out by Marika Boiron, Elizabeth Del Bourgo, Miyako Ikeda, Maciej Jakubowski, Sophie Vayssettes and Elisabeth Villoutreix.
Note
1. The implementation and data for PISA 2009 plus countries are not discussed in this report, however, the procedures, technical standards and statistical methods used in the PISA 2009 plus study were identical to those discussed here.
Table of Contents
Foreword ...3
CHAPTER 1 Programme For InternatIonaL Student aSSeSSment: an overvIew ...21
Participation ...23
Features of PISA ...24
Managing and implementing PISA ...24
Organisation of this report ...26
CHAPTER 2 teSt deSIgn and teSt deveLoPment ...27
Test scope and format ...28
• Paper and pencil assessment ...28
• Digital Reading Assessment (DRA) ...28
Test design ...29
• Paper-based assessment ...29
• Digital Reading Assessment ...31
Test development centres ...31
Development timeline ...31
The PISA 2009 reading literacy framework...32
Item development process ...33
• First phase of development ...33
• Second phase of development...34
• National item submissions ...34
• National review of items ...35
• International item review ...36
• Reading for School questionnaire ...36
• Preparation of dual (English and French) source versions ...36
Field trial ...37
• Field trial selection ...37
• Field trial design ...38
• Despatch of field trial instruments ...39
• Field trial coder training ...39
• Field trial coder queries ...39
• Field trial outcomes ...40
• National review of field trial items ...40
Main study ...40
• Main survey coder query service ...45
• Review of main survey item analyses ...45
CHAPTER 3 the deveLoPment oF the PISa Context QueStIonnaIreS ...47
Introduction ...48
The development of the PISA 2009 Questionnaire Framework ...48
Research areas in PISA 2009 ...49
The development of the PISA 2009 context questionnaires ...52
The field-trial of the PISA 2009 context questionnaires ...52
The coverage of the questionnaire material ...53
• Student and School Questionnaires ...53
• Educational Career Questionnaire ...54
• ICT Familiarity Questionnaire ...54
• Parent Questionnaire ...54
The implementation of the context questionnaires ...54
CHAPTER 4 SamPLe deSIgn ...57
Target population and overview of the sampling design ...58
Population coverage, and school and student participation rate standards ...58
• Coverage of the PISA international target population ...59
• Accuracy and precision ...60
• School response rates ...60
• Student response rates ...61
Main study school sample ...62
• Definition of the national target population ...62
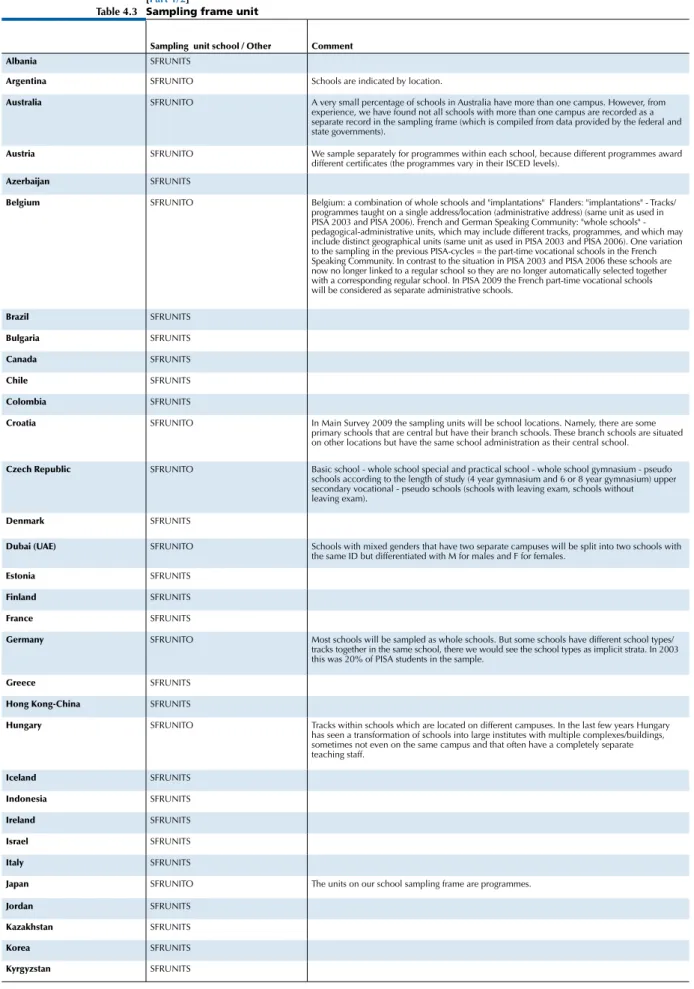
• The sampling frame ...62
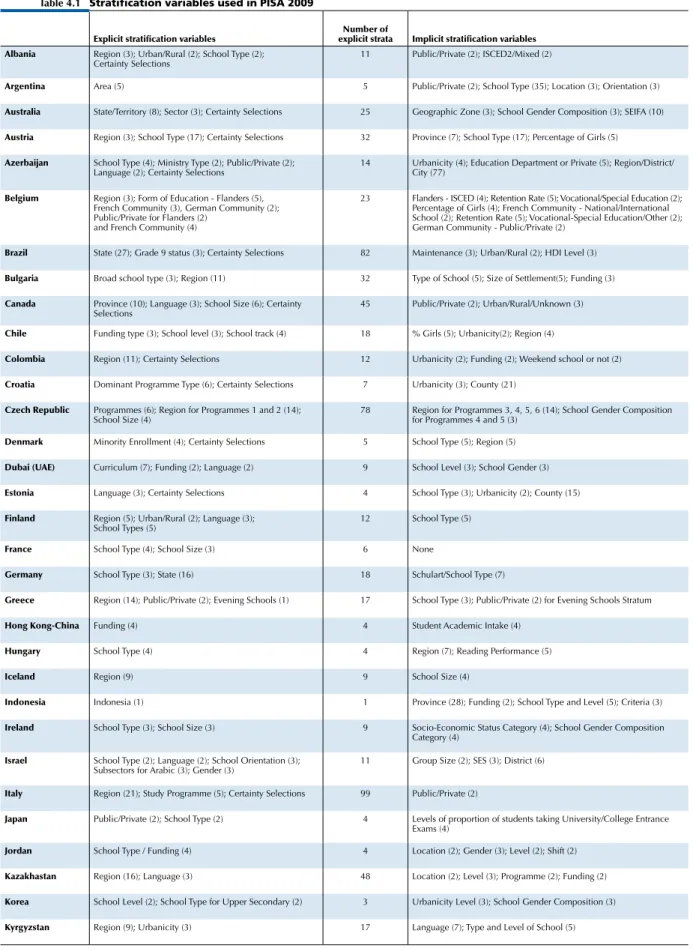
• Stratification ...63
• Assigning a measure of size to each school ...66
• School sample selection ...66
• Special school sampling situations ...68
• Monitoring school sampling ...71
• Student samples ...75
• Definition of school ...76
CHAPTER 5 tranSLatIon and verIFICatIon oF the teSt and Survey materIaL ...81
Introduction ...82
Development of source versions ...82
Double translation from two source languages ...83
PISA Translation and Adaptation Guidelines ...84
Translation Training Session ...84
Testing languages and translation/adaptation procedures ...84
International verification of the national versions ...86
• Verification of test units ...87
table of contents
• Verification of the booklet shell ...91
• Verification of link units ...91
• Verification of questionnaires ...91
• Final optical check of test booklets, questionnaire booklets and coding guides ...93
• Verification of operational manuals ...95
• Verification of Digital Reading Assessment (DRA) units ...95
• Quantitative analyses of verification outcomes ...96
Summary of items deleted at the national level, due to translation, printing or layout errors...96
CHAPTER 6 FIeLd oPeratIonS ...97
Overview of roles and responsibilities ...98
• National Project Managers ...98
• School Co-ordinators ...98
• Test Administrators ...99
• School Associates ...99
The selection of the school sample...99
Preparation of test booklets, questionnaires and manuals ...100
Selection of the student sample ...101
Packaging and shipping materials ...101
Receipt of materials at the national centre after testing ...102
Coding of the tests and questionnaires ...102
• Preparing for coding ...102
• Logistics prior to coding ...104
• Single coding design ...106
• Multiple coding ...109
• Managing the coding process ...111
• Cross-national coding ...112
• Questionnaire coding ...112
Data entry, data checking and file submission ...113
• Data entry ...113
• Data checking ...113
• Data submission ...113
• After data were submitted ...113
The main survey review ...113
CHAPTER 7 QuaLIty aSSuranCe ...115
PISA quality control ...116
• Comprehensive operational manuals ...116
• National level implementation planning document ...116
• Test administration 118
• Delivery ...118
• Post final optical check ...118
CHAPTER 8 Survey weIghtIng and the CaLCuLatIon oF SamPLIng varIanCe ...119
Survey weighting ...120
• The school base weight ...121
• The school base weight trimming factor ...121
• The school non-response adjustment...122
• The within-school base weight ...122
• The grade non-response adjustment ...125
• The within school non-response adjustment ...125
• Trimming the student weights ...126
• Weighting for Digital Reading Assessment ...126
Calculating sampling variance ...126
• The balanced repeated replication variance estimator ...126
• Reflecting weighting adjustments ...128
• Formation of variance strata ...128
• Countries and economies where all students were selected for PISA...128
CHAPTER 9 SCaLIng PISa CognItIve data ...129
The mixed coefficients multinomial logit model...130
• The population model ...131
• Combined model ...131
Application to PISA ...132
• National calibrations ...132
• National reports ...133
• International calibration ...139
• Student score generation ...140
Booklet effects ...141
Analysis of data with plausible values ...142
Developing common scales for the purposes of trends ...143
• Linking PISA 2009 for science and mathematics ...144
• Linking PISA 2009 for reading ...144
• Uncertainty in the link ...144
CHAPTER 10 data management ProCedureS ...147
Introduction ...148
Data management at the national centre ...150
• National modifications to the database ...150
• Student sampling with KeyQuest ...150
• Data entry quality control ...150
Data cleaning at ACER ...152
• Recoding of national adaptations ...152
table of contents
• DRA data ...152
• Cleaning reports ...153
• General recodings ...153
Final review of the data ...153
• Review of the test and questionnaire data ...153
• Review of the sampling data ...154
Next steps in preparing the international database ...154
CHAPTER 11 SamPLIng outComeS ...155
Design effects and effective sample sizes ...168
• Variability of the design effect ...171
• Design effects in PISA for performance variables ...171
Summary analyses of the design effect ...183
• Sampling for the Digital Reading Assessment (DRA) component ...185
CHAPTER 12 SCaLIng outComeS ...187
International characteristics of the item pool ...188
• Test targeting ...189
• Test reliability and measurement error design effect ...194
• Domain inter-correlations ...194
• Reading scales ...195
Scaling outcomes ...195
• National item deletions ...195
• International scaling ...197
• Generating student scale scores and reliability of the PISA scales ...198
Test length analysis ...199
Booklet effects ...203
• Overview of the PISA cognitive reporting scales ...211
• PISA literacy scales ...212
• PISA literacy subscales ...212
• Special purpose scales ...213
Observations concerning the construction of the PISA overall literacy scales ...213
• Framework development ...214
• Testing time and item characteristics...215
Transforming the plausible values to PISA scales ...229
• Mathematics ...229
• Reading ...229
• Science ...230
• DRA ...230
CHAPTER 14
Introduction ...248
• Implementing the standards – quality assurance ...248
• Information available for adjudication ...249
• Data adjudication process ...250
General outcomes ...251
• Overview of response rate issues ...251
• Digital Reading Assessment (DRA) ...251
• Detailed country comments ...252
CHAPTER 15 ProFICIenCy SCaLe ConStruCtIon ...257
Introduction ...258
Development of the described scales ...259
• Stage 1: Identifying possible scales ...259
• Stage 2: Assigning items to scales ...260
• Stage 3: Skills audit ...260
• Stage 4: Analysing field trial data ...260
• Stage 5: Defining the dimensions ...260
• Stage 6: Revising and refining with main survey data ...260
Defining proficiency levels ...261
Reporting the results for PISA reading ...263
• Building an item map for print reading ...263
• Levels of print reading literacy ...265
• Building an item map for digital reading ...272
• Levels of digital reading literacy ...275
• Interpreting the reading literacy levels ...276
CHAPTER 16 SCaLIng ProCedureS and ConStruCt vaLIdatIon oF Context QueStIonnaIre data...279
Overview...280
Simple questionnaire indices ...280
• School questionnaire indices ...282
• Parent questionnaire indices ...284
Scaling methodology and construct validation ...284
• Scaling procedures ...284
• Construct validation ...286
• Describing questionnaire scale indices ...286
Questionnaire scale indices ...287
• Student scale indices ...287
• School questionnaire scale indices ...306
• Parent questionnaire scale indices ...310
table of contents
CHAPTER 17 dIgItaL readIng aSSeSSment ...317
Item authoring tool ...318
Online item review ...318
Translation ...318
School hardware requirements ...319
• School computer resources survey ...319
• Technical problems in the Field Trial ...320
• Hardware diagnostic ...320
Test delivery system ...320
Data capture and submission ...321
Scoring student responses ...321
Online Coding System ...321
CHAPTER 18 InternatIonaL dataBaSe ...325
Files in the database...326
• Student files ...326
• School file ...327
• Parent file ...328
Records in the database ...328
• Records included in the database ...328
• Records excluded from the database ...329
Representing missing data ...329
How are students and schools identified? ...329
DRA database ...330 • Student files ...330 • School file ...330 Further information ...330 reFerenCeS ...333 annexeS ...335
Annex A Main study item pool classification ...336
Annex B Contrast coding used in conditioning ...344
Annex C Design effect tables ...353
Annex D Changes to core questionnaire items ...359
Annex E Mapping of ISCED to years ...364
Annex F National household possession items ...365
Annex G PISA 2009 technical standards ...367
Annex H PISA Consortium, staff and consultants ...381
Annex I Selection of OECD PISA publications ...384 Annex J
BOXES
Box 1.1 Key features of PISA 2009 ...25
Box 4.1 Illustration of probability proportional to size (PPS) sampling ...67
FIGURES
Figure 2.1 Screen layout for the Digital Reading Assessment ...29Figure 3.1 Summary of the Questionnaire Framework for PISA 2009 ...50
Figure 3.2
Themes and constructs/variables in PISA 2009 ...51
Figure 4.1 School response rate standards ...61
Figure 5.1 Sample Field Trial Test Adaptation Spreadsheet (TAS) for a new PISA 2009 reading unit ...89
Figure 5.2 Sample Main Survey Test Adaptation Spreadsheet (TAS) for a new PISA 2009 reading unit ...90
Figure 5.3 QAS section for an item that needs to be partially revised in the main survey ...92
Figure 5.4 QAS section for an item that is new in the main survey ...93
Figure 5.5 PISA 2009 main survey Booklet FOC report with drop-down menus ...94
Figure 6.1 PISA 2009 Main Survey Coding Design...105
Figure 6.2 Design for the single coding of reading stage 1 ...107
Figure 6.3 Design for the single coding of reading stage 2 ...107
Figure 6.4 Design for the single coding of mathematics, stage 1 ...108
Figure 6.5 Design for the single coding of mathematics, stage 2 ...109
Figure 6.6 Design for the single coding of science, stage 1 ...109
Figure 6.7 Design for the single coding of science, stage 2 ...109
Figure 6.8 Design for the multiple coding of reading, stages 3 and 4 ...110
Figure 6.9 Design for the multiple coding of mathematics, stages 3 and 4 ...111
Figure 6.10 Design for the multiple coding of science, stages 3 and 4 ...111
Figure 9.1 Main screen ...133
Figure 9.2 Example of scatter plot ...134
Figure 9.3 Example of item statistics in tabular form ...135
Figure 9.4 Example of graphical summary by item report ...137
Figure 9.5 Example of an international list of dodgy items ...139
Figure 10.1 Data management in relation to other parts of PISA ...148
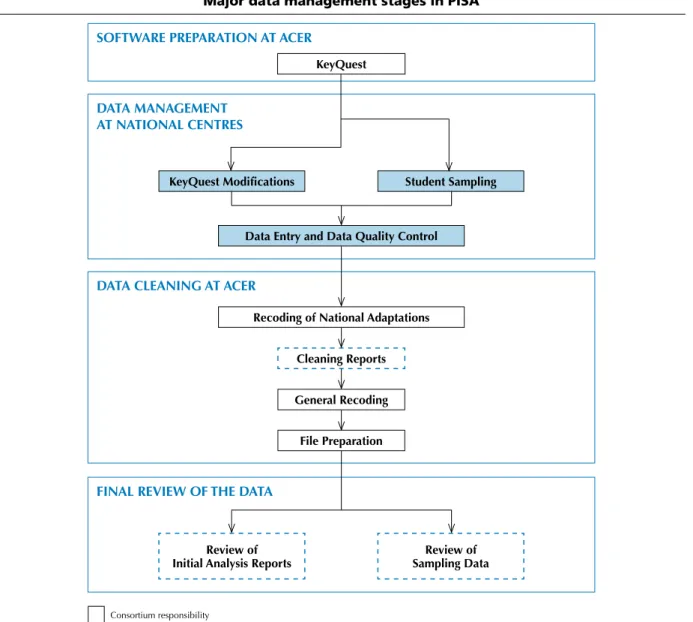
Figure 10.2 Major data management stages in PISA...149
Figure 10.3 Validity reports – general hierarchy ...152
Figure 12.1 Item plot for mathematics items ...190
Figure 12.2 Item plot for reading items ...191
Figure 12.3
Item plot for science items ...192
Figure 12.4 Item plot for DRA items ...193
Figure 12.5 Scatter plot of percentage correct for reading link items in PISA 2000 and PISA 2003 ...217
table of contents
Figure 12.7 Scatter plot of percentage correct for reading link items in PISA 2000 and PISA 2009 ...219
Figure 12.8 Scatter plot of percentage correct for mathematics space and shape and change and relationships link items in PISA 2000 and PISA 2003 ...221
Figure 12.9 Scatter plot of percentage correct for mathematics link items in PISA 2003 and PISA 2006 ...223
Figure 12.10 Scatter plot of percentage correct for mathematics link items in PISA 2006 and PISA 2009 ...224
Figure 12.11 Scatter plot of percentage correct for science link items in PISA 2000 and PISA 2003 ...226
Figure 12.12 Scatter plot of percentage correct for science link items in PISA 2003 and PISA 2006 ...227
Figure 12.13 Scatter plot of percentage correct for science link items in PISA 2006 and PISA 2009 ...229
Figure 14.1 Attained school response rates ...251
Figure 15.1 The relationship between items and students on a proficiency scale ...259
Figure 15.2 What it means to be at a level ...262
Figure 15.3 A map for selected print reading items ...264
Figure 15.4 Summary descriptions of the seven proficiency levels on the print reading scale ...267
Figure 15.5 Summary descriptions of the seven proficiency levels on the print reading aspect subscale access and retrieve ...268
Figure 15.6 Summary descriptions of the seven proficiency levels on the print reading aspect subscale integrate and interpret ...269
Figure 15.7 Summary descriptions of the seven proficiency levels on the print reading aspect subscale reflect and evaluate ...270
Figure 15.8 Summary descriptions of the seven proficiency levels on the print reading text format subscale continuous texts ...271
Figure 15.9 Summary descriptions of the seven proficiency levels on the print reading text format subscale non-continuous texts ...272
Figure 15.10 A map for selected digital reading items ...273
Figure 15.11 Summary descriptions of the four proficiency levels on the digital reading scale ...276
Figure 16.1
Summed category probabilities for fictitious item ...286
Figure 16.2
Fictitious example of item map ...287
Figure 17.1 Editing an XLIFF file ...318
Figure 17.2 DRA coding roles ...322
TABLES
Table 1.1 PISA 2009 participants ... 23Table 2.1 Cluster rotation design used to form standard test booklets for PISA 2009 ... 30
Table 2.2 Cluster rotation design used to form all test booklets for PISA 2009 ... 30
Table 2.3 Digital reading assessment test design ... 31
Table 2.4 Test development timeline for PISA 2009 ... 32
Table 2.5 Print reading field trial cognitive items ... 37
Table 2.6 Average ratings for DRA tasks from national centres ... 38
Table 2.7 Allocation of item clusters to test booklets for field trial ... 39
Table 2.14 Print reading main survey items in standard and easy tests (text type %) ...42
Table 2.15 Print reading main survey items in standard and easy tests (situation %) ...42
Table 2.16 Digital reading main survey items (item format by aspect) ...42
Table 2.17 Digital reading main survey items (environment by text format) ...43
Table 2.18 Digital reading main survey items (text type by aspect) ...43
Table 2.19 Mathematics main survey items (item format by competency cluster) ...43
Table 2.20 Mathematics main survey items (item format by content category) ...43
Table 2.21 Mathematics main survey items (content category by competency cluster) ...43
Table 2.22 Science main study items (item format by competency) ...44
Table 2.23 Science main study items (item format by knowledge type) ...44
Table 2.24 Science main study items (knowledge category by competency) ...44
Table 4.1 Stratification variables used in PISA 2009 ...64
Table 4.2 Schedule of school sampling activities ...72
Table 4.3 Sampling frame unit ...77
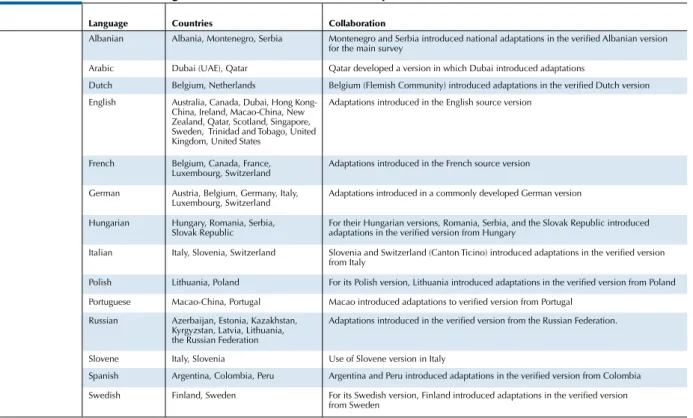
Table 5.1 Countries sharing a common version with national adaptations ...85
Table 5.2 PISA 2009 translation/adaptation procedures ...85
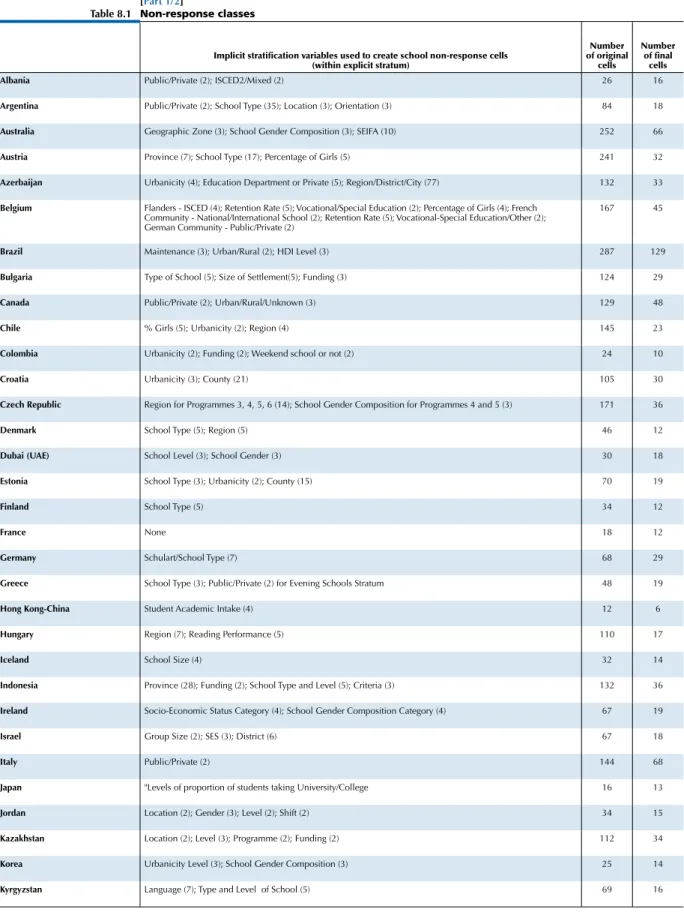
Table 8.1 Non-response classes ...123
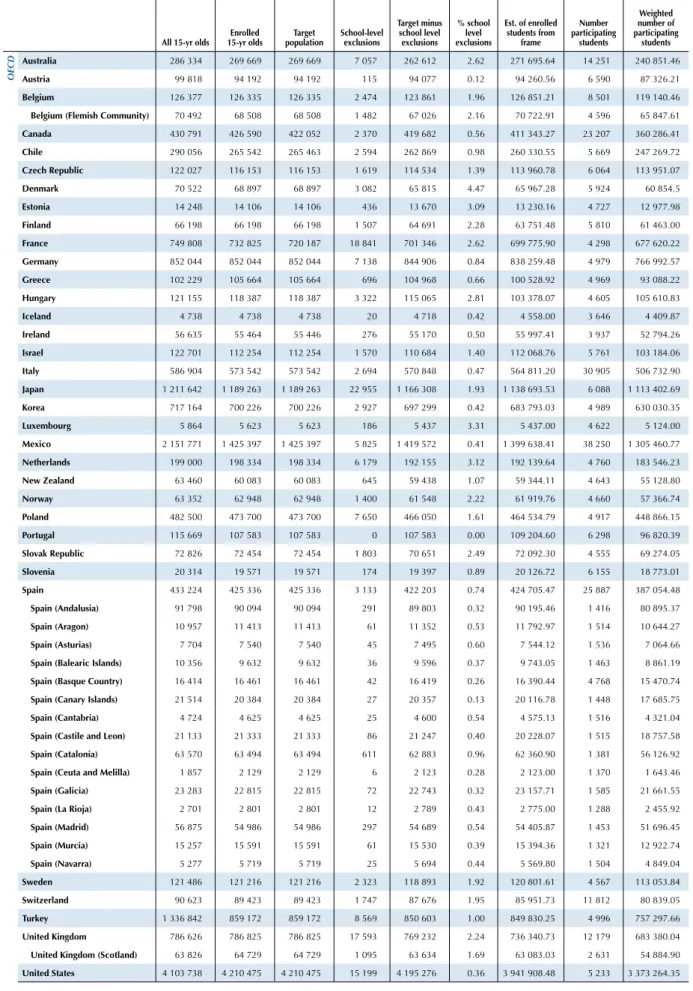
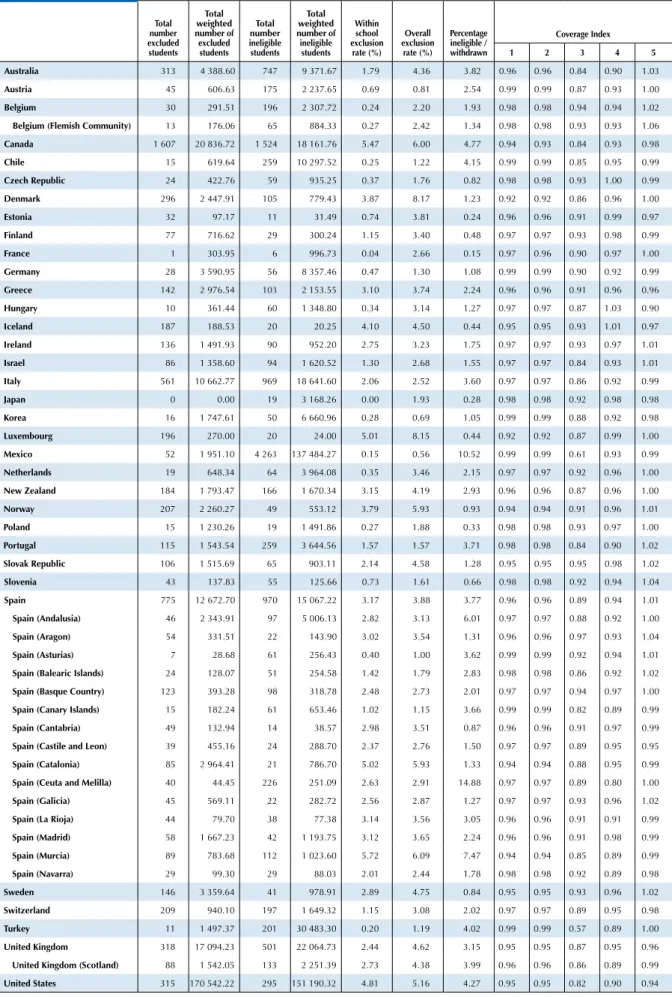
Table 11.1 Sampling and coverage rates ...158
Table 11.2 School response rates before replacement ...163
Table 11.3 School response rates after replacement ...165
Table 11.4 Student response rates after replacement ...166
Table 11.5 Standard errors for the PISA 2009 reading scale ...169
Table 11.6 Design effect 1 by country, by domain and cycle ...173
Table 11.7 Effective sample size 1 by country, by domain and cycle ...174
Table 11.8 Design effect 2 by country, by domain and cycle ...175
Table 11.9 Effective sample size 2 by country, by domain and cycle ...176
Table 11.10 Design effect 3 by country, by domain and cycle ...177
Table 11.11 Effective sample size 3 by country, by domain and cycle ...178
Table 11.12 Design effect 4 by country, by domain and cycle ...179
Table 11.13 Effective sample size 4 by country, by domain and cycle ...180
Table 11.14 Design effect 5 by country, by domain and cycle ...181
Table 11.15 Effective sample size 5 by country, by domain and cycle ...182
Table 11.16 Median of the design effect 3 per cycle and per domain across the 35 countries that participated in every cycle ...183
Table 11.17 Median of the standard errors of the student performance mean estimate for each domain and PISA cycle for the 35 countries that participated in every cycle ...183
Table 11.18 Median of the number of participating schools for each domain and PISA cycle for the 35 countries that participated in every cycle ...184
Table 11.19 Median of the school variance estimate for each domain and PISA cycle for the 35 countries that participated in every cycle ...184
table of contents
Table 11.20 Median of the intraclass correlation for each domain and PISA cycle for the 35 countries
that participated in every cycle ... 184
Table 11.21 Median of the within explicit strata intraclass correlation for each domain and PISA cycle for the 35 countries that participated in every cycle ... 184
Table 11.22 Median of the percentages of school variances explained by explicit stratification variables, for each domain and PISA cycle for the 35 countries that participated in every cycle ... 185
Table 11.23 DRA student sampling outcomes ... 186
Table 11.24 DRA school sampling outcomes ... 186
Table 12.1 Number of sampled students by country and booklet ... 188
Table 12.2 Number of sampled students by country and DRA test form code... 189
Table 12.3 Reliabilities and Measurement Error Design Effect of each of the three overall scales when scaled separately ... 194
Table 12.4 Latent correlation between the three domains ... 194
Table 12.5 Latent correlation between the four domains ... 194
Table 12.6 Latent correlation between the aspect reading scales ... 195
Table 12.7 Latent correlation between text format reading scales ... 195
Table 12.8 Items deleted at the national level ... 196
Table 12.9 Final reliabilities of the PISA scales ... 198
Table 12.10 National reliabilities of the PISA scales ... 198
Table 12.11 Average number of not-reached items and missing items by booklet ... 200
Table 12.12 Average number of not-reached items and missing items by DRA TestID... 200
Table 12.13 Average number of not-reached items and missing items by country ... 201
Table 12.14 Average number of DRA not-reached items and missing items by country ... 202
Table 12.15 Distribution of not-reached items by booklet ... 202
Table 12.16 Distribution of not-reached items by DRA TestID ... 203
Table 12.17 Estimated booklet effects in logits ... 203
Table 12.18 Estimated booklet effects on the PISA scale ... 204
Table 12.19 Variance in mathematics booklet means ... 205
Table 12.20 Variance in reading booklet means ... 207
Table 12.21 Variance in science booklet means ... 209
Table 12.22 Variance in DRA booklet means ... 211
Table 12.23 Summary of PISA cognitive reporting scales ... 212
Table 12.24 Linkage types among PISA domains 2000-09 ... 213
Table 12.25 Number of unique item minutes for each domain for each PISA assessments ... 215
Table 12.26 Numbers of link items between successive PISA assessments* ... 215
Table 12.27 International percent correct for reading link items in PISA 2000 and PISA 2003 ... 216
Table 12.28 International percent correct for reading link items in PISA 2003 and PISA 2006 ... 218
Table 12.29 International percent correct for reading link items in PISA 2000 and PISA 2009 ... 219
Table 12.30 International percent correct for mathematics link items in PISA 2000 and PISA 2003 ... 220
Table 12.36 Link error estimates ... 230
Table 13.1 Examples of various indices calculated on country-by-language level ... 235
Table 13.2 International item reliability indices (Ti) ... 236
Table 13.3 National domain reliability indices ... 238
Table 13.4 Examples of an initially lenient result and a neutral result ... 239
Table 13.5 Examples of flagged cases ... 239
Table 13.6 Percentage of flagged records for Booklet 8 ICR items ... 240
Table 13.7 Percentage of flagged records for Booklet 12 ICR items ... 242
Table 13.8 Leniency/Harshness analysis ... 244
Table 15.1 Reading literacy performance band definitions on the PISA scale ... 266
Table 15.2 Digital and print reading literacy performance band definitions on the PISA scale ... 275
Table 16.1 ISCO major group white-collar/blue-collar classification ... 282
Table 16.2 OECD means and standard deviations of WLEs ... 285
Table 16.3 Household possessions and home background indices ... 288
Table 16.4 Scale reliabilities for home possession indices in OECD countries ... 289
Table 16.5 Scale reliabilities for home possession indices in partner countries ... 290
Table 16.6 Item parameters for enjoyment of reading (JOYREAD) ... 290
Table 16.7 Item parameters for reading diversity (DIVREAD) ... 291
Table 16.8 Scale reliabilities for enjoyment of reading and diversity of reading and latent correlations in OECD countries ... 291
Table 16.9 Scale reliabilities for enjoyment of reading and diversity of reading and latent correlations in partner countries ...292
Table 16.10 Item parameters for online reading (ONLNREAD) ... 292
Table 16.11 Scale reliabilities for online reading ... 293
Table 16.12 Item parameters for memorisation strategies (MEMOR) ... 293
Table 16.13 Item parameters for elaboration strategies (ELAB) ... 293
Table 16.14 Item parameters for control strategies (CSTRAT) ... 293
Table 16.15 Scale reliabilities for learning strategies in OECD countries ... 294
Table 16.16 Scale reliabilities for learning strategies in partner countries ... 294
Table 16.17 Item parameters for attitude towards school (ATSCHL) ... 295
Table 16.18 Scale reliabilities for attitude towards school ... 295
Table 16.19 Item parameters for teacher student relations (STUDREL) ... 296
Table 16.20 Item parameters for disciplinary climate (DISCLIMA) ... 296
Table 16.21 Scale reliabilities for disciplinary climate and teacher student relations and latent correlations in OECD countries ...296
Table 16.22 Scale reliabilities for disciplinary climate and teacher student relations and latent correlations in partner countries ... 297
Table 16.23 Item parameters for teachers’ stimulation of reading engagement (STIMREAD) ... 297
Table 16.24 Item parameters for teachers’ use of structuring and scaffolding strategies (STRSTRAT)... 298
Table 16.25 Scale reliabilities for teachers’ stimulation of reading and teaching strategies and latent correlations in OECD countries ... 298
Table 16.26 Scale reliabilities for teachers’ stimulation of reading and teaching strategies and latent correlations in partner countries ... 299
Table 16.27 Item parameters for library use (LIBUSE) ... 299
table of contents
Table 16.29 Item parameters for ICT availability at home (ICTHOME) ... 300
Table 16.30 Item parameters for ICT availability at school (ICTSCH) ... 301
Table 16.31 Scale reliabilities for ICT availability at home and ICT availability at school in OECD countries ... 301
Table 16.32 Scale reliabilities for ICT availability at home and ICT availability at school in partner countries ... 301
Table 16.33 Item parameters for ICT entertainment use (ENTUSE) ... 302
Table 16.34 Scale reliabilities for ICT entertainment use ... 302
Table 16.35 Item parameters for ICT use at home for school related tasks (HOMSCH) ... 302
Table 16.36 Item parameters for use of ICT at school (USESCH) ... 303
Table 16.37 Scale reliabilities for ICT use at home for school related tasks and for use of ICT at school in OECD countries ... 303
Table 16.38 Scale reliabilities for ICT use at home for school related tasks and for use of ICT at school in partner countries ... 304
Table 16.39 Item parameters for ICT self-confidence in high-level ICT tasks (HIGHCONF) ... 304
Table 16.40 Scale reliabilities for confidence in high level ICT tasks ... 305
Table 16.41 Item parameters for attitude towards computers (ATTCOMP) ... 305
Table 16.42 Scale reliabilities for attitude towards computers ... 306
Table 16.43 Item parameters for teacher shortage (TCSHORT) ... 306
Table 16.44 Item parameters for quality of educational resources (SCMATEDU) ... 306
Table 16.45 Item parameters for teacher participation (EXCURACT) ... 307
Table 16.46 Item parameters for school principal leadership (LDRSHP) ... 307
Table 16.47 Item parameters for teacher participation (TCHPARTI) ... 308
Table 16.48 Item parameters for teacher-related factors affecting school climate (TEACBEHA) ... 308
Table 16.49 Item parameters for student-related aspects of school climate (STUDBEHA) ... 308
Table 16.50 Scale reliabilities for school-level scales in OECD countries ... 309
Table 16.51 Scale reliabilities for school-level scales in partner countries ... 309
Table 16.52 Item parameters for parents’ perception of school quality (PQSCHOOL) ... 310
Table 16.53 Item parameters for parental involvement (PARINVOL) ... 310
Table 16.54 Item parameters for students’ reading resources at home (READRES) ... 310
Table 16.55 Item parameters for parents’ current support of child’s reading literacy (CURSUPP) ... 311
Table 16.56 Item parameters for parental support of child’s reading literacy at beginning of ISCED 1 (PRESUPP) ... 311
Table 16.57 Item parameters for motivational attributes of parents’ own reading engagement (MOTREAD) ... 311
Table 16.58 Scale reliabilities for parent questionnaire scales ... 312
Table 16.59 Factor loadings and internal consistency of ESCS 2009 in OECD countries ... 313
Table 16.60 Factor loadings and internal consistency of ESCS 2009 in partner countries ... 314
Table 16.61 ESCS component weights in 2000, 2003, 2006 and 2009 ... 315
Table A.1 2009 Main study mathematics item classification ... 336
Table A.2 2009 Main study reading item classification ... 337
Table A.3 2009 Main study science item classification ... 341
Table A.4 2009 Main study DRA item classification ... 343
Table B.6 2009 Main study contrast coding used in conditioning for other variables ... 352
Table C.1 Standard errors of the student performance mean estimate by country, by domain and cycle ... 353
Table C.2 Sample sizes by country and cycle ... 354
Table C.3 School variance estimate by country, by domain and cycle ... 355
Table C.4 Intraclass correlation by country, by domain and cycle ... 356
Table C.5 Within explicit strata intraclass correlation by country, by domain and cycle ... 357
Table C.6 Percentage of school variance explained by explicit stratification variables by country, by domain and cycle ... 358
Table D.1 ST 09 to 06 Link ... 359
Table D.2 IC06 to 03 Link ... 360
Table D.3 SC06 to 03 Link ... 361
Table E.1 Mapping of ISCED to years ... 364
Table F.1 National household possession items ... 365
Reader’s Guide
ACER: Australian Council for Educational Research
aSPe: University of Liege, Belgium
BAS: Booklet Adaptation Spreadsheet
BRR: Balanced Repeated Replication
CBAS: Computer Based Assessment of Science
CITO: National Institute for Educational Measurement, the Netherlands
DIF: Differential Item Functioning
DIPF: The German Institute for International Educational Research
DRA: Digital Reading Assessment
DTCS: DRA Target Cluster Size
EAW: DRA Adaptation Workbook
ENR: Enrolment of 15-year-olds
ESCS: PISA Index of Educational, Social and Cultural Status
ETS: Educational Testing Service
FOC: Final Optical Check
I: Sampling Interval
IALS: International Adult Literacy Survey
ICR: Inter-Country Coder Reliability Study
ICT: Information Communication
Technology
IEA: International Association for
the Evaluation of Educational Achievement
ILS: University of Oslo, Norway
INES: OECD Indicators of Education
Systems
INT: International
IPN: Leibniz Institute for Science and
Mathematics Education, Germany
IRT: Item Response Theory
ISCED: International Standard Classification of Education
ISCO: International Standard Classification of Occupations
MENR: Enrolment for moderately small school
MNSQ: Mean square MOS: Measure of size
NCQM: National Centre Quality Monitor
NEP: National Enrolled Population
NIER: National Institute for Educational Research, Japan
NPM: National Project Manager OECD: Organisation for Economic
Co-operation and Development
OLT: Open Language Tool
PCA: Principal Component Analysis
PISA: Programme for International Student
Assessment
PPS: Probability Proportional to Size
PGB: PISA Governing Board
PQM: PISA Quality Monitor
PV: Plausible Values
QAS: Questionnaire Adaptations
Spreadsheet
RN: Random Number
RP: Response Probability
SC: School Co-ordinator
SE: Standard Error
SEN: Special Education Needs
SD: Standard Deviation
SPT: Study Programme Table
TA: Test Administrator
TAG: Technical Advisory Group
TAS: Test Adaptation Spreadsheet
TCS: Target Cluster Size
TIMSS: Third International Mathematics and Science Study
TMS: Translation Management System
UH: Une Heure booklet
VENR: Enrolment for very small schools
1
Programme
for International
Student Assessment:
an Overview
Participation ...23 Features of PISA ...24Managing and implementing PISA ...24
The OECD Programme for International Student Assessment (PISA) is a collaborative effort among OECD member countries to measure how well 15-year-old students approaching the end of compulsory schooling are prepared to meet the challenges of today’s knowledge societies. The assessment is forward-looking: rather than focusing on the extent to which these students have mastered a specific school curriculum, it looks at their ability to use their knowledge and skills to meet real-life challenges. This orientation reflects a change in curricular goals and objectives, which are increasingly concerned with what students can do with what they learn at school.
PISA surveys take place every three years. The first survey took place in 2000 (followed by a further 11 countries in 2002), the second in 2003, the third in 2006, and the fourth in 2009; the results of these surveys have been published in a series of reports (OECD, 2001, 2003, 2004, 2007, 2010 - see Annex I) and a wide range of thematic and technical reports. The next survey will occur in 2012. For each assessment, one of science, reading and mathematics is chosen as the major domain and given greater emphasis. The remaining two areas, the minor domains, are assessed less thoroughly. In 2000 the major domain was reading; in 2003 it was mathematics; in 2006 it was science and in 2009 it was reading. PISA is an age-based survey, assessing 15-year-old students in school in grade 7 or higher. These students are approaching the end of compulsory schooling in most participating countries, and school enrolment at this level is close to universal in almost all OECD countries.
The PISA assessments take a literacy perspective, which focuses on the extent to which students can apply the knowledge and skills they have learned and practised at school when confronted with situations and challenges for which that knowledge may be relevant. That is, PISA assesses: the extent to which students can use their reading skills to understand and interpret the various kinds of written material that they are likely to meet as they negotiate their daily lives; the extent to which students can use their mathematical knowledge and skills to solve various kinds of numerical and spatial challenges and problems; and the extent to which students can use their scientific knowledge and skills to understand, interpret and resolve various kinds of scientific situations and challenges. The PISA 2009 domain definitions
are fully articulated in PISA 2009 Assessment Framework – Key Competencies in Reading, Mathematics and Science
(OECD, 2010a).
PISA also allows for the assessment of additional cross-curricular competencies from time to time as participating countries see fit. For example, in PISA 2003, an assessment of general problem-solving competencies was included. A major addition for PISA 2009 was the inclusion of a computer-delivered assessment of digital reading which is also known as the digital reading assessment.
PISA also uses student questionnaires to collect information from students on various aspects of their home, family and school background, and school questionnaires to collect information from schools about various aspects of organisation
and educational provision in schools. In PISA 2009, 14 countries1 also administered a parent questionnaire to the parents
of the students participating in PISA.
Using the data from student, parent and school questionnaires, analyses linking contextual information with student achievement could address:
• differences between countries in the relationships between student-level factors (such as gender and socio-economic
background) and achievement;
• differences in the relationships between school-level factors and achievement across countries;
• differences in the proportion of variation in achievement between (rather than within) schools, and differences in this
value across countries;
• differences between countries in the extent to which schools moderate or increase the effects of individual-level
student factors and student achievement;
• differences in education systems and national context that are related to differences in student achievement across
countries; and
• through links to PISA 2000, PISA 2003 and PISA 2006, changes in any or all of these relationships over time.
Through the collection of such information at the student and school level on a cross-nationally comparable basis, PISA adds significantly to the knowledge base that was previously available from national official statistics, such as aggregate national statistics on the educational programmes completed and the qualifications obtained by individuals.
The framework for the PISA 2009 questionnaires is included in PISA 2009 Assessment Framework – Key Competencies
1 Programme for InternatIonal Student aSSeSSment: an overvIew
ParticiPation
The first PISA survey was conducted in 2000 in 32 countries (including 28 OECD member countries) using written tasks answered in schools under independently supervised test conditions. Another 11 countries completed the same assessment in 2002. PISA 2000 surveyed reading, mathematical and scientific literacy, with a primary focus on reading. The second PISA survey, conducted in 2003 in 41 countries, assessed reading, mathematical and scientific literacy, and problem solving with a primary focus on mathematical literacy. The third survey covered reading, mathematical and scientific literacy, with a primary focus on scientific literacy, and was conducted in 2006 in 57 countries. For a number of participants detailed analysis was also undertaken for sub-national regions. In all there were 24 sub-national regions for which sufficient data was collected and quality control mechanisms implemented to permit OECD endorsement of their results.
PISA 2009, the fourth PISA survey covered reading, mathematical and scientific literacy, with a primary focus on reading literacy, and was conducted in 65 countries. The participants in PISA 2009 are listed in Table 1.1. As with PISA 2006, detailed results were also presented for 17 sub-national regions for which sufficient data was collected and quality control mechanisms implemented to permit OECD endorsement of their results. Table 1.1 also indicates the 19 countries that participated in the computer-delivered assessment of digital reading.
This report is concerned with the technical aspects of PISA 2009.
table 1.1 PiSa 2009 participants
oeCd countries Partner countries/economies australia* albania
austria* argentina Belgium* azerbaijan
Canada Brazil Chile* Bulgaria Czech republic Colombia*
denmark* Croatia estonia dubai (uae) Finland hong Kong-China* France* Indonesia germany jordan greece Kazakhstan hungary* Kyrgyzstan Iceland* Latvia Ireland* Liechtenstein Israel Lithuania Italy macao-China* japan* montenegro Korea* Panama Luxembourg Peru mexico Qatar netherlands romania new Zealand* russian Federation
norway* Serbia Poland* Shanghai-China Portugal Singapore Slovak republic Chinese taipei
Slovenia thailand Spain* trinidad and tobago Sweden* tunisia
FeatureS oF PiSa
The technical characteristics of the PISA survey involve a number of different challenges:
• the design of the test and the features incorporated into the test developed for PISA are critical;
• the sampling design, including both the school sampling and the student sampling requirements and procedures;
• the multilingual nature of the test, which involves rules and procedures designed to guarantee the equivalence of
the different language versions used within and between participating countries, and taking into account the diverse cultural contexts of those countries;
• various operational procedures, including test administration arrangements, data capture and processing and quality
assurance mechanisms designed to ensure the generation of comparable data from all countries; and
• scaling and analysis of the data and their subsequent reporting: PISA employs scaling models based on item response
theory (IRT) methodologies. The described proficiency scales, which are the basic tool in reporting PISA outcomes, are derived using IRT analysis.
This report describes the above-mentioned methodologies as they have been implemented in PISA 2009. It also describes the quality assurance procedures that have enabled PISA to provide high quality data to support policy formation and review. Box 1.1 provides an overview of the central design elements of PISA 2009.
The ambitious goals of PISA come at a cost: PISA is both resource intensive and methodologically complex, requiring intensive collaboration among many stakeholders. The successful implementation of PISA depends on the use, and sometimes further development, of state-of-the-art methodologies.
Quality within each of these areas is defined, monitored and assured through the use of a set of technical standards. These standards have been endorsed by the PISA Governing Board, and they form the backbone of implementation in each participating country and of quality assurance across the project (see Annex G for the PISA 2009 Technical Standards).
Managing and iMPleMenting PiSa
The design and implementation of PISA for the 2000, 2003 and 2006 data collections was the responsibility of an international consortium led by the Australian Council for Educational Research (ACER) with Ray Adams as International Project Director. The other partners in this Consortium were the National Institute for Educational Measurement (Cito) in the Netherlands, the Unité d’analyse des systèmes et pratiques d’enseignement (aSPe) and cApStAn Linguistic Quality Control in Belgium, the Deutches Institut für Internationale Pädagogische Forschung (DIPF) in Germany, Westat and the Educational Testing Service (ETS) in the United States, and the National Institute for Educational Policy Research (NIER) in Japan.
The responsibility for the implementation of PISA in 2009 was the shared responsibility of two consortia. One Consortium led by Cito was responsible for design, development and scaling of the contextual questionnaires – this Consortium included the University of Twente – Faculty of Behavioural Science in the Netherlands, the University of Jyväskylä – Institute for Educational Research in Finland and the Direction de l’Évaluation et de la Prospective, Ministère de l’Éducation Nationale in France. A second Consortium led by ACER was responsible for all remaining aspects of the 2009 data collection. Annex H lists the consortia staff and consultants who have made significant contributions to the development and implementation of the project.
PISA is implemented within a framework established by the PISA Governing Board (PGB) which includes representation from all participating countries at senior policy levels. The PGB established policy priorities and standards for developing indicators, for establishing assessment instruments, and for reporting results. Experts from participating countries served on working groups linking the programme policy objectives with the best internationally available technical expertise in the three assessment areas.
These expert groups were referred to as Subject Matter Expert Groups (SMEGs) (see Annex H for members). By participating in these expert groups and regularly reviewing outcomes of the groups’ meetings, countries ensured that the instruments were internationally valid, that they took the cultural and educational contexts of the different OECD member countries into account, that the assessment materials had strong measurement potential, and that the instruments emphasised authenticity and educational validity.
1 Programme for InternatIonal Student aSSeSSment: an overvIew
Box 1.1 Key features of PiSa 2009
Content
• The main focus of PISA 2009 was reading. The survey also updated performance assessments in mathematics and science. PISA considers students’ knowledge in these areas not in isolation, but in relation to their ability to reflect on their knowledge and experience, and to apply them to real-world issues. The emphasis is on mastering processes, understanding concepts and functioning in various situations within each assessment area.
• For the first time, the PISA 2009 survey also assessed 15-year-old students’ ability to read, understand and apply digital texts.
Methods
• Around 470 000 students completed the assessment in 2009, representing about 26 million 15-year-olds in the schools of the 65 participating countries and economies. Some 50 000 students took part in a second round of this assessment in 2010, representing about 2 million 15 year-olds from 9 additional partner countries and economies.
• Each participating student spent two hours carrying out pencil-and-paper tasks in reading, mathematics and science. In 19 countries, students were given additional questions via computer to assess their capacity to read digital texts.
• The assessment included tasks requiring students to construct their own answers as well as multiple-choice questions. The latter were typically organised in units based on a written passage or graphic, much like the kind of texts or figures that students might encounter in real life.
• Students also answered a questionnaire that took about 30 minutes to complete. This questionnaire focused on their personal background, their learning habits, their attitudes towards reading, and their engagement and motivation.
• School principals completed a questionnaire about their school that included demographic characteristics and an assessment of the quality of the learning environment at school.
Outcomes
PISA 2009 results provide:
• A profile of knowledge and skills among 15-year-olds in 2009, consisting of a detailed profile for reading, including digital literacy, and an update for mathematics and science.
• Contextual indicators relating performance results to student and school characteristics.
• An assessment of students’ engagement in reading activities, and their knowledge and use of different learning strategies.
• A knowledge base for policy research and analysis.
• Trend data on changes in student knowledge and skills in reading, mathematics and science, on change in student attitudes and in socio-economic indicators, and also on the impact of some indicators on the performance results.
Future assessments
• The PISA 2012 survey will return to mathematics as the major assessment area; PISA 2015 will focus on science. Thereafter, PISA will turn to another cycle, beginning with reading again.
• Future tests will place greater emphasis on assessing students’ capacity to read and understand digital texts and solve problems given in a digital format, reflecting the importance of information and computer technologies in modern societies.
Each of the participating countries appointed a National Project Manager (NPM), to implement PISA nationally. The NPMs ensured that internationally agreed common technical and administrative procedures were employed. These managers played a vital role in developing and validating the international assessment instruments and ensured that PISA implementation was of high quality. The NPMs also contributed to the verification and evaluation of the survey results, analyses and reports.
The OECD Secretariat was responsible for the overall management of the programme. It monitored its implementation on a day-to-day basis, served as the secretariat for the PGB, fostered consensus building between the countries involved,
organiSation oF thiS rePort
This technical report is designed to describe the technical aspects of the project at a sufficient level of detail to enable review and, potentially, replication of the implemented procedures and technical solutions to problems. It, therefore,
does not report the results of PISA 2009 which have been published in PISA 2009 Results (OECD, 2010b). A bibliography
of other PISA related reports is included in Annex I. There are five sections in this report:
• Section One – Instrument design: describes the design and development of both the questionnaires and achievement tests.
• Section Two – Operations: gives details of the operational procedures for the sampling and population definitions, test administration procedures, quality monitoring and assurance procedures for test administration and national centre operations, and instrument translation.
• Section Three – Data processing: covers the methods used in data cleaning and preparation, including the methods for weighting and variance estimation, scaling methods, methods for examining inter-rater variation and the data cleaning steps.
• Section Four – Quality indicators and outcomes: covers the results of the scaling and weighting, report response rates and related sampling outcomes and gives the outcomes of the inter-rater reliability studies. The last chapter in this section summarises the outcomes of the PISA 2009 data adjudication; that is, the overall analysis of data quality for each country.
• Section Five – Scale construction and data products: describes the construction of the PISA 2009 described levels of proficiency and the construction and validation of questionnaire-related indices. The final chapter briefly describes
the contents of the PISA 2009 Database.
Detailed annexes of results pertaining to the chapters of the report are also provided.
Note
1. The PISA 2009 Parent Questionnaire was administered in eight OECD countries – Chile, Denmark, Germany, Hungary, Italy, Korea, New Zealand and Portugal, and in six partner countries and economies – Croatia, Hong Kong-China, Lithuania, Macao-China, Panama and Qatar.
2
Test Design
and Test Development
Test scope and format ...28Test design ...29
Test development centres ...31
Development timeline ...31
The PISA 2009 reading literacy framework...32
Item development process ...33
Field trial ...37
This chapter describes the test design for PISA 2009 and the processes by which the PISA Consortium, led by ACER, developed the PISA 2009 paper-and-pencil tests for reading, mathematics and science. It also describes the design and development of the computer-based assessment of reading, the digital reading assessment, an innovation in PISA 2009. In the following discussion, the term “reading” generally refers to the core, paper-based reading assessment. The computer-based assessment is referred to as the “digital reading assessment”.
teSt ScoPe and ForMat
Paper and pencil assessment
In PISA 2009 three subject domains were tested, with reading as the major domain for the second time in a PISA administration and mathematics and science as minor domains.
PISA items are arranged in units based around a common stimulus. Many different types of stimulus are used including passages of text, tables, graphs and diagrams, often in combination. Each unit contains up to five items assessing students’ competencies and knowledge.
For the paper-and-pencil assessment there were 37 reading units, comprising a total of 1311 cognitive items, representing
approximately 270 minutes of testing time for reading in PISA 2009. The mathematics assessment consisted of 342 items
(18 units), a subset of the 48 items used in 2006, representing 90 minutes of testing time. The science assessment consisted of 53 items (18 units), also representing 90 minutes of testing time. The science items were selected from the 108 cognitive items used in 2006.
The 131 cognitive reading items used in the main survey included 26 items from the 2000 test that had been used for linking in 2003 and 2006. A further 11 items from PISA 2000, not used since that administration, were also included. The remaining 94 items were newly developed for PISA 2009. The 11 items retrieved from PISA 2000 and the 94 new items were selected, respectively, from a pool of 24 items retrieved from PISA 2000 and 188 newly-developed items that were tested in a field trial conducted in all countries in 2008, one year prior to the main survey. There was no new item development for mathematics or science.
Item formats employed with reading cognitive items were either selected response multiple choice or constructed response. Multiple-choice items were either standard multiple-choice with four (or in a small number of cases, five) responses from which students were required to select the best answer, or complex multiple-choice presenting several statements for each of which students were required to choose one of several possible responses (yes/no, true/false, correct/incorrect, etc.). Constructed response items were of three broad types. Closed-constructed response items required students to construct a numeric response within very limited constraints, or only required a word or short phrase as the answer. Short response items required a response generated by the student, with a limited range of possible full-credit answers. Open-constructed response items required more extensive writing and frequently required some explanation or justification.
Pencils, erasers, rulers, and in some cases calculators, were provided. It was recommended that calculators be provided in countries where they were routinely used in the classroom. National centres decided whether calculators should be provided for their students on the basis of standard national practice. No test items required a calculator, but some mathematics items involved solution steps for which the use of a calculator could be of assistance to some students.
Digital Reading Assessment (DRA)
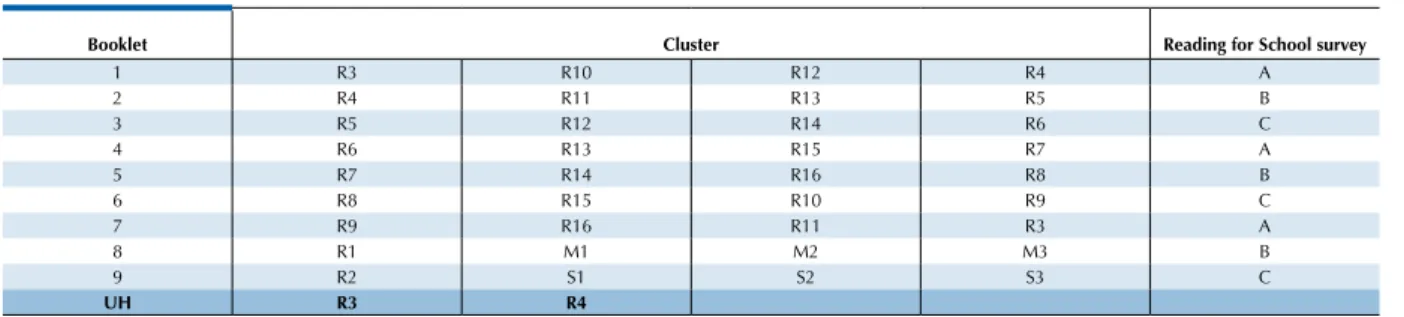
For PISA 2009, countries were offered an assessment of reading in a digital environment (DRA), as an international option. As with the paper-and-pencil assessment of reading, digital reading items are arranged in units based around a common stimulus, but the stimulus used in the digital reading assessment comprises digital texts with the structures and features of websites, e-mails, blogs and so on. Each unit contains up to four items assessing students’ competencies and knowledge. The digital reading assessment comprised nine units, with a total of 29 items, representing approximately 60 minutes of testing time. These items were selected from a pool of 72 newly-developed digital reading items that were tested in a field trial conducted in all countries participating in the international option in 2008, one year prior to the main survey. In the digital reading assessment, the screen has two areas: a browser area, in which the stimulus is displayed, and a task area, in which the questions are provided. Figure 2.1 shows the screen layout.
2 TesT design and TesT developmenT
For most items, students provided their responses in the task area. Item formats employed were selected response or constructed response. Most of the selected-response items were in multiple-choice format of the standard type, in which students are required to select the best answer from a set of four options in the task area. A variation on multiple-choice, exploiting the interactive possibilities of the medium, involves students selecting an option from a dropdown menu in the browser area. Open-constructed response items require more extensive writing and frequently require some explanation or justification. Responses were given either in a text box in the task area, or, where appropriate, in the browser area in the form of an e-mail message.
teSt deSign
Paper-based assessment
The standard main survey items were allocated to thirteen item clusters (seven reading clusters, three mathematics clusters and three science clusters) with each cluster representing 30 minutes of test time. The items were presented to students in thirteen standard test booklets, with each booklet being composed of four clusters. R1 to R7 denote the reading clusters, M1 to M3 denote the mathematics clusters, and S1 to S3 denote the science clusters. R1 and R2 were the same two reading clusters as those administered in 2003 and 2006. The mathematics clusters were three of the four intact clusters used in 2006 (M1 from 2006 was omitted). The three science clusters were not intact clusters from PISA 2006; items were selected from across the 2006 main survey pool to represent that pool as closely as possible in terms of competency and knowledge classifications, item format types, range of difficulty, layout and cluster position.
In addition to the thirteen two-hour booklets, a special one-hour booklet, referred to as the UH Booklet (Une Heure booklet), was prepared for use in schools catering for students with special needs. The UH Booklet contained about half as many items as the other booklets, with about 50% of the items being reading items, 25% mathematics and
•
Figure 2.1•
Screen layout for the digital reading assessment
Browser area
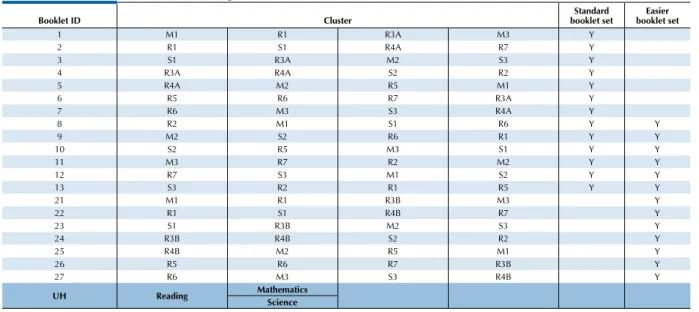
table 2.1 cluster rotation design used to form standard test booklets for PiSa 2009 Booklet Id Cluster 1 M1 R1 R3A M3 2 R1 S1 R4A R7 3 S1 R3A M2 S3 4 R3A R4A S2 R2 5 R4A M2 R5 M1 6 R5 R6 R7 R3A 7 R6 M3 S3 R4A 8 R2 M1 S1 R6 9 M2 S2 R6 R1 10 S2 R5 M3 S1 11 M3 R7 R2 M2 12 R7 S3 M1 S2 13 S3 R2 R1 R5
uh reading mathematicsScience
The fully-linked design is a balanced incomplete block design. Each cluster appears in each of the four possible positions within a booklet once and so each test item appears in four of the test booklets. Another feature of the design is that each pair of clusters appears in one (and only one) booklet.
Each sampled student was randomly assigned one of the thirteen booklets administered in each country, which meant each student undertook two hours of testing. Students were allowed a short break after one hour.
In PISA 2009 some countries were offered the option of administering an easier set of booklets. The offer was made to countries that had achieved a mean scale score in reading of 450 or less in PISA 2006, and to new countries that were expected – judging by their results on the PISA 2009 field trial conducted in 2008 – to gain a mean result at a similar level. The purpose of this strategy was to obtain better descriptive information about what students at the lower end of the ability spectrum know, understand and can do as readers. A further reason for including easier items was to make the experience of the test more satisfying for individual students with very low levels of reading profic