Spatial Selection and Local Adaptation Jointly Shape Life-History
Evolution during Range Expansion
Katrien H. P. Van Petegem,
1,*
,†Jeroen Boeye,
1,†Robby Stoks,
2and Dries Bonte
11. Department of Biology, Terrestrial Ecology Unit, Ghent University, K. L. Ledeganckstraat 35, B-9000 Ghent, Belgium; 2. Laboratory of Aquatic Ecology, Evolution, and Conservation, KU Leuven, Charles Deberiotstraat 32, B-3000 Leuven, Belgium
Submitted October 6, 2015; Accepted July 5, 2016; Electronically published September 19, 2016
Online enhancements:appendix, supplementalfiles.Dryad data:http://dx.doi.org/10.5061/dryad.n0c67.
abstract:In the context of climate change and species invasions, range shifts increasingly gain attention because the rates at which they occur in the Anthropocene induce rapid changes in biological assem-blages. During range shifts, species experience multiple selection
pres-sures. For poleward expansions in particular, it is difficult to interpret
observed evolutionary dynamics because of the joint action of evolu-tionary processes related to spatial selection and to adaptation toward local climatic conditions. To disentangle the effects of these two pro-cesses, we integrated stochastic modeling and data from a common
gar-den experiment, using the spider miteTetranychus urticaeas a model
species. By linking the empirical data with those derived form a highly parameterized individual-based model, we infer that both spatial selec-tion and local adaptaselec-tion contributed to the observed latitudinal life-history divergence. Spatial selection best described variation in dispersal behavior, while variation in development was best explained by adap-tation to the local climate. Divergence in life-history traits in species shifting poleward could consequently be jointly determined by con-temporary evolutionary dynamics resulting from adaptation to the environmental gradient and from spatial selection. The integration of modeling with common garden experiments provides a powerful tool to study the contribution of these evolutionary processes on life-history evolution during range expansion.
Keywords: global change, Tetranychus urticae, quantitative genetic
trait divergence, pattern-oriented modeling, dispersal evolution, saw-tooth pattern.
Introduction
Numerous species are currently shifting their ranges be-cause of contemporary climate change (Parmesan 2006) or are expanding them after being introduced in a new en-vironment (Richardson and Rejmanek 2011). During such
shifts and range expansions, species undergo multiple se-lection pressures (Phillips et al. 2010). Especially for pole-ward range shifts or expansions, a straightforpole-ward interpre-tation of the observed evolutionary dynamics is hampered because of the simultaneous evolutionary responses to the changing local environmental conditions and to the expan-sion process per se.
Species expanding or shifting their range poleward ex-perience a change in temperature and growing season that could affect their life histories. The lower temperatures in northern regions can affect species’diapause behavior (e.g., the Colorado potato beetle; see Piiroinen et al. 2011; Leh-mann et al. 2014, 2015), and especially in multivoltine spe-cies, changes in the length of the growing season have an impact on development time, growth rate, and adult size. Because of the gradual shortening of the growing season, a gradually faster development is needed to attain an equal number of generations within this decreasing time frame. At a certain point, however, development speed is at is max-imum. At this point, voltinism abruptly decreases (i.e., loss of a generation), in turn allowing a sudden relaxation of de-velopment speed. This mechanism of a step-by-step reduc-tion in voltinism with increasing latitude creates a typical sawtooth pattern in development time (i.e., alterations of gradual increase and sudden decrease in development speed; see Roff 1980; Kivela et al. 2011; Levy et al. 2015). Further-more, high-latitude populations tend to compensate for the low temperatures that plastically reduce growth rate through the evolution of genetically faster growth rates (i.e., counter-gradient variation; see Conover and Schultz 1995). In some instances, development time can moreover share an underly-ing mechanism with growth rate (Kivela et al. 2011), and to-gether these two traits can impact adult size, leading to either bigger, smaller, or equal-sized individuals in more northern regions (Blanckenhorn and Demont 2004). Apart from these climatic changes, many range-shifting species may also suffer from changes in habitat quality and quantity. However, this is mainly restricted to native range climate-tracking species (as
* Corresponding author; e-mail: [email protected].
† These authors contributed equally to this work. ORCIDs:Bonte, 0000-0002-3320-7505.
Am. Nat. 2016. Vol. 188, pp. 485–498.q2016 by The University of Chicago. 0003-0147/2016/18805-56566$15.00. All rights reserved.
DOI: 10.1086/688666
opposed to invasive species), for which deteriorating habitat is one of the main explanations for the occurrence of their initial range limits (North et al. 2011; Hargreaves et al. 2014).
On top of this pressure to adjust to the changing local environment, the process of range expansion in itself en-tails a strong selection pressure. First, since the most dis-persive phenotypes accumulate at the expansion front, as-sortative mating takes place (Phillips et al. 2010; Shine et al. 2011). This results in increased dispersal abilities at the range front, as has been illustrated theoretically (e.g., Travis and Dytham 2002; Burton et al. 2010; Perkins et al. 2013) as well as empirically throughfield and common garden studies (e.g., Phillips et al. 2006; Mitikka and Hanski 2010; Hill et al. 2011; Huang et al. 2015) and experimental evolution (Fronhofer and Altermatt 2015). Dispersal evolution thus affects (Kubisch et al. 2014) and is affected by range expansion (reviewed in Hill et al. 2011). Second, because of the locally low densities at the leading edge, individuals in the vanguard of an ex-panding range are predicted to experience rrather thanK
selection, which would translate into a higher investment in reproduction (Phillips 2009; Phillips et al. 2010). Range ex-pansion thus results in a positive selection for dispersal be-cause of the interaction between spatial sorting (and thus as-sortative mating) of dispersive phenotypes and an increased population growth rate driven by density release at the ex-pansion front. Through both mechanisms, range exex-pansion therefore contributes to a process of spatial selection (Shine et al. 2011; Perkins et al. 2013).
Local adaptation to changing climatic conditions and spatial selection can thus jointly impact evolutionary dy-namics in species expanding poleward. However, we lack a clear understanding of their relative importance in shap-ing quantitative genetic trait differentiation along latitudi-nal gradients. For example, a greater investment in thorax mass in northern populations of an insect species can re-sult from spatial selection (dispersiveness is selected for at the range front) as well as from local adaptation (lower temperatures might decrease muscle efficiency). Likewise, increased dispersal in plant populations near the range edge could purely result from mechanisms to avoid in-breeding (adaptation to low mate availability; Hargreaves and Eckert 2014) but could also be caused by spatial se-lection. Insights are, to date, mainly derived from theory (Perkins et al. 2013; Hargreaves et al. 2015) or from correl-ative—often phenotypic—approaches (Therry et al. 2014a, 2014b, 2014c, 2015).
Here, we combine common garden breeding and an individual-based model (IBM) to study the putative causes of multivariate trait evolution during poleward range expan-sion. With a full life-history perspective, we assess latitudinal quantitative genetic trait differentiation in the two-spotted spider miteTetranychus urticaeKoch (Acari,
Tetranychi-dae), which has recently expanded its European range. By contrasting empirical patterns in life-history trait divergence with those derived from a stochastic IBM, we are able to de-termine whether this trait divergence is best explained by only local adaptation, only spatial selection, or their joint action.
Material and Methods
Life-History Evolution along the Sampled Gradient Study Species. The herbivorous spider mite Tetranychus urticaeis an agricultural pest species with a worldwide dis-tribution. It reproduces through arrhenotokous partheno-genesis, whereby unfertilized eggs develop into males and fertilized eggs into females. Sex ratio inT. urticaeis usually female biased (3∶1; Krainacker and Carey 1989), but moth-ers can alter the sex ratio of their young (Young et al. 1986). Each female may produce more than 50 female off-spring, and at optimal temperatures (277–307C), mites can complete their life cycle in 8–10 days (Sabelis 1981). The species can engage in aerial long-distance dispersal (making use of aerial currents), which is preceded by a unique pre-dispersal behavior. Like many arthropods, T. urticae can go into diapause when conditions are suboptimal (e.g., food shortage, desiccation, cold). This ability is restricted to the adult stage of the species. From approximately 1983 on-ward, the mite species has expanded its European range from the Mediterranean to (at least) southern Scandinavia (K. H. P. Van Petegem, personal observation); this oc-curred at least partially through aerial long-distance dis-persal (a detailed description of the mite’s range expansion can be found in Carbonnelle et al. 2007).
Population Sampling.We collected spider mites during the summers of 2011 and 2012 along an 800-km latitudinal gra-dient from northwestern Belgium (51.17N) to northern Den-mark (57.77N;fig. 1). To minimize variation due to adapta-tion to different host plant species and human pressure (e.g., harvesting, pesticides) and to maximize latitudinal, climatic variation relative to variation in continentality (i.e., longitu-dinal variation), we searched for mites on a small selection of host plants within (semi-)natural area along the coast (see“Field Collection Sites,”available online). In 2011, we collected spider mites in 20 sites. In 2012, we collected them in 12 out of these 20 sites, thereby omitting populations that were very close to one another. To avoid mites being in common garden conditions too long (allowing domestica-tion), trait assessments were split up over two consecutive years. Diapause incidence, longevity, fecundity, egg survival, juvenile survival, and development time were assessed with mites collected in 2011, while dispersal propensity, dispersal latency, sex ratio, and adult size were assessed with mites col-lected in 2012.
Fig ure 1: Map sho win g all th e fi el d col lec tio n sit es in Be lgi um , the Net her lan ds, Ge rman y, an d D enma rk. The gra ph sho ws the yea rly num ber of fro st da ys an d th e ave rag e yea rly tem per atu re fo r eac h co lle cti on si te alo ng the lat itu din al gra die nt. The se cl ima tic da ta we re ob tai ne d fro m Fet chC li mat e, a w eb ap pli cat ion th at ch oo ses the mos t acc ur at e sou rce for eac h p arti cu lar cli ma te var ia ble (Mi cro sof t Res ear ch Cam bri dg e; htt p:/ /re sea rch .mi cro sof t.c om/ fet chc lim at e), and we re ave rag ed over a per iod of 35 yea rs (19 80 – 20 15) .M o re inf orm at ion is pro vi ded in “ Fie ld Col lec tio n Sit es, ” ava il able onl ine .
Common Garden and Synchronization. Common garden breeding techniques are robust methods for detecting ge-netic variation among populations. In both 2011 and 2012, a common garden stock population was thus generated in the lab for each collection site by putting between 50 and several hundred mites from the collection site on whole bean plants (Phaseolus vulgaris, variety Prélude). Beans are known to be a highly favorable host forT. urticae. Mites from different collection sites are therefore not expected to show substantial genetic variation infitness on this plant species (Agrawal et al. 2002; Gotoh et al. 2004). However, though we selected our common garden conditions to be as neutral as possible, different populations (genotypes) may still have reacted differently toward these standardized conditions (see sec. A1.1; sec. A1–A6 available online). We, however, minimized this bias in our analyses by following a pattern-oriented approach, thereby avoiding a direct com-parison of empirical trait values with modeled ones. The common garden stock populations were maintained at room temperature with a light regime of 16L∶8D. Mites remained in these stock populations for one to four gen-erations (with the exception of the assessment of sex ratio, where they were in common garden for about 20 gen-erations). Subsequently, before the start of an experiment, a synchronization of the mites was performed to obtain a large pool of same-aged, mated adult females (see sec. A1.2). With the exception of diapause incidence (which was per-formed almost immediately after population sampling), all trait assessments were thus performed with at least third-generation mites (at least one third-generation in the stock popu-lation, plus one generation of synchronization). The relatively short stay in common garden was chosen as a balance be-tween excluding direct environmental effects (phenotypic plas-ticity, environmentally induced maternal effects) and keeping as much of the original genotypic differentiation as possible (i.e., preventing loss through adaptation to the new host [bean] or the lab environment).
Data Collection and Statistics. A detailed overview of the applied methodology during data collection can be found in sections A1.3–A1.8. In short, we measured the following 10 life-history traits for all populations: dispersal propensity, dispersal latency, diapause incidence, fecundity, longevity, adult size, egg survival, juvenile survival, sex-specific devel-opment time, and sex ratio (all resulting data are deposited in the Dryad Digital Repository: http://dx.doi.org/10.5061 /dryad.n0c67 [Van Petegem et al. 2016]). Because it was not possible to assess all traits simultaneously for one individual mite, several different, independent experimental setups were constructed. Thus, though the unit of observation was always an individual mite, the different traits were not assessed for one and the same individual. Thefirst six traits were assessed for only female mites (not relevant for males). Using
estab-lished behavioral assays (see Li and Margolies 1994; Van Pe-tegem et al. 2015), dispersal was assessed by quantifying a female’s propensity and latency (i.e., the period of decision-making) to perform a unique predispersal behavior tightly linked to aerial dispersal. Because dispersal is density depen-dent (Harrison 1980; Denno and Peterson 1995), we mea-sured these dispersal behaviors at different densities. We fur-thermore obtained a population-level measure for intrinsic growth rate by multiplying values of lifetime fecundity with juvenile survival, egg survival, and 1/sex ratio (i.e., ratio of daughters to total number of offspring). These values were resampled (using the sample size of sex ratio, which was the lowest of all four traits) from the quantified distributions of the respective traits.
We performed a multivariate distance-based ANOVA to test for variation in multivariate life-history parameter space (all 10 measured life-history traits), using the vegan and permute packages of RStudio (ver. R 3.2.3; RStudio Team 2015; for more detailed information, see sec. A1.9). The multivariate test showed significant variation in life-history strategies among the different populations (F1, 8p2:23,Pp:044,R2p0:22 for the subset of 12
pop-ulations sampled in both 2011 and 2012 [and hence all 10 measured traits]; F1, 16p3:31, Pp:012, R2p0:17 for
18 of the 20 populations sampled in 2011 [and hence the subset of six traits measured for only 2011]).
This validated the use of subsequent univariate analyses, which were performed using (generalized) linear mixed models (SAS ver. 9.4; SAS Institute 2013). For each trait separately, differentiation along the latitudinal gradient was assessed. Latitude, mite density (for dispersal propen-sity), and host plant species were the independent var-iables. The patterns found for latitude were maintained when we used the local average yearly temperature or the coastal distance to the uppermost population as the inde-pendent variable instead of latitude (K. H. P. Van Petegem, unpublished data). We tested trait differentiation related to host plant identity because the dominant host plant spe-cies in thefield changed with latitude and could thus have affected the latitudinal signal. In all cases, we corrected for nonindependence of our data within single populations by adding maternal line and other experimental sources of de-pendency as random effects (for a detailed outline of the different models, see sec. A1.9). Effective denominator de-grees of freedom for the tests offixed effects were computed according to a general Satterthwaite approximation. Because the variance explained by random effects varied among the different dependent variables in our study, these effective de-nominator degrees of freedom were different for each statis-tical model.
Additionally, because we theoretically expect a sawtooth pattern for development time, we used segmented linear regression on the population averages (Muggeo 2003, 2008), 488 The American Naturalist
following multiple breakpoint analyses for data fitting. Davies’s tests indicated the presence of three breakpoints. Analysis of deviance with the linear model was used to ver-ify a putative betterfit of the segmented linear regression (sawtooth) versus a linear regression (Crawley 2007). These analyses were done in RStudio (ver. R 3.2.3; RStudio Team 2015), using the segmented package (Muggeo 2008).
Inferring Mechanisms by Contrasting the Empirical Data with a Parameterized Individual-Based Model The Individual-Based Model (IBM). We here only outline the basic principles of the IBM but provide a detailed de-scription and motivation in section A2 (the modeling code is available in GitHub: https://github.com/jeroenboeye/Van -Petegem-et-al._Evolution-during-range-expansion_code). We designed a stochastic, individual-based, and spatially ex-plicit model to simulate the evolutionary dynamics inT. ur-ticaealong a climatic gradient comparable to the one we stud-ied empirically. The IBM is inspired by an IBM of Bancroft and Margolies (1999) that simulated the dynamics amongT. ur-ticae, its host plant, and its predator. We adjusted this ex-isting IBM to simulate population dynamics at a time step basis of 1 day (for which empirical data were available) in a simplified model landscape. This landscape consisted of a grid of 100 rows (latitude) andfive columns (longitude). Local population dynamics were simulated within each of these grid cells. The grid reflects a latitudinal range of 1,000 km (10#10-km2grid cells) and corresponds with the
macro-geographic scale at which we sampledT. urticaein thefield. The length of the growing season, determined by seasonal var-iation in temperature, was defined at the grid level by two trigonometric functions, which were based on actual data.
The IBM simulated the behavior and life history of adult female mites, because females are the reproducing sex and adult females the main dispersers. No mating limitations and recombinations were consequently implemented. Us-ing data from Sabelis (1981), development, longevity, mor-tality, and fecundity of the mites were all simulated ac-cording to the local grid cell temperature. Mites followed a pattern of exponential growth. However, as a compro-mise to maintain high computational efficiency, individuals were randomly deleted as soon as more than 200 mites oc-cupied a grid cell. We assumed density-independent aerial dispersal among grid cells, because the large spatial scale used (10#10-km2grid cells) did not allow us to sensibly
incorporate density dependence (which is important at the level of a single leaf or plant). Dispersal mortality was set rel-atively high and reflects transience and settlement costs (90%; see De Roissart et al. 2015). The probability for an in-dividual mite to engage in aerial long-distance dispersal was modeled as an unconditional nearest-neighbor dispersal rate, determined by a single locus subject to
selection/muta-tion. Other traits subject to selection and mutation were de-velopment, fecundity, and the timing of diapause onset and termination. A linear trade-off between development and fecundity was implemented in order to constrain the evolu-tionary trajectories. This trade-off function was coded by a single-locus trait that altered the balance of investment be-tween development and fecundity. Because no empirical data on such a trade-off are available, we tested several functions where the maximal increase or decrease in perfor-mance of either trait was limited to 10% or 20% (assumed realistic, conservative percentages). In total, four trade-off balances (10%-10%, 10%-20%, 20%-10%, 20%-20%) were thus modeled. For instance, 10%-20% implies that a maxi-mum 10% increase/decrease in development corresponds with a maximum 20% decrease/increase in fecundity (see sec. A2.6).
Because we aimed to contrast evolutionary dynamics resulting from spatial selection and local adaptation, we tested three competing major model scenarios: (1) a sce-nario of range expansion along a homogeneous gradient, (2) a scenario with range expansion along a latitudinal cli-matic gradient, and (3) a scenario where evolution could occur within this same heterogeneous gradient but with-out the process of range expansion. In the stable range sce-nario (scesce-nario 3), individuals were initialized along the en-tire climatic gradient. For scenarios with range expansion (scenarios 1 and 2), only the 10 southernmost rows were initialized with genetically diverse individuals, thereby al-lowing range expansion toward the northern grid cells. This range expansion was constrained in scenario 2 by the sea-sonal conditions that affected development, survival, and fecundity. All simulations were run via high-performance computing (Ghent University). A total of 100 replicates were run for each of 12 specific model scenarios (three major model scenarios#four trade-off balances). The IBM was halted after 100,000 time steps (i.e., when the entire range was more or less fully occupied in all eight specific model scenarios that included range expansion).
Comparison of Empirical and Simulation Results.We tested how closely the empirically observed latitudinal patterns of life-history traits matched those predicted by the IBM. More specifically, we performed goodness-of-fit tests on summary statistics of those three life-history traits that were subject to selection and for which a comparison between empirical and simulation data could be made: the regression slopes against latitude of intrinsic growth rate, dispersal, and de-velopment time, and the amplitude and wavelength of the sawteeth for development time (for more information on thesefive summary statistics, see sec. A3). We compared the empirical and simulation data with a pattern-oriented ap-proach (Grimm et al. 2005), using approximate Bayesian computation to select the specific model scenarios for which
a derived summary statistic best matched that from the em-pirical data (Csillery et al. 2010; Baiser et al. 2013; Wiegand and Moloney 2014). We ran three competing major model scenarios (scenarios 1–3), each of which was coupled with four implemented trade-off balances between development and fecundity (all 10%/20% combinations), giving a total of 12 specific model scenarios. Posterior distributions of the
five summary statistics were obtained from 100 indepen-dent runs of each of these 12 specific model scenarios, while distributions of the empirically derived summary statistics were generated via bootstrapping. The goodness-of-fit tests were performed by summing the squared differences be-tween 100 randomly sampled values from the empirical summary statistic distributions and from the distributions for each of the 12 specific model scenarios. This procedure was repeated 10,000 times to determine the frequency with which each specific model scenario was found to be best matching an empirical life-history pattern.
Subsequently, we assessed which selection pressure (spa-tial selection vs. local adaptation) best matched the ob-served latitudinal life-history patterns. For each of the three competing major model scenarios, we therefore summed the frequencies obtained in the previous step over all four trade-off balances. We thereby obtained three (one for each major model scenario) integrated frequencies, equally weighted over the four trade-off balances, for each of the
five summary statistics. These integrated frequencies were then used to calculate Bayes’s factors to infer—for each life-history pattern separately—the best-fitting major model scenario. This gave an idea of the most likely selection
pres-sure shaping this life-history trait’s variation along the lati-tudinal gradient. A Bayes’s factor of 3 or more for a model comparison of model A versus B implies that model A is more strongly supported by the data (Kass and Raftery 1995). Thus, if, for example, model scenarios including range expansion gave a markedly better (Bayes’s factor of three or more) fit than the stable range scenario for a specific life-history pat-tern, than spatial selection was inferred as the most likely selection pressure shaping the latitudinal pattern of this life-history trait.
Results
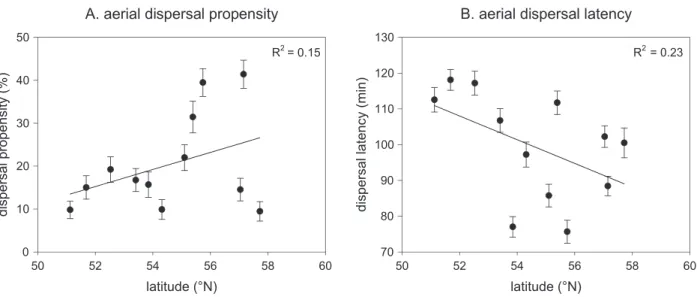
Life-History Evolution along the Sampled Gradient Dispersal Propensity and Latency.Dispersal propensity and latency both significantly varied with latitude: dispersal pro-pensity increased with latitude (F1, 2,235 p33:93, P!:001;
fig. 2A), while dispersal latency showed the exact opposite trend (F1, 469 p12:16,P!:001;fig. 2B). Dispersal
propen-sity and latency were denpropen-sity dependent, but this denpropen-sity de-pendence did not vary with latitude (propensity:F2, 2,230p
0:03,Pp:97; latency:F2, 467p2:71,Pp:068). There was
no effect of host plant species on dispersal propensity (F3, 2,232p1:85, Pp:14) or dispersal latency (F3, 464p
0:60,Pp:62).
Diapause Incidence. No correlation between latitude and diapause incidence was found (F1, 18:68p0:05,Pp:82; see
sec. A4). Instead, diapause incidence was significantly
af-Figure 2: Dispersal propensity (A) and dispersal latency (B) for each sampled population along the latitudinal gradient. Populations means
are given51 SE (bars). Regression lines (on population averages) are shown together with theirR2values.
fected by the host plant on which the mites were collected (F3, 50:13p9:86,P!:001; see sec. A4).
Fecundity and Longevity.Lifetime fecundity (F1, 71p14:75, P!:001;fig. 3A) and longevity (F1, 65:1p11:41,Pp:0012;
fig. 3B) both decreased significantly with latitude. For daily fecundity, however, no variation with latitude was found (F1, 68p0:69, Pp:41). Instead, daily fecundity was
af-fected by the host plant species (F3, 69p5:59,Pp:0017;
see sec. A4). For lifetime fecundity, no effects of host plant species were found (F3, 68p1:62,Pp:19). For longevity,
there was a general effect of host plant species (F3, 66:3p3:72, Pp:016), but none of the adjustedPvalues were significant in the pairwise post hoc Tukey tests.
Egg Survival, Juvenile Survival, and Development Time.
The relative amount of hatched eggs increased significantly with latitude (F1, 103:1p6:76, Pp:011; fig. 3C), but the
proportion of juvenile mites reaching the adult life stage showed no latitudinal pattern (F1, 1,315 p0:19, Pp:67;
see sec. A4). Furthermore, toward higher latitudes, female (F1, 66:1p11:03,Pp:0015) and male (F1, 62:1p18:84,P!
:001) spider mites had a significantly shorter development time (i.e., a faster development;fig. 3D). There was no effect of host plant species on the development time of females (F3, 57:4p1:89,Pp:14) or males (F3, 60p2:21,Pp:096)
or on egg survival (F3, 44:38p2:51, Pp:071) or juvenile
survival (F3, 1,312p1:90,Pp:13).
Fitting the expected sawtooth pattern (see sec. A4) in-stead of a linear predictor increased the amount of variance in development time explained from 36.4% to 80.9% in males (F7, 10 p6:06,Pp:006) and from 13.3% to 61.2%
in females (F7, 10p2:26,Pp:11). The deviance following
segmented regression (sawtooth pattern) was (marginally) significantly lower than that for the linear pattern (one-tailed x2 tests; males: deviancep2:70,P!:001; females:
deviancep3:33,Pp:054).
Sex Ratio and Adult Size. Sex ratio (the proportion of males among offspring) increased significantly toward higher latitudes (F1, 61:97p6:73,Pp:012; fig. 3E). With
increasing latitude, populations were thus increasingly male biased. Adult size, in contrast, did not vary with latitude (F1, 342p1:19,Pp:28; see sec. A4). Instead, the adult size
of the female spider mites was significantly affected by the host plant species from which they were collected (F3, 343p3:64,Pp:013; see sec. A4). There was no effect
of host plant species on sex ratio (F3, 50:9p2:10,Pp:11). Intrinsic Growth Rate.Intrinsic growth rate decreased sig-nificantly toward higher latitudes (F1, 8p6:20,Pp:038;
fig. 3F).
Inferring Mechanisms by Contrasting the Empirical Data with a Parameterized Individual-Based Model
Three consistent (i.e., consistent over all the trade-off bal-ances) patterns in life-history divergence along the lati-tudinal gradient emerged from the IBM: an increase in dispersal toward the range front in the range expansion scenarios, a stepwise decrease in voltinism toward the north in the scenarios with an environmental gradient, and an overall lower temperature for diapause termina-tion than for diapause onset in all scenarios (see sec. A5). Our results furthermore show that the chosen trade-off balance in our model (maximum effect on develop-ment vs. maximum effect on fecundity) affected volt-inism and the relative investment in development versus fecundity (see sec. A2.6) and, as such, the goodness of
fit of our three major model scenarios for the summary statistics in development time and intrinsic growth rate (table 1;fig. 4).
The goodness offit for thefive summary statistics clearly showed differences between the three competing major model scenarios (table 1;fig. 4). The stable range scenario poorly predicted the empirically observed dispersal pro-pensity but provided some of the strongest supports for the pattern in development time. Overall, however, the sta-ble range scenario performed rather badly. The scenario with range expansion in a homogeneous landscape showed a moderate overallfit but provided the strongest support for the empirical pattern in intrinsic growth rate. The sce-nario with range expansion along an environmental gradi-ent resulted in the best overallfit, with the highest values for dispersal propensity and good to strong support for the patterns in intrinsic growth rate and development time. In terms of evolutionary scenario (range expansion vs. sta-ble range and environmental gradient vs. no gradient), the range expansion scenarios clearly provided a much stron-ger support for the empirical pattern in dispersal than the stable range scenario (Bayes’s factorp40:15), while no dif-ference in support was found between the scenarios with and without an environmental gradient (Bayes’s factorp0:79). In contrast, the best support for the empirical pattern in de-velopment time was provided by the scenarios with an environmental gradient (especially concerning the slope [Bayes’s factorp1:99] and amplitude [Bayes’s factorp 3:66] of the pattern), while no difference in support was found between model scenarios with or without range ex-pansion (slope: Bayes’s factorp0:56; amplitude: Bayes’s factorp0:56). Regarding intrinsic growth rate, no clear difference between the evolutionary scenarios was found (range expansion vs. stable range: Bayes’s factorp1:41; gra-dient vs. no gragra-dient: Bayes’s factorp0:74), though the two bestfits with the empirical data were provided by range expansion scenarios (see table 1).
Figure 3: Lifetime fecundity (A), longevity (B), egg survival (C), development time (D), sex ratio (E), and intrinsic growth rate (F) for each
sampled population along the latitudinal gradient. Population means are given51 SE (bars). Regression lines (based on population means)
are shown together with theirR2values. InD, development time is shown separately for females (filled circles) and males (open circles).
Table 1: Results from goodness-of-fi t analyses between empirical data and the three competing major model scenarios Mod el par ame ter s Fit tin g ana lys is res ult s (% bes t fi t) Rang e dyn ami cs Env iro nm ent al grad ien t Max im um % tr ade -of f eff ect dev el opme nt Max imum % trad e-o ff eff ect fec un dit y Dis per sal pro pe ns ity (sl ope ) In tri nsic grow th rat e (slo pe) Dev el opme nt rat e (s lop e) De vel opm ent rat e (wa ve len gt h) Dev elo pme nt rat e (amp lit ud e) Sta ble Ye s 20 10 .29 7.7 1 .5 4 14. 38 1. 32 Sta ble Ye s 20 20 .44 .61 0 7.1 7 29. 48 Sta ble Ye s 10 10 .3 10. 59 5.9 2 6.5 7 15. 41 Sta ble Ye s 10 20 .2 7.2 6 40. 56 .8 6 1. 09 Exp ans ion No 20 10 11. 23 25. 08 3.6 6 7.2 4 .8 9 Exp ans ion No 20 20 5.2 9 5.6 6 3.8 1 5.6 6 5. 81 Exp ans ion No 10 10 11. 79 7.6 6 5.1 11. 86 1. 02 Exp ans ion No 10 20 10. 34 1.8 8 7.5 3 6.3 2 4. 3 Exp ans ion Ye s 20 10 11. 55 18. 19 4.9 8 12. 08 6. 59 Exp ans ion Ye s 20 20 14. 24 6.3 8 6.2 2 10. 69 14. 85 Exp ans ion Ye s 10 10 15. 36 4.5 4 6.5 8 10. 2 5. 78 Exp ans ion Ye s 10 20 18. 97 4.4 4 15. 1 6.9 7 13. 46 No te: Eac h sc ena rio has fo ur pos si ble tra de-off bala nc es, res ult ing in a tota l o f 12 spe ci fi c mod el sce nar io s. Mode l p aram ete rs inc lu de ran ge dyn ami cs, pre sen ce or abs en ce of an en vir onm ent al gra die nt, and tra de-of f bal anc es (al l com bin ati ons of a max im um 5 10 % and a max im um 5 20 % tra de-of f ef fec t o n dev elo pme nt or fe cun dit y). On the rig ht, the res ul ts of the ana lys es are sh own . Per cen tag es ind ica te how oft en a spe ci fi c mod el sce nar io prov ide d the bes t fi t for a part icu la r sum mar y stat is tic . Su m m ary sta tis tic s inc lud e the reg res sio n slo pes aga ins t lat itu de of int rin sic grow th rate , dis per sal and dev elo pme nt tim e, and the amp lit ud e an d wav ele ngt h o f the saw tee th fo r dev elo pme nt tim e. 493
Fig ure 4: Pos te rio r dis tri but ion s o f fi ve su mmar y st at ist ic s (t h e reg res si on slop es aga ins t lat itu de of int rin si c gro wt h rat e, dis pe rsa l an d dev elo pm ent tim e, an d th e amp li tud e an d wav e-le ngt h o f th e saw tee th for dev el opm en t tim e; see sec . A 3 ,av aila ble onl ine ) o b tai ne d fro m 100 ind ep end en t run s o f eac h o f th e 12 spe ci fi c m o del sce nar ios , tog eth er wit h th e dis tr ibu tio ns of the emp iri cal ly der ived sum mary st at ist ic s. The den si ty cur ves rep res ent th e pos te rio r dis tr ibut ion s, whi le the bla ck ci rcl e rep res ent s th e emp ir ica l val ue for th e su mma ry st ati st ic. Th e bar s sho w the 95 % cre dibi li ty int erv al aro und th is emp iri cal val ue (ca lc ul ate d vi a bo ots tra ppi ng) .
Discussion
Our common garden approach revealed considerable quan-titative genetic divergence in life-history traits in populations ofTetranychus urticaethat were sampled along a latitudinal gradient from range core to expansion front. Dispersal, sex ratio, egg survival, fecundity, longevity, development time, and the derived intrinsic growth rate showed strong latitudi-nal patterns. By means of pattern-oriented modeling, we demonstrated that local adaptation alone could not explain increased dispersal at high latitudes and thus that spatial se-lection likely must be in play. In contrast, latitudinal variation in development time was best explained by scenarios includ-ing local adaptation to the local climatic and seasonal condi-tions. For intrinsic growth rate, the trends were less clear, though the bestfits were given by range expansion scenarios. Overall, local adaptation and spatial selection seem to have jointly shaped quantitative genetic divergence in the life his-tory of this poleward-expanding arthropod.
The empirically observed increased dispersal at the range front is in line with several studies on postglacial range ex-pansion (Cwynar and Macdonald 1987), invasions (Travis and Dytham 2002; Phillips et al. 2006; Huang et al. 2015), and climate change (Thomas et al. 2001; Travis et al. 2013). Because this pattern matched best with our range expan-sion scenarios, this indicates that dispersal ability is posi-tively selected at the expansion front through the process of spatial selection and most likely not by adaptation to local environmental conditions (i.e., local temperature and grow-ing season length in our model). Evolution of dispersal along a latitudinal gradient could, however, be equally affected by factors related to changes in habitat quality and connectivity (Bowler and Benton 2005), which were not included in our modeling framework. A decrease in habitat quality and con-nectivity, however, is theoretically expected to select against dispersal (Moran and Alexander 2014), so this would oppose ourfindings. It is interesting to notice that two populations at the outermost range limit at the peninsula of Denmark (which is surrounded by hostile matrix—the sea) are charac-terized by reduced dispersal (seefig. 2A). While these points do not obscure the general pattern, they potentially reflect an elastic range margin due to gradients of habitat availabil-ity and local extinction risk (Holt 2003; Kubisch et al. 2010; Henry et al. 2013). An additional factor leading to increased dispersal and colonization rates could be the ephemeral na-ture of range populations (Duputie and Massol 2013), as, for example, found in a plant species (Darling et al. 2008). How-ever, in our study, host plants were readily available at the range front and expected to be exhausted more slowly than in the range core because of a lower intrinsic growth rate of the mites (seefig. 3F). Increased dispersal at the range edge could also have been caused by increased temporal variation in population sizes (McPeek and Holt 1992), resulting from
harsh climatological conditions, especially during winter. In our model, however, this disturbance (see sec. A2.1) was implemented in both the stable and a range expansion sce-nario and can therefore not explain the difference in dispersal between these two scenarios. Spatial selection may thus be considered as a likely major driver of the evolution in dis-persal in our study.
The empirically found latitudinal variation in develop-ment time (slope and sawtooth statistics) matched best with the scenarios that included adaptation toward an environ-mental gradient. The gradual shortening in the growing season from core to edge seems to have resulted in changes in voltinism and consequent abrupt changes in develop-ment time. Indeed, changes in developdevelop-ment time are most effective for maintaining an optimal reproductive outcome when a restricted growing season leads to changes in volt-inism (Roff 1980). The changes in development time did not cause changes in adult size in our study. This suggests that compensatory growth maintained a constant size at maturity, despite large changes in the length of the growing season (Conover et al. 2009). Interestingly, this might imply an increased foraging efficiency at the range margin and thus contradicts predictions of a dispersal-foraging trade-off, found during experimental evolution in a protist (Fronhofer and Altermatt 2015).
Concerning intrinsic growth rate, none of the three model scenarios gave a markedly betterfit. The best fits, however, were provided by model scenarios with range ex-pansion. Our empirically observed trend of a declining in-trinsic growth rate with latitude, however, opposes theo-retical expectations of evolution toward higher intrinsic growth rates at the expansion front, where on average lower population densities occur (Phillips 2009; Phillips et al. 2010). While Fronhofer and Altermatt (2015) showed that density is not always lower at the range margin, we suspect that it is in this case because of the overall shorter growing season and colder temperatures in the north. We therefore attribute the observed pattern in growth rate to trade-offs between fecundity and other life-history parameters. In-deed, the decline in intrinsic growth occurred despite faster development times and higher egg survival and was there-fore most likely driven by strong reductions in fecundity. However, while some studies suggest that fecundity trades off with dispersal (e.g., Zera and Denno 1997; Hughes et al. 2003), others have failed to detect this or even found a pos-itive correlation (e.g., Saastamoinen 2007; Therry et al. 2015). Furthermore, diapause incidence has been shown not to con-strain changes in fecundity inT. urticae(Ito 2009). We con-ducted our study with a full life-history perspective and tested for population-level correlations between multiple life-history traits but did not detect any relevant trade-off (see sec. A6).
Because host plant variation covaried with the latitudinal gradient, our latitudinal patterns could have been confounded
by patterns of local adaptation to the host plant species in thefield.Tetranychus urticaeis known to adapt to new host plant species within 10–15 generations (Magalhães et al. 2007), but we kept the mites in common garden for only two tofive generations (except for the assessment of sex ratio), which is not sufficient to disrupt adaptation to a previous host plant species (Magalhães et al. 2011). However, we corrected for this potential bias in our analyses and found that host plant could have masked only a pure latitudinal effect for daily fe-cundity, where statistical models with host plant included did not show a latitudinal effect while models without did. In the case of diapause incidence, assessments were made almost immediately after mites were gathered in the field. Therefore, diapause incidence possibly still showed some en-vironmentally induced phenotypic plasticity. Nevertheless, diapause is known to harbor a very strong genetic compo-nent (reviewed in Tauber et al. 1986).
By combining an empirical with a detailed, pattern-oriented modeling approach, this study is thefirst to dem-onstrate that local adaptation and evolution imposed by the process of range expansion can jointly shape quantitative genetic divergence during range expansion along a latitu-dinal gradient. We were able to show that local adaptation to the growing season probably affected development time, while the expansion process per se likely induced evolution-ary divergence in dispersal and potentially also in intrinsic growth rate. In the current debate on the potential role of local adaptation versus phenotypic plasticity during range expansion, our results indicate that local adaptation has the potential to effectively drive rapid genotypic changes (Co-lautti and Barrett 2013). It can operate within the same ecological time frame as the process of spatial selection, to-gether thrusting evolutionary change along the expansion front. To make reliable predictions for expanding popula-tions, we should therefore acknowledge and take into ac-count this interplay between both evolutionary forces.
Acknowledgments
This project was funded by the Fund for Scientific Research– Flanders (FWO; project G.0610.11). D.B. and R.S. were sup-ported by BelSpo Interuniversity Attraction Poles Project
“Speedy.”The computational resources (Stevin Supercom-puter Infrastructure) and services used in this work were pro-vided by the Flemish Supercomputer Center (VSC), funded by Ghent University, the Hercules Foundation, and the Flem-ish government (Department of Economy, Science, and In-novation). We are grateful to H. Matheve, R. Puls, J. Teunen, and J. Van den Berghe for their help during the sampling of the mites in thefield and A. Alcantara, J. Hillaert, V. Van-domme, and A. Vanommeslaeghe for their short but useful assistance during the data gathering in the lab. We would also
like to thank C. G. Eckert, E. Fronhofer, T. Hovestadt, E. Matthysen, M. Shawkey, D. Strubbe, J. Travis, and two anon-ymous reviewers for their useful comments on earlier ver-sions of this manuscript.
Literature Cited
Agrawal, A. A., F. Vala, and M. W. Sabelis. 2002. Induction of pref-erence and performance after acclimation to novel hosts in a phy-tophagous spider mite: adaptive plasticity? American Naturalist
159:553–565.
Baiser, B., H. L. Buckley, N. J. Gotelli, and A. M. Ellison. 2013. Predicting food-web structure with metacommunity models. Oikos
122:492–506.
Bancroft, J. S., and D. C. Margolies. 1999. An individual-based model
of an acarine tritrophic system: lima bean, Phaseolus lunatus L.,
twospotted spider mite,Tetranychus urticae(Acari: Tetranychidae),
andPhytoseiulus persimilis(Acari: Phytoseiidae). Ecological
Model-ling 123:161–181.
Blanckenhorn, W. U., and M. Demont. 2004. Bergmann and verse Bergmann latitudinal clines in arthropods: two ends of a
con-tinuum? Integrative and Comparative Biology 44:413–424.
Bowler, D. E., and T. G. Benton. 2005. Causes and consequences of animal dispersal strategies: relating individual behaviour to spatial
dynamics. Biological Reviews 80:205–225.
Burton, O. J., B. L. Phillips, and J. M. J. Travis. 2010. Trade-offs and the evolution of life-histories during range expansion. Ecology
Letters 13:1210–1220.
Carbonnelle, S., T. Hance, A. Migeon, P. Baret, S. Cros-Arteil, and M. Navajas. 2007. Microsatellite markers reveal spatial genetic
structure of Tetranychus urticae(Acari: Tetranychidae)
popula-tions along a latitudinal gradient in Europe. Experimental and
Applied Acarology 41:225–241.
Colautti, R. I., and S. C. H. Barrett. 2013. Rapid adaptation to climate
facilitates range expansion of an invasive plant. Science 342:364–
366.
Conover, D. O., T. A. Duffy, and L. A. Hice. 2009. The covariance
between genetic and environmental influences across ecological
gradients: reassessing the evolutionary significance of
counter-gradient and cocounter-gradient variation. Annals of the New York
Acad-emy of Sciences 1168:100–129.
Conover, D. O., and E. T. Schultz. 1995. Phenotypic similarity and
the evolutionary significance of countergradient variation. Trends
in Ecology and Evolution 10:248–252.
Crawley, M. J. 2007. Regression. Pages 387–448inM. J. Crawley, ed.
The R book. Wiley, Chichester.
Csillery, K., M. G. B. Blum, O. E. Gaggiotti, and O. Francois. 2010. Approximate Bayesian computation (ABC) in practice. Trends in
Ecology and Evolution 25:410–418.
Cwynar, L. C., and G. M. Macdonald. 1987. Geographical variation of lodgepole pine in relation to population history. American
Nat-uralist 129:463–469.
Darling, E., K. E. Samis, and C. G. Eckert. 2008. Increased seed
dis-persal potential towards geographic range limits in a Pacific coast
dune plant. New Phytologist 178:424–435.
Denno, R. F., and M. A. Peterson. 1995. Density-dependent dispersal
and its consequences for population dynamics. Pages 113–130in
N. Cappuccino and P. W. Price, eds. Population dynamics: new approaches and synthesis. Academic Press, London.
De Roissart, A., S. Wang, and D. Bonte. 2015. Spatial and spatiotem-poral variation in metapopulation structure affects population dy-namics in a passively dispersing arthropod. Journal of Animal
Ecol-ogy 84:1565–1574.
Duputie, A., and F. Massol. 2013. An empiricist's guide to theoret-ical predictions on the evolution of dispersal. Interface Focus 3:20130028.
Fronhofer, E. A., and F. Altermatt. 2015. Eco-evolutionary feedbacks during experimental range expansions. Nature Communications 6:6844.
Gotoh, T., A. Suwa, Y. Kitashima, and H. A. Rezk. 2004.
Develop-mental and reproductive performance ofTetranychus pueraricola
Ehara and Gotoh (Acari: Tetranychidae) at four constant
tem-peratures. Applied Entomology and Zoology 39:675–682.
Grimm, V., E. Revilla, U. Berger, F. Jeltsch, W. M. Mooij, S. F. Railsback, H. H. Thulke, et al. 2005. Pattern-oriented modeling of agent-based
complex systems: lessons from ecology. Science 310:987–991.
Hargreaves, A. L., S. F. Bailey, and R. A. Laird. 2015. Fitness declines towards range limits and local adaptation to climate affect dis-persal evolution during climate-induced range shifts. Journal of
Evolutionary Biology 28:1489–1501.
Hargreaves, A. L., and C. G. Eckert. 2014. Evolution of dispersal and mating systems along geographic gradients: implications for
shift-ing ranges. Functional Ecology 28:5–21.
Hargreaves, A. L., K. E. Samis, and C. G. Eckert. 2014. Are species’
range limits simply niche limits writ large? a review of transplant
experiments beyond the range. American Naturalist 183:157–173.
Harrison, R. G. 1980. Dispersal polymorphisms in insects. Annual
Review of Ecology and Systematics 11:95–118.
Henry, R. C., G. Bocedi, and J. M. J. Travis. 2013. Eco-evolutionary dynamics of range shifts: elastic margins and critical thresholds.
Journal of Theoretical Biology 321:1–7.
Hill, J. K., H. M. Griffiths, and C. D. Thomas. 2011. Climate change
and evolutionary adaptations at species’range margins. Annual
Review of Entomology 56:143–159.
Holt, R. D. 2003. On the evolutionary ecology of species’ ranges.
Evolutionary Ecology Research 5:159–178.
Huang, F., S. Peng, B. Chen, H. Liao, Q. Huang, Z. Lin, and G. Liu. 2015. Rapid evolution of dispersal-related traits during range
expan-sion of an invasive vineMikania micrantha. Oikos 124:1023–1030.
Hughes, C. L., J. K. Hill, and C. Dytham. 2003. Evolutionary trade-offs between reproduction and dispersal in populations at
expand-ing range boundaries. Proceedexpand-ings of the Royal Society B 270:S147–
S150.
Ito, K. 2009. Does artificial selection on diapause incidence cause
correlational changes in other life-history traits? case study in a spider mite population. Entomologia Experimentalis et Applicata
130:266–274.
Kass, R. E., and A. E. Raftery. 1995. Bayes factors. Journal of the
American Statistical Association 90:773–795.
Kivela, S. M., P. Valimaki, D. Carrasco, M. I. Maenpaa, and J. Oksanen. 2011. Latitudinal insect body size clines revisited: a crit-ical evaluation of the saw-tooth model. Journal of Animal Ecology
80:1184–1195.
Krainacker, D. A., and J. R. Carey. 1989. Reproductive limits and heterogeneity of male twospotted spider mites. Entomologia
Ex-perimentalis et Applicata 50:209–214.
Kubisch, A., R. D. Holt, H. J. Poethke, and E. A. Fronhofer. 2014. Where am I and why? synthesizing range biology and the
eco-evolutionary dynamics of dispersal. Oikos 123:5–22.
Kubisch, A., T. Hovestadt, and H.-J. Poethke. 2010. On the elasticity of
range limits during periods of expansion. Ecology 91:3094–3099.
Lehmann, P., A. Lyytinen, S. Piiroinen, and L. Lindstrom. 2014. Northward range expansion requires synchronization of both over-wintering behaviour and physiology with photoperiod in the
inva-sive Colorado potato beetle (Leptinotarsa decemlineata). Oecologia
(Berlin) 176:57–68.
———. 2015. Latitudinal differences in diapause related
photoperi-odic responses of European Colorado potato beetles (Leptinotarsa
decemlineata). Evolutionary Ecology 29:269–282.
Levy, R. C., G. M. Kozak, C. B. Wadsworth, B. S. Coates, and E. B. Dopman. 2015. Explaining the sawtooth: latitudinal periodicity in a circadian gene correlates with shifts in generation number.
Jour-nal of Evolutionary Biology 28:40–53.
Li, J. B., and D. C. Margolies. 1994. Responses to direct and indirect
selection on aerial dispersal behavior inTetranychus urticae.
He-redity 72:10–22.
Magalhães, S., E. Blanchet, M. Egas, and I. Olivieri. 2011. Environ-mental effects on the detection of adaptation. Journal of
Evolu-tionary Biology 24:2653–2662.
Magalhães, S., J. Fayard, A. Janssen, D. Carbonell, and I. Olivieri. 2007. Adaptation in a spider mite population after long-term evolution on
a single host plant. Journal of Evolutionary Biology 20: 2016–2027.
McPeek, M. A., and R. D. Holt. 1992. The evolution of dispersal in spatially and temporally varying environments. American
Natu-ralist 140:1010–1027.
Mitikka, V., and I. Hanski. 2010. Pgi genotype influencesflight
me-tabolism at the expanding range margin of the European map
but-terfly. Annales Zoologici Fennici 47:1–14.
Moran, E. V., and J. M. Alexander. 2014. Evolutionary responses to global
change: lessons from invasive species. Ecology Letters 17: 637–649.
Muggeo, V. M. R. 2003. Estimating regression models with unknown
break-points. Statistics in Medicine 22:3055–3071.
———. 2008. segmented: an R package tofit regression models with
broken-line relationships. R News 8:20–25.
North, A., S. Cornell, and O. Ovaskainen. 2011. Evolutionary responses of dispersal distance to landscape structure and habitat loss.
Evolu-tion 65:1739–1751.
Parmesan, C. 2006. Ecological and evolutionary responses to recent climate change. Annual Review of Ecology, Evolution, and
Sys-tematics 37:637–669.
Perkins, A. T., B. L. Phillips, M. L. Baskett, and A. Hastings. 2013. Evolution of dispersal and life history interact to drive accelerating
spread of an invasive species. Ecology Letters 16:1079–1087.
Phillips, B. L. 2009. The evolution of growth rates on an expanding
range edge. Biology Letters 5:802–804.
Phillips, B. L., G. P. Brown, and R. Shine. 2010. Life-history
evolu-tion in range-shifting populaevolu-tions. Ecology 91:1617–1627.
Phillips, B. L., G. P. Brown, J. K. Webb, and R. Shine. 2006. Invasion and the evolution of speed in toads. Nature 439:803.
Piiroinen, S., T. Ketola, A. Lyytinen, and L. Lindstrom. 2011. Energy use, diapause behaviour and northern range expansion potential
in the invasive Colorado potato beetle. Functional Ecology 25:527–
536.
Richardson, D. M., and M. Rejmanek. 2011. Trees and shrubs as inva-sive alien species: a global review. Diversity and Distributions 17:
788–809.
Roff, D. 1980. Optimizing development time in a seasonal environ-ment: the ups and downs of clinal variation. Oecologia (Berlin)
45:202–208.
RStudio Team. 2015. RStudio: integrated development for R. RStudio, Boston. http://www.rstudio.com/.
Saastamoinen, M. 2007. Mobility and lifetime fecundity in new
ver-sus old populations of the Glanville fritillary butterfly. Oecologia
(Berlin) 153:569–578.
Sabelis, M. W. 1981. Biological control of two-spotted spider mites using phytoseiid predators. I. Modelling the predator-prey inter-action at the individual level. Centre for Agricultural Publishing and Documentation, Wageningen.
SAS Institute. 2013. SAS software. Version 9.4. SAS Institute, Cary, NC. Shine, R., G. P. Brown, and B. L. Phillips. 2011. An evolutionary pro-cess that assembles phenotypes through space rather than through time. Proceedings of the National Academy of Sciences of the USA
108:5708–5711.
Tauber, M. J., C. A. Tauber, and S. Masaki. 1986. Seasonal adapta-tions of insects. Oxford University Press, Oxford.
Therry, L., D. Bonte, and R. Stoks. 2015. Higher investment inflight
morphology does not trade off with fecundity estimates in a poleward
range-expanding damselfly. Ecological Entomology 40:133–142.
Therry, L., E. Lefevre, D. Bonte, and R. Stoks. 2014a. Increased
ac-tivity and growth rate in the non-dispersive aquatic larval stage
of a damselfly at an expanding range edge. Freshwater Biology
59:1266–1277.
Therry, L., V. Nilsson-Ortman, D. Bonte, and R. Stoks. 2014b. Rapid
evolution of larval life history, adult immune function andflight
muscles in a poleward-moving damselfly. Journal of Evolutionary
Biology 27:141–152.
Therry, L., A. Zawal, D. Bonte, and R. Stoks. 2014c. What factors shape
female phenotypes of a poleward-moving damselfly at the edge of its
range? Biological Journal of the Linnean Society 112:556–568.
Thomas, C. D., E. J. Bodsworth, R. J. Wilson, A. D. Simmons, Z. G. Davies, M. Musche, and L. Conradt. 2001. Ecological and
evolution-ary processes at expanding range margins. Nature 411:577–581.
Travis, J. M. J., M. Delgado, G. Bocedi, M. Baguette, K. Barton, D. Bonte, I. Boulangeat, et al. 2013. Dispersal and species' responses
to climate change. Oikos 122:1532–1540.
Travis, J. M. J., and C. Dytham. 2002. Dispersal evolution during
invasions. Evolutionary Ecology Research 4:1119–1129.
Van Petegem, K. H. P., J. Boeye, R. Stoks, and D. Bonte. 2016. Data from: Spatial selection and local adaptation jointly shape life-history evolution during range expansion. American Naturalist, Dryad Dig-ital Repository, http://dx.doi.org/10.5061/dryad.n0c67.
Van Petegem, K. H. P., J. Pétillon, D. Renault, N. Wybouw, T. Van Leeuwen, and D. Bonte. 2015. Empirically simulated spatial sort-ing points at fast epigenetic changes in dispersal behaviour.
Evo-lutionary Ecology 29:299–310.
Wiegand, T., and K. A. Moloney. 2014. Handbook of spatial point-pattern analysis in ecology. CRC, Boca Raton, FL.
Young, S. S. Y., D. L. Wrensch, and M. Kongchuensin. 1986. Control of sex-ratio by female spider-mites. Entomologia Experimentalis
et Applicata 40:53–60.
Zera, A. J., and R. F. Denno. 1997. Physiology and ecology of dis-persal polymorphism in insects. Annual Review of Entomology
42:207–230.
References Cited Only in the Online Appendixes
Bitume, E. V., D. Bonte, S. Magalhaes, G. S. Martin, S. Van Dongen,
F. Bach, J. M. Anderson, et al. 2011. Heritability and artificial
se-lection on ambulatory dispersal distance inTetranychus urticae:
effects of density and maternal effects. PLOS ONE 6:e26927. Bitume, E. V., D. Bonte, O. Ronce, I. Olivieri, and C. M. Nieberding.
2014. Dispersal distance is influenced by parental and
grand-parental density. Proceedings of the Royal Society B 281:20141061. Breslow, N. E. and D. G. Clayton. 1993. Approximate inference in
generalized linear mixed models. Journal of the American
Statis-tical Association 88:9–25.
Fronhofer, E. A., J. M. Stelz, E. Lutz, H. J. Poethke, and D. Bonte. 2014. Spatially correlated extinctions select for less emigration
but larger dispersal distances in the spider miteTetranychus
ur-ticae. Evolution 68:1838–1844.
Griffing, B. 1982. A theory of natural selection incorporating
inter-action among individuals. 10. Use of groups consisting of a mat-ing pair together with haploid and diploid caste members. Journal
of Theoretical Biology 95:199–223.
Hartl, D. L. 1971. Some aspects of natural selection in arrhenotokous
populations. American Zoologist 11:309–325.
Havron, A., D. Rosen, Y. Rossler, and J. Hillel. 1987. Selection on the male hemizygotic genotype in arrhenotokous insects and mites.
Entomophaga 32:261–268.
Lactin, D. J., N. J. Holliday, D. L. Johnson, and R. Craigen. 1995. Im-proved rate model of temperature-dependent development by
arthropods. Environmental Entomology 24:68–75.
Lewis, Z., P. M. Brakefield, and N. Wedell. 2010. Speed or sperm: a
potential trade-off between development and reproduction in the
butterfly, Bicyclus anynana (Lepidoptera: Nymphalidae).
Euro-pean Journal of Entomology 107:55–59.
Logan, J. A., D. J. Wollkind, S. C. Hoyt, and L. K. Tanigoshi. 1976. An-alytic model for description of temperature-dependent rate
phe-nomena in arthropods. Environmental Entomology 5:1133–1140.
Nunney, L. 1996. The response to selection for fast larval
develop-ment inDrosophila melanogasterand its effect on adult weight:
an example of afitness trade-off. Evolution 50:1193–1204.
SAS Institute. 2008. SAS/STAT 9.2 user’s guide. SAS Institute, Cary,
NC.
Schneider, C. A., W. S. Rasband, and K. W. Eliceiri. 2012. NIH
Im-age to ImIm-ageJ: 25 years of imIm-age analysis. Nature Methods 9:671–
675.
Tien, N. S. H., M. W. Sabelis, and M. Egas. 2011. Ambulatory
dis-persal in Tetranychus urticae: an artificial selection experiment
on propensity to disperse yields no response. Experimental and
Applied Acarology 53:349–360.
Tsikliras, A. C., E. Antonopoulou, and K. I. Stergiou. 2007. A pheno-typic trade-off between previous growth and present fecundity in
round sardinellaSardinella aurita. Population Ecology 49:221–227.
Verbeke, G., and G. Molenberghs. 2000. Linear mixed models for longitudinal data. Springer, New York.
Wolfinger, R. D., and M. A. O’Connell. 1993. Generalized linear
mixed models: a pseudo-likelihood approach. Journal of Statistical
Computation and Simulation 48:233–243.
Yadav, P., and V. K. Sharma. 2014. Correlated changes in life history traits in response to selection for faster pre-adult development in
the fruitflyDrosophila melanogaster. Journal of Experimental
Bi-ology 217:580–589.
Associate Editor: Christopher G. Eckert Editor: Yannis Michalakis