Er Kara, M., Oktay Fırat, S. and Ghadge, A. (2019), “A data mining-based framework for supply chain risk management”, Computers & Industrial Engineering, Accepted.
A data mining-based framework for supply chain risk management
Abstract
Increased risk exposure levels, technological developments and the growing information overload in supply chain networks drive organizations to embrace data-driven approaches in Supply Chain Risk Management (SCRM). Data Mining (DM) employs multiple analytical techniques for intelligent and timely decision making; however, its potential is not entirely explored for SCRM. The paper aims to develop a DM-based framework for the identification, assessment and mitigation of different type of risks in supply chains. A holistic approach integrates DM and risk management activities in a unique framework for effective risk management. The framework is validated with a case study based on a series of semi-structured interviews, discussions and a focus group study. The study showcases how DM supports in discovering hidden and useful information from unstructured risk data for making intelligent risk management decisions.
Keywords: Data mining; Data analytics; Decision support system; Supply chain risk management 1. Introduction
Risk is an important issue threatening sustainability and competitiveness of supply chains (Aqlan & Lam, 2016; Brusset & Teller, 2017). The frequency, severity and variety of supply chain (SC) risks are accelerating as a result of increasing globalization, customer expectations and shorter product life cycles in SC networks (Norrman & Jansson, 2004; World Economic Forum, 2017). Supply chains are exposed to various internal and external risks with different forms, probabilities and impacts (Chen & Wu, 2013; Guertler & Spinler, 2015). These risks can result from a wide variety of sources including uncertain demand, supply interruptions, volatile exchange rate, political instability, dynamic consumer markets and even unexpected events such as work accidents, cyber-attacks, natural disasters and terrorism (Er Kara, & Oktay Fırat, 2017; Rajagopal, Venkatesan, & Goh, 2017). The triggering factors of SC risks, their relationships and consequences are very complex to measure due to the complex nature of these networks (Vilko & Hallikas, 2012; Brusset & Teller, 2017); and require dealing with huge amounts of different and distributed data/information sources (Schlegel & Trent, 2014; Yu, Chavez, Jacobs, & Feng, 2018).
Published by Elsevier. This is the Author Accepted Manuscript issued with: Creative Commons Attribution Non-Commercial No Derivatives License (CC:BY:NC:ND 4.0). The final published version (version of record) is available online at DOI:10.1016/j.cie.2018.12.017. Please refer to any applicable publisher terms of use.
The scope, variety, volume and velocity of data is constantly increasing due to advances in the information and communication technologies (Addo-Tenkorang & Helo, 2016). Technological developments and the growing information over-load drive organizations to use data-driven decision-making approaches (Lee, Zhou, Souza, & Park, 2016; Long, 2018). A growing number of organizations have started to use Business Intelligence (BI) and Data Mining (DM) approaches to make efficient, intelligent and timely decisions (Heaney, 2015; Wu, Yue, Jin, & Yen, 2016; Ponemon Institute, 2017). DM plays a critical role in gaining valuable insights into potential SC risk factors, their sources, impacts and inter-relationships (Ranjan & Bhatnagar, 2011). DM techniques can be used in various stages of SCRM to develop proactive and reactive systems (Wu, Chen, & Olson, 2014; Lee, Kim, & Lee, 2017). There are various studies that employ DM techniques for detection and assessment of selected risks in different research fields (e.g. Ruiz-Torres, Mahmoodi, & Zeng, 2013; Le, Arch-int, Nguyen, & Arch-int, 2013; Blackhurst, Rungtusanatham, Scheibe, & Ambulkar, 2018). However, despite the growing research interest, the academic literature is scarce and distributed. There is lack of a systematic framework for utilizing unstructured (risk) data for SCRM (Tobback, Bellotti, Moeyersoms, Stankova, & Martens, 2017). Furthermore, how to convert risk management problems into DM problems for making robust risk management decisions remains a challenge. A holistic framework with an ability to integrate DM and risk management approaches is highly desirable to better comprehend the big data. This paper contributes to the literature by presenting a novel SCRM framework supported by DM approaches for identification, assessment and mitigation of different types of SC risks.
The proposed framework is developed following a literature review of relevant areas and expert opinion of SC managers and BI experts. This systematic model provides a comprehensive guideline by covering various activities of a data-driven risk management such as: identification of risk indicators, collection of risk data, building a risk-oriented data warehouse, properties of a risk analysis and management team, conversion of the SCRM problem into a DM problem, and interpretation of the results of DM algorithms for risk management purposes. The framework is validated with a case study in the heavy machinery sector, and important suggestions are provided for the implementation of the proposed approach. The developed framework is believed to set a benchmark for future academic research in the application of DM algorithms in SCRM.
The rest of this paper is organized as follows. Section 2 presents the literature review on key building blocks - BI and DM tools and techniques in SCRM. Section 3 summarizes the employed research methodology. Section 4 introduces the proposed DM-based SCRM framework. The main steps, implementation issues, advantages and limitations of the proposed model are explained in this section. Section 5 presents a case study where the framework is implemented and tested. The section discusses some of the practical implementation issues and limitations of the framework. Finally, the paper concludes with a discussion of the contribution to research and practice and identifies several future research directions.
2. Literature review
There are myriad natural and man-made risks threatening the physical assets and operations in SC networks. Some of these risks include price fluctuation, volatile demand, supply problems, operational risks, delivery risk, reputational risk, and natural disasters (Chen & Wu, 2013; Rajagopal, Venkatesan, & Goh, 2017). Decrease in operational performance, damage to brand value, physical assets and bankruptcy are some of the occurring consequences of SC risks. SCRM is the systematic approach of identifying, assessing and mitigating risks in SCs (Ghadge, Dani, & Kalawsky, 2012). The aim of SCRM is to understand risks and their effects, and try to take proactive and preventive actions for mitigation. Today’s information and communication technologies provide the opportunity to gather, store and analyze a diverse set of risk-related data from heterogeneous data sources (Schlegel & Trent, 2014; Lee, Zhou, Souza, & Park, 2016; Kang et al., 2017). The “Risk Intelligence (RI)” concept has emerged as a result of these developments (Lee & Kulkarni, 2011; Ponemon Institute, 2017). Risk intelligence can be defined as an organization’s ability to identify, measure, assess and predict threats by using relevant past data and experience (Apgar, 2006). Limited academic studies examine risk behaviour or intelligence from a SC point of view (Ghadge, Dani, Chester, & Kalawsky, 2013).
It is clear that organizations cannot manage their risk without managing their data and information/knowledge (Neef, 2005); thus, many organizations have started to use automated risk management frameworks to compete in today’s knowledge driven business environment (Haksöz, 2013; Wu, Chen, & Olson, 2014). Despite the high interest in industry, academia has been lagging in terms of the use of BI for management of SC risks (Liu, Daniels, & Hofman, 2014; Wu, Chen, & Olson, 2014; Aruldoss, Travis, & Venkatesan, 2015). BI contains the databases, tools, methods, processes and technologies for the transformation of raw data into meaningful and useful
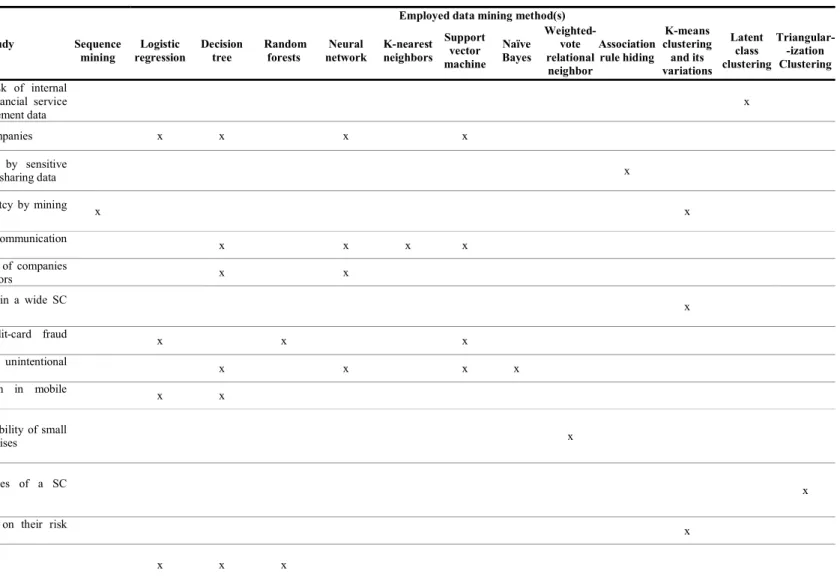
information for business analysis purposes. Extract, Transform and Load (ETL), data warehousing, Online Analytical Process (OLAP), statistical analysis, prediction and visualization are some of the key tools/technologies from BI (Sherman, 2015; Coronel & Morris, 2017). Similarly, DM plays a critical role in providing a BI environment (Ranjan & Bhatnagar, 2011) and has several applications in different areas (Giudici & Figini, 2009; Köksal, Batmaz, & Testik, 2011; Murray, Agard, & Barajas, 2017). DM uses algorithms to discover hidden, previously unknown and useful information and patterns from large data sets (Han, Kamber, & Pei, 2012; Witten, Frank, Hall, & Pal, 2017). DM is used for forecasting demand and price in volatile markets, identification of risky customers and markets, fraud detection and supporting early warning systems (Seng & Chen, 2010; Carneiro, Figueira, & Costa, 2017; Lee, Kim, & Lee, 2017). Table 1 summarizes some of the DM applications in the risk management literature.
DM techniques are frequently used in Customer Relationship Management (CRM), customer churn prediction, and customer risk analysis in the insurance and banking sectors (Keramati et al., 2014; De Caigny, Coussement, & De Bock, 2018). Saradhi and Palshikar (2011) present a literature review on some techniques that are commonly used to build predictive customer churn models, e.g., Naïve Bayes, Support Vector Machine (SVM), decision tree and random forests. DM algorithms are also used to provide critical insights into risky customers by analyzing customer data such as payment records, credit card data, satisfaction rates, and credit risk scores (Tsiptsis & Chorianopoulos, 2009). Xiong, Wang, Mayers, and Monga (2013) propose a DM-based personal bankruptcy prediction system that uses credit card data. They use sequence mining techniques for prediction and later propose a novel model-based k-means clustering algorithm to discover sequence patterns. Recently, Lee, Kim, and Lee (2017) have developed a model to predict customer churn in the mobile industry by analyzing words in online media. Another popular application area of DM is financial risk assessment. Prediction methods play a critical role in developing early warning systems for financial crises. Geng, Bose, and Chen (2015) use multiple classification algorithms (such as NN, decision tree and SVM) to predict financial distress in a set of companies based on 31 financial indicators. Recently, Dutta, Dutta, and Raahemi (2017) have developed a predictive model for both intentional and unintentional financial restatements. They employ multiple classification algorithms (e.g. ANN, decision tree, Naïve Bayes, SVM, and Bayesian Belief Network). Olson, Delen, and Meng (2012) apply decision tree, SVM, NN and
Table 1. Overview of DM methods for risk management
Research from the risk management
literature
Aim of the study
Employed data mining method(s) Sequence
mining regression Logistic Decision tree Random forests network Neural K-nearest neighbors
Support vector machine Naïve Bayes Weighted-vote relational neighbor Association rule hiding K-means clustering and its variations Latent class clustering Triangular- -ization Clustering Jans, Lybaert, and
Vanhoof (2010)
Evaluate the current risk of internal corporate fraud of a financial service provider based on procurement data
x
Olson, Delen, and
Meng (2012) Predict bankruptcy of companies x x x x
Le, Arch-int, Nguyen, and Arch-int (2013)
Avoid the risk caused by sensitive
knowledge leakage when sharing data x
Xiong, Wang, Mayers, and Monga (2013)
Predict personal bankruptcy by mining
credit card data x x
Keramati et al.
(2014) Predict churn in telecommunication industry x x x x
Geng, Bose, and
Chen (2015) Predict financial distress of companies based on financial indicators x x
Yin, Fu,
Ponnambalam, and Goh (2015)
Identify high-risk zones in a wide SC
network x
Carneiro, Figueira,
and Costa (2017) Risk scoring for credit-card fraud detection x x x
Dutta, Dutta, and
Raahemi (2017) Predict intentional and unintentional financial restatements x x x x
Lee, Kim, and Lee
(2017) Predict customer churn in mobile industry x x
Tobback, Bellotti, Moeyersoms, Stankova, and Martens (2017)
Predict bankruptcy probability of small
and medium sized enterprises x
Blackhurst, Rungtusanatham, Scheibe, and Ambulkar (2018)
Assess the vulnerabilities of a SC
network to disruptions x
Er Kara and Oktay Fırat (2018)
Cluster suppliers based on their risk
profile x
De Caigny, Coussement, and
logistic regression to a sample data of 100 US firms that underwent bankruptcy and compared the performance of these algorithms. Similarly, Tobback, Bellotti, Moeyersoms, Stankova, and Martens (2017) use weighted vote relational neighbor classifier method to predict bankruptcy probability of small and medium sized enterprises by using financial and non-financial data.
DM techniques are also used for fraud detection in the telecommunications, insurance and finance sectors (Ngai, Hu, Wong, Chen, & Sun, 2011). Jans, Lybaert, and Vanhoof (2010) use a multivariate latent class clustering algorithm on the procurement data of an international financial service provider to evaluate the current risk of internal corporate fraud. Similarly, Carneiro, Figueira, and Costa (2017) have developed a DM-based risk scoring system for credit-card fraud detection.
The literature review shows that classification techniques such as decision tree, NN, and SVM are frequently used for risk prediction in different research fields (Ngai, Hu, Wong, Chen, & Sun, 2011, Aggarwal, 2015; Dutta, Dutta, & Raahemi, 2017). Cluster analysis is another common DM technique in the risk management area (Jans, Lybaert, & Vanhoof, 2010). Some researchers use clustering to group companies or market zones to explore, understand and explain risks in SC networks. Yin, Fu, Ponnambalam, and Goh (2015) propose a network connectivity embedded k-means clustering approach to identify high-risk zones and decrease the complexity of a wide SC network. More recently, Blackhurst, Rungtusanatham, Scheibe, and Ambulkar (2018) have combined Petri nets and Triangularization Clustering Algorithm to understand how SC network structures can lead to the vulnerability of a SC to disruptions and examined propagation of these disruptive events. It is evident that DM techniques can be effectively used for risk management. However, current research studies focus only on certain type of risks and DM algorithms (e.g. Xiong, Wang, Mayers, & Monga, 2013; Lee, Kim, & Lee, 2017; Kang et al., 2017) and an integrated framework is missing. Furthermore, how to convert risk management problems into DM problems for making robust risk management decisions within supply chains remains a challenge. Thus, there is a need for a holistic and systematic DM-based SCRM approach to accommodate most types of risks and growing information overloads in SCs.
3. Research Methodology
The aim of this research is to develop a DM-based SCRM framework by integrating multiple activities such as, identification of risk indicators, collection and storage of risk data, translation of the risk management problem into a DM problem, analysis of the data by using DM algorithms, and interpretation of the results to identify intelligent risk mitigation strategies. For achieving this framework, knowledge of multi-disciplinary areas and a multiple data collection and assessment approach was essential. First, the SCRM, DM, data warehousing and information management system literatures were reviewed to develop a conceptual model. Identification of a risk management team and choice of the DM technique plays a critical role in developing such a complex model. The conceptual model was improved and validated using primary data from interviews and discussions with SC and IT experts.
Types, severity and frequency of risks vary according to the industry, business and structure of the company. Also each company has its own risk profile and risk attitude. Therefore, testing of the proposed framework was attempted in order to gain important insights, comments and criticism from the practitioners’ point of view. A case company was utilized in order to understand the challenges of implementing a developed framework. The selected case company operates globally in the heavy machinery sector in Turkey. It manufactures machinery and equipment and also establishes complete turn-key facilities for different industries including mining, cement, wood, defense, iron & steel, work machines, energy and ship building.Earlier, the case company was negotiating with Enterprise Resource Planning (ERP) software vendors to integrate all of its processes (human resources, purchasing, production, research and development, sales, transportation, finance, etc.) in a single platform to improve process management and gain competitive advantage. Therefore, this company was selected to apply the proposed data-driven risk management approach as they were also struggling with risk management issues. Firstly, in-depth semi structured interviews, field observations and focus groups were conducted to identify the core risks that threaten different functional units and complexities in sharing information across their process units. This primary data on core risks and data/information integration challenges provided a basis for the proposed risk data warehouse structure.
Later, a risk evaluation form was circulated to gather data on the distribution of the risks and risk exposure levels of different SC functions. Based on the results of this data, clustering analysis was proposed to group suppliers based on their risk profile (explained in a subsequent section).
Through the implementation and testing of the framework in the case company, several valuable inferences were drawn in terms of the applicability of the proposed framework.
4. Development of data mining-based framework
This section presents the development of the DM-based SCRM framework. First, a general overview of the model is provided. In a later section, the core stages of the model are explained. 4.1. Overview of the model
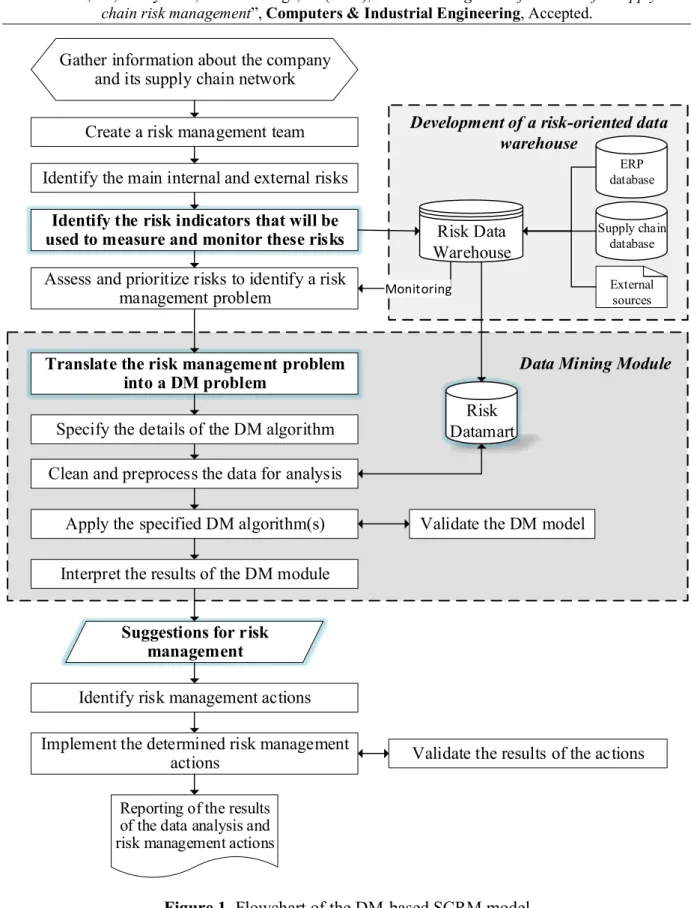
Risk originates due to a lack of information, and its identification is an intricate and costly process due to the high uncertainty of event occurrence and difficulty in collecting and analyzing the risk data. DM tools and techniques have the potential to convert risk data/metrics into useful information/knowledge for more effective, intelligent and timely SCRM decisions. The unique ability to detect and assess risks, discover risk sources, identify risk patterns and relationships, predict risk events, and classify risky items via historical data analysis and real-time data processing makes DM a valuable approach (Saradhi & Palshikar, 2011; Ngai, Hu, Wong, Chen, & Sun, 2011; Lee, Kim, & Lee, 2017). In order to develop a holistic data-driven SCRM framework, key principles from DM, data warehousing and risk management were methodically integrated. The step-by-step approach for the development of the DM-based SCRM framework is presented in Figure 1. The core stages of the proposed model are: i) identification of risk indicators, ii) development of a risk data warehouse to gather and store risk data, and iii) incorporation of a DM module that includes the conversion of the risk management problem into a DM problem and interpretation of the analysis results for risk management actions.
Identifying and quantifying the internal and external risks requires a certain level of knowledge about the structure of the SC network and the physical, financial and information flows within the network. Therefore, the conceptual framework developed from the literature was decided upon and implemented in the focal company. This step gives us knowledge about the position of the company within the network, its relations with other stakeholders, the risk exposure and resilience levels of the industry, risk appetite of the company and current risk management practices. This step contains the following four sub-tasks:
Gather information about the company and its supply chain network Create a risk management team Identify the main internal and external risks
Identify the risk indicators that will be used to measure and monitor these risks Assess and prioritize risks to identify a risk
management problem
Translate the risk management problem into a DM problem
Specify the details of the DM algorithm Clean and preprocess the data for analysis
Apply the specified DM algorithm(s) Interpret the results of the DM module
Suggestions for risk management
Identify risk management actions Implement the determined risk management
actions Validate the results of the actions Reporting of the results
of the data analysis and risk management actions
Risk Data Warehouse ERP database Supply chain database External sources
Data Mining Module Development of a risk-oriented data
warehouse
Risk Datamart
Validate the DM model
Monitoring
i) Collect information about the company: The firm’s size, experience, business environment, sector, and structure of the SC network have a significant impact on the type and distribution of risks. Each risk management model must be developed by considering such crucial information and should align with the mission, business objectives and strategy of the company.
ii) Map the SC network: SC maps provide a bigger picture and thus help to increase the visibility of the SC network. Visualization techniques may be helpful for a better network representation to discover and address potential risk areas: e.g., SC heat maps (Basole & Bellamy, 2014; Schlegel & Trent, 2014).
iii) Determine the risk attitude of the firm: The risk attitude and tolerance level of companies affect the risk identification, assessment and perception, and choice of risk mitigation activities (Heckmann, Comes, & Nickel, 2015). There may be absolutely zero tolerance of risk for complying with laws and regulations in some sectors such as healthcare and defense.
iv) Evaluate the company’s resilience level to risks: Companies can prioritize their critical risk areas and focus their risk management practices in these areas by examining their resilience to different risk factors. Previous steps help to gain information about the resilience level of the company in the context of SC risks.
Each of the aforementioned steps has an effect on the prioritization of risks, identification of risk management problems, and the potential risk response strategy of the company. The next major step is the identification of a risk management team which will be responsible from the SCRM process. Details of this step are provided in section 4.2. The risk management team determines the main internal and external SC risks and identifies the risk indicators that will be used to quantify and track these risks. From multiple methods used in the identification of risk events the most commonly used data collection approaches are survey, interview, focus group, discussion, and field observations including historical records (Thun & Hoenig, 2011; Chen & Wu, 2013; Aqlan, 2016). Risk indicators were used to measure and monitor these risks. Risk data come from various different internal and external data sources; therefore, development of a risk-oriented data warehouse provides a centralized data repository by gathering different types of risk data. The development of a risk data warehouse is a complex stage including various sub-steps; therefore, the steps followed for this stage are explained in section 4.3.
Identification of the risk indicators and the development of a risk data warehouse provides the main basis for risk data analysis. The next step is the assessment of the probability, consequences and detectability of the risks and their inter-relationship to identify the critical parts of the SC that are prone to disruptions. A DM module is added to the SCRM framework that takes the risk management problems as an input and provides information/suggestions for risk management as an output (see section 4.4 for details). This stage starts with the translation of the risk management problem into a DM problem and is the most critical step that affects the efficiency and success of the proposed framework. The details of the DM algorithm are specified, and the data is pre-processed for analysis. The required data for the identified problem is gathered from the risk data warehouse via a risk data mart that is a subset of the data warehouse subject to the determined DM analysis. The specified DM algorithm is applied, and the results are interpreted to provide useful strategies for the risk management problem. Determined risk management strategies and practices are implemented based on the knowledge supported by the DM module. The core stages of the proposed framework are explained in the following sections.
4.2. Creating risk management team & identifying main risks
After analysis of the structure of the company and its external environment, the second step is to develop a risk management team. DM-based SCRM requires a collaborative effort of a cross-disciplinary team with different backgrounds and expertise. A data analyst or DM expert is necessary in the team to conduct analysis of the risk data following DM methods. The roles and responsibilities of the team members should be identified in advance in order to prevent confusion and improve workforce efficiency. The DM module should be executed by a team consisting of domain experts, data analysts, and information technology (IT) specialists (Refaat, 2007; Myatt & Johnson, 2014). According to Feelders, Daniels, and Holsheimer (2000), three types of expertise are needed for the analysis phase of DM: knowledge of the application domain, data expertise and DM expertise. Data warehousing and DM requires both technical skills and data management knowledge; hence, the risk management team should contain people from both technical and business sides (Anderson-Lehman, Watson, Wixom, & Hoffer, 2004). The risk analysis and management committee in the proposed model consists of four main types of experts: i) Risk management experts, ii) Domain experts, iii) DM experts, and iv) IT specialists.
Risk Management Experts: Risk management experts are needed to guide other members in the identification and measurement of risks, and determination of risk management actions. Domain Experts: Domain experts are risk owners and are selected from the application domain. They are responsible for the identification of internal and external risk factors within the current SC.
DM Experts (or data analysts): The proposed DM module utilizes multiple DM tools and techniques; hence, DM expertise is of significant importance for analysis of risk data. In addition to the technical knowledge on data analysis and management, DM experts should also have a certain level of knowledge about the application domain and SC risks for effective coordination with the team.
IT specialists: The development of the DM-based SCRM model requires an IT infrastructure; hence, there should be an IT expert(s) in the risk management team. The IT expert is responsible for data integration, data access, development of a risk data warehouse and IT infrastructure, integration of the DM module with the operational system of the company, and identification, installation, and implementation of the required software and hardware. 4.3. Building a risk data warehouse
Data warehouses provide data infrastructures for decision support systems (Vaisman & Zimányi, 2014). The DM module is integrated with a risk-oriented data warehouse to provide a systematic and interactive data analysis platform. The Risk Data Warehouse (RDW) is the central repository that gathers and stores both current and historical SC risk data from different internal and external data sources. The RDW can be seen as the corporate’s risk memory and provides the opportunity of analytical processing, monitoring, and reporting of risk data in order to support data-driven decision-making (Linoff, & Berry, 2011; Jukic, Vrbsky & Nestorov, 2017). Waterfall methodology is widely used for building data warehouse systems, and variations of the traditional model have been proposed for building systems (Royce, 1970). We adapted the waterfall methodology presented by Rainardi (2008) for defining ten basic steps for the development and deployment of an RDW. Building a data warehouse is an enterprise-wide complex and costly process, therefore, first a feasibility study should be performed to assess this investment. A company may prefer to develop a separate RDW or adapt its current data warehouse by including risk indicators for the new risk data analysis platform. Small companies may also prefer to use data marts because of the high cost of data warehouses (Han, Kamber, & Pei, 2012). Data marts are subject-oriented simple
data repositories that are developed for a particular business. The choice of the company depends on various issues including: variety of risk types, risk exposure level of the company, volume of risk data, frequency of risk problems, and the budget of the company.
The second step is the identification of risk indicators and determining the sources of risk data. Risk indicators are measurements, statistics or parameters of risk drivers and represent the exposure level to a risk factor over time (Rodriguez & Chadha, 2016). There are myriad indicators that can be used to measure and track different types of risks such as cost of defects, complaint rate, delivery reliability, exchange rate volatility, etc. These indicators are used for the detection, assessment and monitoring of risks. Some of the data collection methods for risk-related data are listed below:
Gathering risk data from SC information systems: Risk data, especially operational risk indicators, are generally directly collected from various operational databases such as ERP and CRM databases (Management Solutions, 2014; Robertson, 2016).
Gathering risk data from external databases: Risk data may also be gathered from external databases provided by government agencies, insurance companies, commercial providers, consultancy agencies, and local and international consortiums (Knemeyer, Zinn, & Eroglu, 2009; Franzetti, 2011). Global Operational Risk Loss Data (GOLD), Operational Risk Data Exchange (ORX), and American Bankers Association (ABA) are several examples for data consortiums (Franzetti, 2011; Management Solutions, 2014). Other external data sources include geographical location data, real time data associated with natural disasters (e.g., earthquake, hurricane), weather conditions, and social media data provided by external information providers (Goh et al., 2013; IBM, 2014).
Failure Mode and Effects Analysis (FMEA): A typical FMEA table for risk identification and assessment includes the following columns: risk factors, frequency, severity, risk priority number, recommended risk management actions and responsible staff (Chen & Wu, 2013; Giannakis & Papadopoulos, 2016). A risk priority number is calculated by multiplying the probability, severity and detectability of the risk. Some researchers also incorporate the likelihood of being detected (ease of detection) either before or after they occur (Giannakis & Papadopoulos, 2016).
Simulation: Simulation is a representation of the behavior of a real system using a computer. Simulation models can be used to model the behaviour of risks, discover the triggering factors, quantify risks, and analyze their consequences (Bandaly, Satir &
Shanker, 2016; Rajagopal, Venkatesan, & Goh, 2017; Ojha, Ghadge, Tiwari & Bititci, 2018). Simulation gives the opportunity to analyze a high number of risk scenarios by changing the model parameters and provides data about the behavior of the risk under different circumstances.
Use of monitoring devices to collect risk data:Technological devices may be used to track items or determine metrics such as temperature and pressure. Monitoring devices include RFID systems, sensors, cameras, motion sensors, wearable devices, energy monitoring systems, etc. (Kim, Kim, Kim, & Jung, 2016).
The frequency of risk data update is an important decision point that depends on the risk type and the industry. While timely data carry significant importance for some critical risk factors such as the warehouse temperature level in cold chains, flood estimations may be updated periodically due to the seasonality of this risk (Knemeyer, Zinn, & Eroglu, 2009). Data warehousing gathers and stores data from various sources in a common and consistent format (Linoff, & Berry, 2011), and makes risk-related data accessible, appropriate, and ready for the DM problem. A conceptual risk data model is developed to understand and organize the format of different entities and illustrate the inter-relationships between different data elements. Risk data are transferred by an ETL process and organized in the RDW by data type, attributes, data source and relationships. Different schemas such as star schema and snowflake schema can be used to build a risk data model based on the data source (Jukic, Vrbsky & Nestorov, 2017; Coronel & Morris, 2017). The data transformations need to be defined to convert the data into the appropriate form for the data warehouse model (Silverston, 2001; Vaisman & Zimányi, 2014). Data pre-processing steps include data cleaning, integration, reduction, and transformation (Han, Kamber & Pei, 2012). Various types of transformation procedures can be used to measure risk factors including normalization, smoothing, aggregation, attribute construction, discretization, and generalization (Rainardi, 2008; Witten, Frank, Hall, & Pal, 2017). Composite risk indicators and formulations may also be generated to measure some risk types (Hoffman, 2002). Selecting data and pre-processing are the most time-consuming activities (Feelders, Daniels, & Holsheimer, 2000; Han, Kamber & Pei, 2012).
The next step is the design of risk data warehouse architecture. This step includes design and specification of the data sources, staging, ETL system, data flows, data storage, metadata, front-end applications, and presentaton layer of the data warehouse (Rainardi, 2008; Vaisman &
Zimányi, 2014; Jukic, Vrbsky & Nestorov, 2017). The data source layer of the data warehouse includes different internal and external sources of risk data that will be utilized in the RDW. In the data-staging phase, risk-related data are extracted from the operational databases or external sources to the data warehouse through the ETL process. The data is transformed into an analytical structure in the ETL layer. The data storage layer includes the transformed and cleansed risk data. The RDW also contains risk metadata (Vaisman & Zimányi, 2014). The metadata layer is very important for the DM-based SCRM model because it includes information about risk indicators such as the source of data, related risk factors, location of the risk (e.g., business process such as ordering, supplier selection, shipping), owner of the risk, and data collection frequency and methods (Kayis & Karningsih, 2012; Liu, Daniels, & Hofman, 2014). It can be seen as a roadmap to access risk data. After the design of the RDW architecture, the required technology and physical infrastructure need to be identified based on the scale of the data flow and budget of the company. The following issues should be specified: storage area, database server, ETL server, hardware platform, network topology, required software, client computers, and user interface (Coronel & Morris, 2017). Then, the designed RDW will be developed and physical linkages will be carried out between the elements of the RDW architecture. The final step is to test and implement the RDW by extracting data from internal and external databases.
4. 4. Analysis of risk data using data mining module
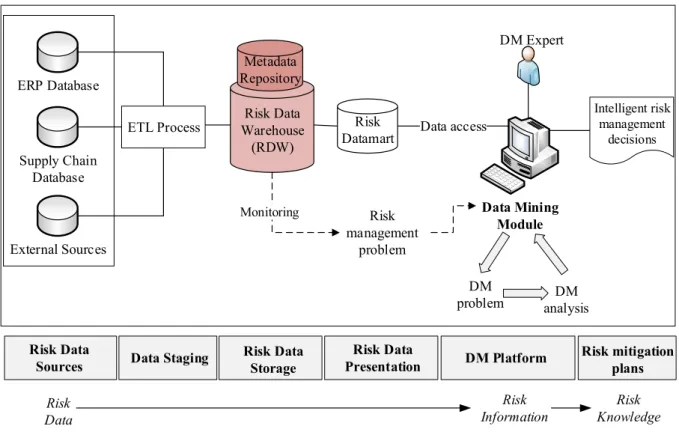
The aim of the DM module is to convert the risk data to risk information/knowledge in order to make intelligent decisions for SCRM. Risk data is meaningless until it is subjected to data processing. Risk data is gathered from the server by the DM module and a data mart is created from the RDW for the current DM analysis. In the proposed DM-based SCRM model, the data mart that is subject to the DM algorithm is called a risk data mart. The risk data mart (risk problem database) is a subset of the RDW and created from this data warehouse by transforming, summarizing, and shaping the data according to the requirements of the DM application. Figure 2 summarizes the DM-based architecture that is used to convert risk data to risk information and knowledge.
There are various descriptive and predictive DM tasks that may be used for analyzing risk data such as classification, prediction, regression, association analysis, clustering, anomaly detection, etc. (Jukic, Vrbsky & Nestorov, 2017; Witten, Frank, Hall, & Pal, 2017). Each DM task
has its own functionality; therefore, the selection should be based on the expected output and the needs for the solution. DM tools and techniques may be used for the following issues: detect problems, predict risks and their consequences, identify relationships between risks and other factors (e.g., triggering factors), identify the root causes of risks, cluster risky items, etc. (Hanafizadeh & Paydar, 2013; Geng, Bose, & Chen, 2015; Carneiro, Figueira, & Costa, 2017; Kang et al., 2017). Prediction tools may be applied to predict risk factors and future risk data trends.
External Sources Supply Chain Database ERP Database Data Mining Module DM Expert Data access Risk Data
Sources Data Staging Risk Data Storage DM Platform
Risk Datamart Risk Data Warehouse (RDW) Metadata Repository ETL Process Risk Data Risk Information Risk Data Presentation Risk Knowledge Intelligent risk management decisions Risk management problem DM problem analysisDM Monitoring Risk mitigation plans
Figure 2. A general DM-based architecture to convert risk data to risk information and knowledge
Supply chain risk management problem
Identification of the sources of risks
Operational risks Environmental risks Uncertain demand
Supply risk Price
volatility
Data mining problem Convert the risk management problem
into a data mining problem
K-means clustering Sequence mining Decision tree Neural Network Support Vector Machine Exchange rate volatility
Predicting risks and their consequences
Identification of the relationships between different risks
Characterizing different items, processes, supply chain stakeholders or market zones based on their risk profile (e.g. create a
profile of risky customers) Detecting decreasing patterns in
performance factors
Detecting anomalies within datasets Developing early warning systems for
risks Classification Prediction Time-series analysis Association analysis Clustering Summarization Anomaly detection How can we find the factors that lead to
risks?
How can we build a model for predicting the value of a risk (e.g. demand volatility)
or its consequence?
How can we analyse the interrelationships between different risk factors? How can we characterise and summarise
different products, processes, suppliers, customers or market zones according to
their risk level? Predicting the risk levels of different
supply chain members or zones How can we predict the risk levels of new customers, suppliers or supply/market zones?
How can we discover unfavourable patterns that lead to risks?
How can we detect anomalies, abnormal values, outliers, errors and frauds within data sets? (e.g. anomaly detection in
banking operations)
As an example, a company may use prediction techniques to understand how their cash value, revenue, and growth rate are affected by different risk factors including changes in commodity prices, exchange rate and energy prices. Regression analysis can also be used to predict the values of continuous risk data (Olson, Delen, & Meng, 2012; Carneiro, Figueira, & Costa, 2017). Financial metrics can be used to identify and assess risk exposures; e.g. financial risk prediction and profiling in business. Business growth rate can be estimated by using different variables such as sales win rate, customer churn rate and product market share. Anomaly detection is another common method that is used by financial organizations, insurance companies and telecommunication companies. Anomaly detection may be used to detect unusual events and patterns such as abnormal transactions. Interesting and unusual patterns in risk factors and their sub-factors should be evaluated to examine their effects on the occurrence of risk events (Lee et al., 2013; Liu, Daniels, & Hofman, 2014). The reason for such patterns should be determined to develop effective risk mitigation strategies.
Classification techniques can be used to assign items to certain risk categories, e.g., risk rating of suppliers, customers and market zones (Geng, Bose, & Chen, 2015; Dutta, Dutta, & Raahemi, 2017; Tobback, Bellotti, Moeyersoms, Stankova, & Martens, 2017). Various techniques such as SVM, decision tree, and NN can be used based on the data structure and the preference of the decision-maker (Saradhi & Palshikar, 2011; Lee, Kim, & Lee, 2017). Cluster analysiscan also be used to group items, regions and stakeholders with similar risk and vulnerability attributes (Hanafizadeh & Paydar, 2013; Yin, Fu, Ponnambalam, & Goh, 2015; Blackhurst, Rungtusanatham, Scheibe, & Ambulkar, 2018). Unlike classification, clustering is an unsupervised learning method in which the categories are not pre-defined. Various studies may be conducted to measure the association between different risk indicators, e.g., association between low sales performance and customer dissatisfaction ratings, or association analysis on the relationship between employee turnover rate and employee characteristics.
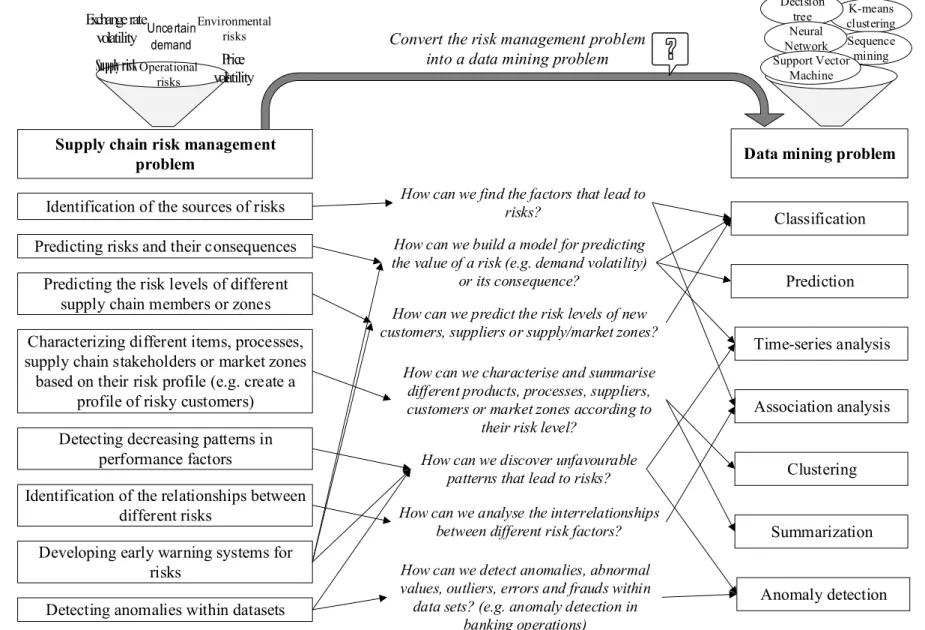
Figure 3 presents a set of questions that can assist decision-makers in converting SCRM problems into a DM problem. The structure includes risk management problem categories, example guide questions that may help in selecting the most helpful DM task, and alternative DM tasks that may provide answers to such risk problems. Decision-makers should also decide on how to use the results of the DM problems in assisting risk management decisions, before specifying the DM
algorithm (Linoff, & Berry, 2011). This decision is important for the effectiveness, practicality, and accuracy of the DM problem formulation.
The selected DM algorithm/model should be evaluated, validated and refined by the DM expert before the interpretation of the results by the risk management team. The selected DM technique may also be compared with other techniques to ensure its validity. Different properties may be used for this comparison such as explanatory power, accuracy, speed, robustness, amount of pre-processing needed, and ease of integration (Gargano & Raggad, 1999). Finally,the results of the selected DM analysis are interpreted with data analysis, risk management and domain experts. The insights gained through the DM model will be used to develop data-driven, effective and intelligent strategies for the identified risk management problem.
4. 5. Interpreting results of the DM module
Interpretation and evaluation of the results of DM algorithm(s) provide transformation of risk information to risk knowledge. DM can provide the following types of information about risks (Ngai, Hu, Wong, Chen, & Sun, 2011; Larose & Larose, 2015):
i) Prediction of risk events
ii) Discovery of risk patterns
iii)Relationship among risks and, between risks and their triggering factors
iv) Classification of different items according to risks v) Clusters of different items based on risk factors
vi) Summarization of the risk data
vii)Visualization of the risk data
This step is crucial because a DM-based SCRM framework is highly dependent on the choice of DM application and evaluation of analysis results. Visualization tools (Visual DM) may be very helpful in interpreting results (Kang et al., 2017). The outputs of the analysis may be stored in the risk database for future references. After analysis and assessment of risk data, the risk analysis and management team should identify the actions for mitigation of focused risk factors. There are various alternative SCRM strategies and techniques (Er Kara & Oktay Fırat, 2016; Ghadge, Dani, Ojha, & Caldwell, 2017). Alternative supply chain strategies should be evaluated by domain experts by considering associated costs and benefits.
5. Implementing and testing the framework in a case company
Firstly, field observations, in-depth semi-structured interviews and discussions were performed to identify the core internal and externals risks that threaten different functional units, and identify and define risk-related indicators based on the requirements of the focal company (Er Kara, 2017). A top-down approach was employed to select the most important risk indicators and the final set of risk indicators were developed following a focus group study. The final set included four types of risk indicators, as proposed by Chapelle (2013): exposure, stress, causal and failure indicators / failed key performance indicators. The Appendix provides some of the risk indicators identified for the focal company. They can be used to measure and track company’s exposure to the pre-determined critical risk factors. The identified risk factors and risk indicators form the basis for development of a risk-oriented data warehouse for the company.
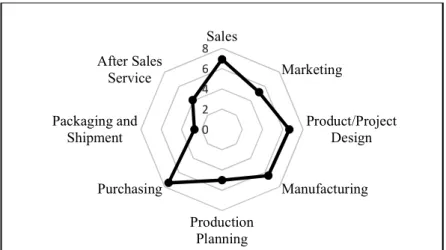
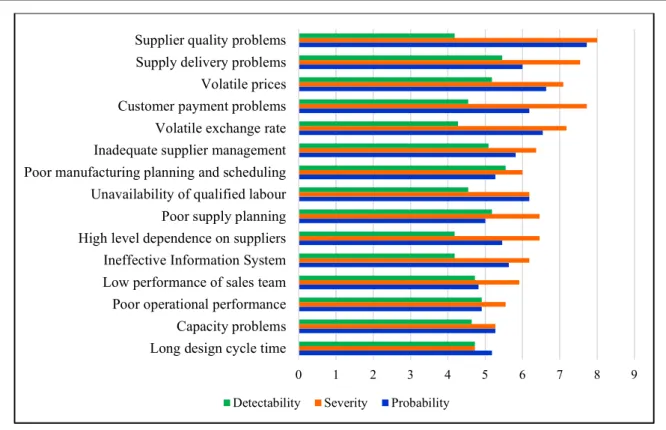
A risk evaluation form was applied to the staff from different departments in order to assess threat domains and understand the distribution of risks within the company and its SC network. Respondents were asked to evaluate potential risks threatening their company by rating probability, consequences and the difficulty of detectability based on a ten-point Likert scale. Figure 4 represents the risk exposure levels of different operational units based on participants’ responses. As seen from the figure, the most risky functions of the company are determined as purchasing, sales and product/project design functions. Figure 5 also provides the top 15 risks identifed in the case company based on the average risk priority numbers. This study helped to identify the risky parts of the SC network and gave empirical evidence and insights for the selection of the risk problem that is subject to the DM analysis.
Figure 4. Spider-web diagram of the risk exposure levels of different operational functions
0 2 4 6 8Sales Marketing Product/Project Design Manufacturing Production Planning Purchasing Packaging and Shipment After Sales Service
Figure 5. Ratings of the top 15 risks based on respondent’s opinion
Based on the ratings of respondents and discussions with managers in the company, the supply risk category was selected as the subject of DM analysis. The company has a make-to-order strategy and produces highly customized products; hence, the performance of the suppliers has a significant impact on the success of the company. An effective procurement and supplier management process considering supplier risk factors is vital for the success of the organization. The main source of the supplier risk resides in both inefficient supplier evaluation and selection process and the difficulty to find an alternative supplier in an emergent situation. Therefore, the main risk management problem may be stated as the characterization of the suppliers based on their risk profile. This problem is translated into a DM problem. For more on the selection of DM application refer to Er Kara and Oktay Fırat (2018). 72 suppliers of the company were assessed based on 17 qualitative and quantitative risk types. The weights of the criteria were determined by using the Best-Worst method (Rezaei, 2016). Factor analysis was applied to decrease the number of criteria. Later, k-means clustering algorithm was applied to group core suppliers of the company based on the generated four risk factors. Three clusters with different risk exposure levels were identified and the results were interpreted to provide insights to mitigate supplier-related risks in
0 1 2 3 4 5 6 7 8 9
Long design cycle time Capacity problems Poor operational performance Low performance of sales team Ineffective Information System High level dependence on suppliers Poor supply planning Unavailability of qualified labour Poor manufacturing planning and scheduling Inadequate supplier management Volatile exchange rate Customer payment problems Volatile prices Supply delivery problems Supplier quality problems
the supplier evaluation and selection phase. The clusters include 19, 11 and 42 suppliers respectively. The mean values of the risk criteria for these clusters are given in Table 2. Cluster 3 has the highest risk scores for most of the risk types, Cluster 2 has average and Cluster 1 lowest risk scores. The results of the cluster analysis help the company to eliminate risky suppliers and obtain manageable smaller and homogeneous supplier groups. The results may also be used to develop specific supplier development programs to reduce supplier-related risks.
Table 2. Means of the 17 risk criteria for the three supplier clusters (Er Kara and Oktay Fırat, 2018)
Cluster 1 Cluster 2 Cluster 3
Previous supplier assessment score (c1) 2.39 2.09 2.29
Commodity price variance (c2) 4.63 6.82 7.31
Financial condition of the supplier (c3) 4.54 3.91 4.91
Percentage of subcontracted work (c4) 0.13 0.34 0.54
Manufacturing capability (c5) 4.93 4.16 5.13
Flexibility (c6) 4.84 4.27 5.07
Technological capability (c7) 4.85 4.12 5.20
Defect rate (c8) 0.12 0.26 0.13
Quality management effort (c9) 4.93 3.51 4.83
Late delivery date (c10) 0.11 0.32 0.15
Lead time variability (c11) 0.10 0.35 0.17
Packaging and shipping quality (c12) 5.38 4.91 5.92
Ease of communication (c13) 3.95 3.21 4.62
Reliability (c14) 4.79 3.64 4.80
Problem solving performance (c15) 4.54 4.33 5.43
Warranty policy and after sales service (c16) 4.52 4.35 5.45
Disaster recovery plans (c17) 4.44 4.36 5.35
Highest risk
Based on the experience of implementing a DM-driven SCRM framework in the selected company, the following observations were made.
Implementation of a DM-based SCRM framework is not a one-time process and requires a continous monitoring for the changes in risk factors and associated results.
Translation of the risk management problem into a DM problem is one of the most crucial steps of the developed framework. The risk management team should give significant emphasis to how to use the results of the identified DM method.
It is not possible to analyze all of the risk types in one go. Therefore, each DM problem should focus on a specific risk category or business process and should be regarded as a new project.
Development of a RDW may require high costs and workforce for companies; hence, organizations should perform a feasibility study before data warehousing. Instead of building a RDW, small-sized organizations may prefer to develop a risk data mart directly from the company’s current databases. Data marts are subsets of data warehouses and require lower costs. However, the data preprocessing and transformation part will require higher effort.
If the proposed framework will be used on a daily basis to analyze and monitor risks, it should be integrated with the existing information system and data warehouse of the organization for receiving real-time information. An expert system or a decision tree model may be integrated to automate the selection and application of the DM analysis.
Selection of the DM application requires knowledge about the company, expertise on risks, and an expertise on DM tools and algorithms. Hence, the success of this part depends on the expertise and experience of the risk analysis and management team.
Several limitations were also identified while implementing the proposed DM-based SCRM framework. The input of the DM algorithms are the databases. Hence, there are two important issues that have a significant effect on the accuracy of the results of the DM module: i) the database should provide complete, accurate, clear, related, and up-to-date data, ii) the right metrics should be determined to measure and track-identified risk factors. Furthermore, adaption of the DM-based SCRM model depends on the current technology level within the organization. It may require additional investments for technological infrastructure and workforce to implement the model.
6. Conclusion
The volume of data generated and transmitted across SC networks is on rise with developments in communication and information technologies, increasing collaboration between stakeholders and digital transformation of supply chains with the adaptation of Industry 4.0 technologies (such as RFID, Internet of Things and cyber physical systems). These technological enhancements and business innovations are driving SC managers in making data-driven decisions. Despite growing interest in the industry, academia has been lagging in using data-driven approaches to manage SC risks. The study contributes to the literature by developing a comprehensive DM-based framework for SCRM. Key activities involved in risk management and DM are combined for developing a road map to achieve effective and intelligent risk management systems for today’s digital supply chains. Besides developing a SCRM platform for companies, the proposed framework provides a comprehensive guide to systematically collect, analyze, monitor and manage SC risk data from multiple information sources. The study showcases how DM supports in discovering hidden and useful information from unstructured risk data for making intelligent risk management decisions. Data mining driven SCRM framework is unique and has not been addressed in the past. By integrating different process modules, the study provided a holistic approach, which is practical and easy to implement, demonstrated using a case study example. This integrated and structured data driven procedure is partially implemented and tested in a global company. Practical implementation issues and suggestions are provided through the observations and findings of the case study. The model was tested using a single case company and thus, the applicability, learnings and limitations of the framework are difficult to generalize. However, the proposed DM-based risk management model is expected to make organizations smarter by providing a better understanding of the SC risks, their critical effects and interdependencies between them. Proactive and reactive mitigation strategies can be developed based on the assessment of risk data. The study reflects on the potential of DM tools and techniques to increase visibility and responsiveness of SCs. Following this study, it is evident that DM provides interactive and distributed knowledge discovery applications and has huge potential specifically in SCRM and SCM in general. This study is expected to set an initial basis for further research and developments in the data-driven frameworks for supply chain risk management.
The application part of the framework was limited due to the requirement for technological and workforce investments to implement and test the developed framework. Future research can
explore some of the limitations captured in this study. Additionally, there was lack of comparative multiple DM applications to validate the framework. Future research can focus on implementing the data mining-based SCRM framework in multiple organizations for drawing universal insights. References
Addo-Tenkorang, R., & Helo, P. T. (2016). Big data applications in operations/supply-chain management: A literature review. Computers & Industrial Engineering, 101, 528–543.
Aggarwal, C.C. (2015). Data Mining: The Textbook. New York: Springer.
Anderson-Lehman, R., Watson, H.J., Wixom, B.H., & Hoffer, J.A. (2004). Continental Airlines Flies High with Real-Time Business Intelligence. MIS Quarterly Executive, 3(4), University of Minnesota, 163– 176.
Apgar, D. (2006). Risk Intelligence: Learning to Manage What We Don't Know. Boston: Harvard Business School Press.
Aqlan, F. (2016). A software application for rapid risk assessment in integrated supply chains. Expert Systems with Applications, 43, 109–116.
Aqlan, F., & Lam, S.S. (2016). Supply chain optimization under risk and uncertainty: A case study for high-end server manufacturing. Computers & Industrial Engineering, 93, 78–87.
Aruldoss, M., Travis, M. L., & Venkatesan, V. P. (2015). A reference model for business intelligence to predict bankruptcy. Journal of Enterprise Information Management, 28(2), 186-217.
Bandaly, D., Satir, A., & Shanker, L. (2016). Impact of lead time variability in supply chain risk management. International Journal of Production Economics, 180, 88-100.
Basole, R.C., & Bellamy, M.A. (2014). Visual analysis of supply network risks: Insights from the electronics industry. Decision Support Systems, 67, 109-120.
Blackhurst, J., Rungtusanatham, M. J., Scheibe, K., & Ambulkar, S. (2018). Supply chain vulnerability assessment: A network-based visualization and clustering analysis approach. Journal of Purchasing and Supply Management, 24(1), 21-30.
Brusset, X., & Teller, C. (2017). Supply chain capabilities, risks, and resilience. International Journal of Production Economics, 184, 59–68.
Carneiro, N., Figueira, G., & Costa, M. (2017). A data mining based system for credit-card fraud detection in e-tail. Decision Support Systems, 95, 91–101.
Chapelle, A. (2013) Unlocking KRIs. RM Professional, Institute of Risk Management, London.
Chen, P.S., & Wu, M.T. (2013). A modified failure mode and effects analysis method for supplier selection problems in the supply chain risk environment: A case study. Computers & Industrial Engineering, 66(4), 634–642.
Coronel, C., & Morris, S. (2017). Database Systems: Design, Implementation, & Management. (12th ed.). Cengage Learning.
De Caigny, A., Coussement, K., & De Bock, K.W. (2018). A new hybrid classification algorithm for customer churn prediction based on logistic regression and decision trees. European Journal of Operational Research, 269, 760–772.
Dutta, I., Dutta, S., & Raahemi, B. (2017). Detecting financial restatements using data mining techniques. Expert Systems With Applications, 90, 374–393.
Er Kara, M., & Oktay Fırat, S. Ü. (2016). Sustainability, Risk, and Business Intelligence in Supply Chains. In M. M. Erdoğdu, T. Arun, & I. H. Ahmad (Eds.), Handbook of Research on Green Economic Development Initiatives and Strategies (pp. 501-538). Hershey, PA: IGI Global.
Er Kara, M. (2017). Data Mining Approach in Supply Chain Risk Management. Ph.D. Thesis, Marmara University, Turkey.
Er Kara, M., & Oktay Fırat, S. Ü. (2017). Supply Chain Risks: Literature Review and a New Categorization. Beykent University Journal of Science and Technology, 10(1), 31-60.
Er Kara, M., Oktay Fırat, S.Ü. (2018). Supplier Risk Assessment Based on Best-Worst Method and K-Means Clustering: A Case Study. Sustainability, 10(4), 1066.
Feelders, A., Daniels, H., & Holsheimer, M. (2000). Methodological and practical aspects of data mining. Information & Management, 37(5), 271-281.
Franzetti, C. (2011). Operational Risk Modelling and Management. Boca Raton: CRC Press, Taylor & Francis Group.
Gargano, M.L., & Raggad, B.G. (1999). Data mining - a powerful information creating tool. OCLC Systems & Services: International digital library perspectives, 15(2), 81-90.
Geng, R., Bose, I., & Chen, X. (2015). Prediction of financial distress: An empirical study of listed Chinese companies using data mining. European Journal of Operational Research, 241(1), 236–247.
Ghadge, A., Dani, S., Chester, M., & Kalawsky, R. (2013). A systems approach for modelling supply chain risks. Supply chain management: an international journal, 18(5), 523-538.
Ghadge, A., Dani, S., Ojha, R., & Caldwell, N. (2017). Using risk sharing contracts for supply chain risk mitigation: A buyer-supplier power and dependence perspective. Computers & Industrial Engineering, 103, 262–270.
Ghadge, A., Dani, S., & Kalawsky, R. (2012). Supply chain risk management: present and future scope. The International Journal of Logistics Management, 23(3), 313-339.
Giannakis, M., & Papadopoulos, T. (2016). Supply chain sustainability: A risk management approach. International Journal of Production Economics, 171(4), 455-470.
Giudici, P., & Figini, S. (2009). Applied Data Mining for Business and Industry. (2nd ed.), Wiley.
Goh, R.S.M., Wang, Z., Yin, X., Fu, X., Ponnambalam, L., Lu, S., & Li, X. (2013). RiskVis: Supply Chain Visualization with Risk Management and Real-time Monitoring. IEEE International Conference on Automation Science and Engineering (CASE), 207-212.
Guertler, B., & Spinler, S. (2015). Supply risk interrelationships and the derivation of key supply risk indicators. Technological Forecasting and Social Change, 92, 224–236
Haksöz, Ç. (2013). Risk Intelligent Supply Chains: How Leading Turkish Companies Thrive in the Age of Fragility. Boca Raton, FL: Taylor and Francis Group/CRC Press.
Han, J., Kamber, M., & Pei, J. (2012). Data Mining: Concepts and Techniques. (3rd ed.). Morgan Kaufmann. Hanafizadeh, P., & Paydar, N.R. (2013). A Data Mining Model for Risk Assessment and Customer Segmentation in the Insurance Industry. International Journal of Strategic Decision Sciences, 4(1), 52-78.
Heaney, B. (2015). Supply Chain Intelligence: Descriptive, Prescriptive, and Predictive Optimization. Research Report, Aberdeen Group.
Heckmann, I., Comes, T., & Nickel, S. (2015). A critical review on supply chain risk – Definition, measure and modeling. Omega, 52, 119-132.
Hoffman, D.G. (2002). Managing Operational Risk: 20 Firmwide Best Practice Strategies. New York: John Wiley & Sons.
IBM (2014). Operational risk management in the world of big data: Unlocking the value of loss event data and driving the risk-aware enterprise. https://www-01.ibm.com/common/ssi/cgi-bin/ssialias?htmlfid=YTW03380USEN, Accessed 1 November 2018.
Jans, M., Lybaert, N., & Vanhoof, K. (2010). Internal fraud risk reduction: Results of a data mining case study. International Journal of Accounting Information Systems, 11(1), 17–41.
Jukic, N., Vrbsky, S., & Nestorov, S. (2017). Database Systems: Introduction to Databases and Data Warehouses. Prospect Press.
Kang, S., Kim, E., Shim, J., Cho, S., Chang, W., & Kim, J. (2017). Mining the relationship between production and customer service data for failure analysis of industrial products. Computers & Industrial Engineering, 106, 137–146.
Kayis, B., & Karningsih, P.D. (2012). A knowledge-based system tool for assisting manufacturing organizations in identifying supply chain risks. Journal of Manufacturing Technology, 23 (7), 834-852. Keramati, A., Jafari-Marandi, R., Aliannejadi, M., Ahmadian, I., Mozaffari, M., & Abbasi, U. (2014). Improved churn prediction in telecommunication industry using data mining techniques. Applied Soft Computing, 24, 994–1012.
Kim, K., Kim, H., Kim, S.K., & Jung, J.Y. (2016). i-RM: An intelligent risk management framework for context-aware ubiquitous cold chain logistics. Expert Systems with Applications, 46, 463–473.
Knemeyer, A.M., Zinn, W., & Eroglu, C. (2009). Proactive planning for catastrophic events in supply chains. Journal of Operations Management, 27 (2), 141-153.
Köksal, G., Batmaz, İ., & Testik, M.C. (2011). A review of data mining applications for quality improvement in manufacturing industry. Expert Systems with Applications, 38(10), 13448–13467. Larose, D.T., & Larose, C.D. (2015). Data Mining and Predictive Analytics. (2nd ed.). New Jersey: John
Wiley & Sons.
Le, H.Q., Arch-int, S., Nguyen, H.X., & Arch-int, N. (2013). Association rule hiding in risk management for retail supply chain collaboration. Computers in Industry, 64(7), 776-784.
Lee, B. K., Zhou, R., Souza, R., & Park, J. (2016). Data-driven risk measurement of firm-to-firm relationships in a supply chain. Int. J. Production Economics, 180, 148–157.
Lee, C.K.H., Choy, K.L., Ho, G.T.S., Chin, K.S., Law, K.M.Y., & Tse, Y.K. (2013). A hybrid OLAP-association rule mining based quality management system for extracting defect patterns in the garment industry. Expert Systems with Applications, 40(7), 2435–2446.
Lee, E.B., Kim, J., & Lee, S.G. (2017). Predicting customer churn in mobile industry using data mining technology. Industrial Management & Data Systems, 117(1), 90-109.
Lee, G., & Kulkarni, U. (2011). Business Intelligence in Corporate Risk Management. AMCIS 2011 Proceedings, Association for Information Systems Electronic Library.
http://aisel.aisnet.org/cgi/viewcontent.cgi?article=1406&context=amcis2011_submissions, Accessed 1 November 2018.
Linoff, G.S., & Berry, M.J.A. (2011) Data Mining Techniques: For Marketing, Sales, and Customer Relationship Management. (3rd ed.). Wiley.
Liu, L., Daniels, H., & Hofman, W. (2014). Business Intelligence for Improving Supply Chain Risk Management. In S. Hammoudi, J. Cordeiro, L.A., Maciaszek, & J. Filipe (Eds.), Enterprise Information Systems, 15th International Conference, Revised Selected Papers, LNBIP 190, Springer, 190-205. Long, Q. (2018). Data-driven decision making for supply chain networks with agent-based computational
experiment. Knowledge-Based Systems, 141, 55-66.
Management Solutions (2014) Operational risk management in the energy industry. Management Solutions.
https://www.managementsolutions.com/sites/default/files/publicaciones/eng/Operational-Risk-Energy.pdf, Accessed 1 November 2018.
Murray, P. W., Agard, B., & Barajas, M. A. (2017). Market segmentation through data mining: A method to extract behaviors from a noisy data set. Computers & Industrial Engineering, 109, 233–252.
Myatt, G.J., & Johnson, W.P. (2014). Making Sense of Data I: A Practical Guide to Exploratory Data Analysis and Data Mining. (2nd ed.). New Jersey: John Wiley & Sons.
Neef, D. (2005). Managing corporate risk through better knowledge management. The Learning Organization, 12(2), 112-124.
Ngai, E.W.T., Hu, Y., Wong, Y.H., Chen, Y., & Sun, X. (2011). The application of data mining techniques in financial fraud detection: A classification framework and an academic review of literature. Decision Support Systems, 50(3), 559–569.
Norrman, A., & Jansson, U. (2004). Ericsson’s proactive supply chain risk management approach after a serious sub-supplier accident. International Journal of Physical Distribution & Logistics Management, 34(5), 434-456.
Ojha, R., Ghadge, A., Tiwari, M. K., & Bititci, U. S. (2018). Bayesian network modelling for supply chain risk propagation. International Journal of Production Research, 1-25, Online.
Olson, D.L., Delen, D., & Meng, Y. (2012). Comparative analysis of data mining methods for bankruptcy prediction. Decision Support Systems, 52(2), 464–473.
Ponemon Institute (2017). The Imperative to Raise Enterprise Risk Intelligence: Inside the Promise & Pitfalls of Enterprise Risk Management. https://www.resolver.com/resource/ponemon-survey-report-the-imperative-to-raise-enterprise-risk-intelligence/, Accessed 1 November 2018.
Rainardi, V. (2008). Building a Data Warehouse: With Examples in SQL Server. Apress.
Rajagopal, V., Venkatesan, S.P., & Goh, M. (2017). Decision-making models for supply chain risk mitigation: A review. Computers & Industrial Engineering, 113, 646-682.
Ranjan, J., & Bhatnagar, V. (2011). Role of knowledge management and analytical CRM in business: data mining based framework. The Learning Organization, 18(2), 131-148.
Refaat, M. (2007). Data Preparation for Data Mining Using SAS. Morgan Kaufmann Publishers.
Rezaei, J. (2016). Best-worst multi-criteria decision making method: Some properties and a linear mode. Omega, 64, 126-130.
Robertson, D. (2016). Managing Operational Risk: Practical Strategies to Identify and Mitigate Operational Risk within Financial Institutions. Palgrave Macmillan.