Ursula Mattioli Mello
A dissertation submitted in partial fulfillment of the requirements for the
degree of Doctor of Philosophy in
Economics
Universidad Carlos III de Madrid
Advisors:
Jan Stuhler and Ricardo Mora
Aos meus pais e à Ingrid, por todo amor que existe nesse mundo. Ao Tomás, por caminhar ao meu lado e por construir sonhos comigo.
Aos meus futuros filhos, que, mesmo do mundo mental, já movem forças inigualáveis dentro de mim.
“... to reach this stage (of great achievements), he must create many inner defenses, become valiant in the face of all adverse circumstances, and come to know that struggle is the law of life, which must be confronted not once but a thousand times, and not with vacillation but by being fully conscious of what is inescapable.” From the Logosophical Bibliography
These past six years were, definitely, the most challenging and enriching of my life so far. The journey towards a PhD thesis led me to great achievements, but also presented many struggles. Interestingly, most of these battles happened inside of me. During this time, while learning to be a research economist, I had to face fears, develop inner defenses and work even harder to build key virtues for academic and life success: patience, bravery, humility, self-confidence, kindness towards myself and others. Today, I am very happy to have produced a thesis about topics I care about. Yet, there are no words to describe how joyful I feel to realize how much I have grown and changed. Of course, there is no way I could have gotten this far without the help of many.
I am extremely grateful to my supervisors, Jan Stuhler and Ricardo Mora. Thank you for an impeccable guidance that went far beyond improving my research output. Thank you for believing in me and in my work more than I did myself. Thank you for all the time devoted to me. Thank you for giving me the perfect balance between the freedom I needed to discover my own path inside academia and the incentives that helped me expand my limits and persist. You were true examples of how academic excellence can meet an extremely generous and kind heart. I hope that, one day, I get to be half the mentor you were to me.
I am also grateful to the faculty, my fellow PhD friends and the administrative personnel at UC3M. You have created a warm and helpful environment, in which I could grow and learn daily. I am especially thankful to Matilde Machado and Nazarii Saalish, who generously took their time to review my dissertation chapters and give me great advice on how to improve my work. Moreover, I am grateful to the UC3M Applied Faculty and PhD students, whose comments, generosity and example helped build my skills and motivate my work. Thank you for being such great peers and role models. I would also like to say a special thank you to Pedro, Bea, Ana and Conchi, who kindly took care of me during the first two very
insightful conversations that have inspired many of my research questions. To my forever-friends, thank you for always receiving me with your whole heart after so many months apart. To my friends from the Logosophical Foundation, thank you for being my family in Spain, for filling my life with joy and for helping me find purpose within myself.
Finally, I dedicate this thesis to my loving family, especially, to my parents, Carlos and Sandra, to my sister, Ingrid, and to my love, Tomás. Tomás, thank you for being my best friend, my favorite economist and my life partner through all these six years. Your loyalty, your grit, your insightfulness and your strength do not seize to surprise and inspire me. Thank you for walking by my side every day. Daddy, mommy e sis, thank you for always loving, supporting and trusting me. Thank you for being so close, no matter how far. Thank you for your example of happiness, courage, determination and goodness of heart. Your love makes me brave and my home will always be wherever you are. Muito obrigada por tudo. Vocês são o melhor de mim. Eu amo muito vocês e espero, um dia, ser para meus filhos tudo o que vocês são para mim.
This thesis has been possible thanks to the financial support of the Spanish Ministry of Education and Culture, grant number FPU14/07116.
In this dissertation, I study different dimensions of socioeconomic inequality. My objective is to produce empirical evidence to help governments design better policies in the fields of education and the labor market. The two first chapters are focused on educational inequality and the effect of policies that aim to tacke this issue, while the third chapter aims to present useful solutions to an important conceptual issue for measuring intergenerational mobility.
In the first chapter, ‘Affirmative Action, Centralized Admissions and Inequality in Access
to Higher Education: Evidence from Brazil’, I analyze how two major reforms, introduced
to democratize access to public higher education in Brazil, impacted enrollments of students from a low-socioeconomic status. The first policy centralized applications in a nationwide platform and the second expanded affirmative action quotas to a uniform share of fifty percent of all vacancies offered by each major and institution. Their progressive adoption generates cross-sectional and time variation, allowing the separate identification of their causal effects. Results show that the affirmative action reform increases enrollments of public school, black and low-income students, while the centralized admission system acts in the opposite direc-tion, decreasing their participation. Moreover, the interaction between both policies has a positive and significant effect on enrollments of the vulnerable groups. I then shed light on some mechanisms behind these results. I find that centralization disproportionately increases enrollments of high-SES out-of-state students in the least prestigious degrees, crowding-out low-SES students with mobility constraints. On the other hand, the expansion of affirmative action does not only mechanically improve equity, but also changes application behavior.
In the second chapter, ‘Does Affirmative Action in Undergraduate Education Impact High
Schools?’, I delve into the analysis of unintended consequences of affirmative action initiatives
in higher education, which have been implemented in different countries to improve access of vulnerable groups and to reduce inequality in educational attainment. A growing empirical literature has investigated how such policies impact college students’ outcomes and pre-college human capital accumulation. Yet, little is known about how they affect students’ choice of high school and, consequently, school quality and peer interaction. I study this question in the context of Brazil, one of the most unequal countries in the world, and where the government
a public school. I show that the adoption of QL increases strategic mobility from private to public schools by 29 percent and that the movers come disproportionately from low-SES and low-quality private schools. Nevertheless, this exogenous influx of private school students increases public school quality, while it also raises inequality within the public school system. Finally, in the third chapter, ‘Correction Methods for Intergenerational Mobility
Esti-mates’, co-authored with Martin Nybom and Jan Stuhler, we study another dimension of
socioeconomic inequality: the transmission of economic status between generations. The estimation of standard measures of intergenerational mobility ideally requires the complete income history for two generations to determine their lifetime incomes. However, empirical applications are typically based on snapshots of income over a limited number of observa-tions in the life cycle. If those snapshots do not mimic lifetime outcomes, the estimates are subject to attenuation and lifecycle bias. The literature has followed two different strategies to address this problem. The first models the income processes itself, the second the relation between annual and lifetime incomes over the life cycle. In this paper, we use uniquely long income series from Sweden to study how well these methods approximate the intergenera-tional elasticity of income. All methods are biased to some degree, because neither accounts for three key components of the income process: (i) income growth explained by observ-able characteristics, (ii) transitory noise, and (iii) unexplained income growth that correlates within families. We propose a lifecycle estimator that addresses all three components, and which can improve estimates of the intergenerational elasticity in a wide range of settings.
1 Affirmative Action, Centralized Admissions and Inequality in Access to
Higher Education: Evidence from Brazil 1
1.1 Introduction . . . 1
1.2 Motivation . . . 7
1.2.1 Brazilian Higher Education System . . . 7
1.2.2 Centralization of Admissions . . . 8
1.2.3 Affirmative Action . . . 10
1.3 Data . . . 11
1.4 Empirical Methodology . . . 14
1.5 Main Results . . . 15
1.5.1 Enrollments of Low-SES students . . . 15
1.5.2 Heterogeneity of Results . . . 16
1.6 Potential Mechanisms . . . 17
1.6.1 Why centralizing admissions crowds out low-SES students from the public higher education? . . . 18
1.6.2 Is the effect of AA on enrollments purely mechanical or is there evidence of any effect on students’ behavior? . . . 20
1.6.3 Why does the interaction between SISU and AA creates an additional enrollment-effect for vulnerable groups? . . . 21
1.7 Robustness of Results and Extensions . . . 22
1.7.1 Spillovers . . . 22
1.7.2 Dynamics . . . 24
1.7.3 Sample Selection . . . 25
1.7.4 Additional Specifications . . . 26
1.8 Concluding Remarks . . . 27
1.9 Figures and Tables . . . 30
2 Does Affirmative Action in Undergraduate Education Impact High Schools? 53
2.1 Introduction . . . 53
2.2 Institutional Background . . . 57
2.2.1 Brazilian Educational System . . . 57
2.2.2 The Quota Law in Higher Education . . . 58
2.3 Data and Variables . . . 59
2.4 Strategic High School Choice . . . 62
2.4.1 Empirical Strategy . . . 62
2.4.2 Results . . . 63
2.5 Effect on the High School System . . . 65
2.6 Concluding Remarks . . . 67
2.7 Figures and Tables . . . 69
3 Correction Methods for Intergenerational Mobility Estimates 86 3.1 Introduction . . . 86
3.2 Data . . . 91
3.3 The Income Process: Swedish and Simulated Data . . . 92
3.4 Correction Methods in the Intergenerational Literature . . . 96
3.4.1 Modelling Errors-in-Variables . . . 96
3.4.2 Modelling the Income Process . . . 100
3.5 New Correction Methods . . . 108
3.5.1 The Lifecycle Estimator . . . 108
3.5.2 The Standardized Errors-in-Variables Model . . . 114
3.6 Concluding Remarks . . . 117
1.1 Expansion of SISU in Brazilian Undergraduate Education . . . 32
1.2 Expansion of Affirmative Action in Brazilian Undergraduate Institutions . . 33
1.3 Descriptive Statistics of Incoming Students in Public Higher Education Insti-tutions . . . 34
1.4 Placebo Experiment with Lead Variables . . . 35
1.5 Effect of SISU and AA on Enrollments of Low-SES Students . . . 35
1.6 Effect of AA and SISU on Enrollments by Quartile of Baseline Share of Public-School Enrollment in Baseline . . . 36
1.7 Effect on the Number of Applications and Enrollments of Out-of-State Students 37 1.8 Effect of AA and SISU on Average Grades of Incoming Students . . . 37
1.9 Heterogeneity of Effect by Quartile of Competitiveness of Degree . . . 38
1.10 Heterogeneity of Effect on Enrollment of Out-of-State Students by Quartile of Competitiveness of Degree and by Type of High School . . . 39
1.11 Heterogeneity of Effect on Grades by Quartile of Competitiveness of Degree . 40 1.12 Spillover of Treatment Effects on Public Higher Education Market . . . 41
1.13 Yearly Effects . . . 42
1.14 Treatment status and Sample selection . . . 43
B.1 Treatment and Control Units . . . 45
B.2 Robustness of Placebo Experiment . . . 46
B.3 Robustness of Spillover Measures . . . 47
B.4 Robustness - Different Samples of Institutions . . . 48
B.5 Robustness - Different Sample Selections . . . 49
B.6 Robustness - Results Collapsed at Program Level . . . 50
B.7 Robustness - Collapsed at Program Level and Different Local Controls . . . 51
B.8 Robustness - SISU Treatment Collapsed at Institutional Level . . . 52
2.1 Descriptive Statistics . . . 76
2.3 Moves from Private to Public School . . . 78
2.4 Moves from Public to Private School . . . 79
2.5 Moves from Private to Public School - Non-white Students . . . 80
2.6 Moves from Private to Public School - White and Asian Students . . . 81
2.7 Moves from Private to Public School - By School Socioeconomic Level . . . . 82
2.8 Moves from Private to Public School - By School Quality . . . 83
2.9 Distribution of ShareP rivpm,2010 . . . 84
2.10 Effect on ShareP rivpmy . . . 84
2.11 Effect on School Quality . . . 85
3.1 Descriptive Statistics of Main Sample . . . 92
3.2 Lifecycle Bias and the Generalized-Errors-in-Variables Model . . . 98
3.3 Lifecycle Estimators in the Swedish Data . . . 103
3.4 The Revised Lifecycle Estimator . . . 113
3.5 The Lifecycle Estimator with Few Income Observations . . . 114
A.1 Intergenerational Elasticity Literature . . . 120
1.1 Evolution of Number of ENEM Test Takers . . . 30
1.2 Example of application of the AA law in the state of Bahia. . . 30
1.3 Placebo Tests including 2 pre-periods . . . 31
1.4 Heterogeneity of Effect by Baseline Share of PS Enrollment . . . 32
B.1 Heterogeneity of AA Treatment by Baseline Share . . . 44
2.1 Private vs Public Schools . . . 69
2.2 Example of the Quota Law for the State of Bahia . . . 70
2.3 Distribution of Treatment Variable . . . 71
2.4 Estimate of Treatment Effects between School Systems . . . 72
2.5 Estimate of Movements from Private to Public Schools by Ethnicity . . . 73
2.6 Estimate of Movements from Private to Public Schools by School of Origin Socioeconomic Status . . . 74
2.7 Estimate of Movements from Private to Public Schools by School of Origin Quality Index . . . 75
3.1 Components of the Income Process . . . 94
3.2 Trends in Lambdas and IGE Estimates . . . 99
3.3 Illustration of Potential Problems with Fixed Effect Estimators . . . 104
3.4 Estimation of Trends in the IGE . . . 105
3.5 Extrapolating from Observable Profiles . . . 107
3.6 A standardized errors-in-variables model in Swedish Data . . . 116
A.1 Components of the Income Process . . . 119
Affirmative Action, Centralized
Admissions and Inequality in Access to
Higher Education: Evidence from Brazil
1.1
Introduction
Inequality in access to higher education is a growing concern in both developed and developing economies. In the U.S.,Haveman and Wilson(2007) find a gap of almost 50 percentage points in college attendance between students in the top and bottom quartile of family income. In Brazil, according to the population Census of 2010, the share of college enrollment for individuals aged 18 to 22 is equal to 3.7 percent in the lowest quartile and 34.2 percent in the top quartile of family per capita income. Higher education is an important indicator of future labor market outcomes.1 Therefore, the barriers to college attendance faced by disadvantaged students contribute to the perpetuation of income inequality and to lower social mobility.2
In this context, a wide range of policies have been implemented to improve access of vul-nerable groups to higher education in different countries. Examples of such policies include: the expansion of financial aid, the reduction of tuition costs, the enlargement of the public and technical postsecondary systems, the practice of affirmative action in elite colleges and the reduction of application costs. Following the spread of these interventions, a recent
grow-1Although highly heterogeneous, the literature has found consistent average positive returns to higher
education (e.g. Rodriguez et al. 2016; Zimmerman 2014).
2According to Haveman and Wilson (2007), the increase in U.S. income inequality over the past three
decades has increased inequality in educational attainment between those with high and low incomes. This creates a vicious circle which perpetuates inequality. In this line, Chetty et al. (2017) explore the role of colleges in the transmission of inequality across generations in the U.S. They find that the fraction of students from low-income families fell sharply at colleges with the highest rates of bottom-to-top-quintile mobility between 2000-2011.
ing body of the economic literature has investigate how such initiatives affect the structure of higher education systems in terms of equality and diversity of the student body.
In this paper, I add to the literature by analyzing how two large governmental inter-ventions affected enrollments of disadvantaged individuals in elite public higher education institutions in a particularly interesting institutional context. On the one hand, Brazil is one of the most unequal countries in the world; returns to higher education are relatively high,3
while access is extremely unequal, especially for the elite colleges. On the other hand, most of these top institutions are public. Moreover, governmental expenditure in higher educa-tion is substantial compared to the primary and secondary levels, reinforcing the cycle of inequality.4
To reduce this problem, the government of Brazil recently adopted a set of policies that aimed to expand enrollments of disadvantaged groups to public colleges. The most important ones were the implementation of a centralized admission system in 2010 - the Sistema de
Seleção Unificada (SISU) - and of a national Affirmative Action Policy (AA) in 2013. The
SISU centralized applications in a nationwide online platform available for undergraduate degrees of federal and state institutions, based exclusively on grades of a national standardized exam. By reducing application costs, SISU created a more efficient market (Machado and Szerman, 2018). Yet, little is known about how it affected equality in access to public higher education. The AA, in contrast, determined that fifty percent of all vacancies in undergraduate degrees at federal institutions have to be reserved to students that attended public schools during all 3 years of secondary education,5with a certain percentage destined to race and economic-based minorities. By prioritizing equality, AA does not only mechanically increase enrollments of students of low socioeconomic status (hereafter low-SES), but also impacts incentives differently for each demographic group. In spite the large magnitude of these reforms, to the best of my knowledge, no academic papers tried to uncover their distributional effects. I try to fill this gap by investigating: (i) how SISU and AA changed the demographic composition of elite higher education institutions; (ii) if and how the two policies interact; (iii) the mechanisms behind the results.
My identification strategy relies on the progressive adoption of both policies, which
gen-3Brazil is the11thmost unequal country according to its Gini Index (World Development Indicators, 2019).
Earnings of workers with a tertiary degree are 2.5 times higher than the ones of workers with upper-secondary education. The OECD average is 1.56 (OECD,2017).
4Brazil spends 3.8 thousand USD annually per student in primary education, while the OECD average is
8.7. In contrast, Brazil spends 11.7 thousand USD per student in tertiary education, similarly to European countries such as Italy (11.5) and Spain (11.8). The OECD average is 16.1, due to countries with substantially higher average spending, such as the US (29.3) and the UK (24.5) (OECD, 2017).
5According to data from ENEM 2016 (a National Standardized Exam), among the top 10 percent of
high-schools in Brazil, 88% are private. Since attending a better (private) school is correlated with a higher socioeconomic status, the AA policy targets public school students as a proxy for low-economic status.
erates cross-sectional and time variation. Under a common trend assumption, this allows for the identification of their causal effect. The main specification includes time and degree-university fixed effects, in addition to a degree-level control for the number of vacancies and a municipality trend. The main identifying assumption for causal interpretation of the es-timates is that trends in the outcome variable for treated and control units are parallel in absence of treatment. However, the existence of time-varying unobservable characteristics that are correlated with the outcome could be a potential threat for identification. In order to provide suggestive evidence that trends between controls and treated units are parallel, I conduct a series of placebo experiments, including both one and two lead variables, and find that coefficients for trends in pre-periods are close to zero and insignificant.
Results show that the full adoption of AA – from zero to fifty percent of reserved vacan-cies – increases enrollments of public school students (PS), non-white public school students (PSNW) and low income public school students (PSLI) by, respectively, 9.9, 7.0 and 2.4 per-centage points, an increase of 18, 29 and 34 percent for the average program. These average effects mask remarkable heterogeneity. The full adoption of AA increases participation of PS by up to 28 p.p. and of PSNW by 15 p.p. for degrees in the lowest decile of PS participation share in the baseline year. Full adoption of SISU acts in the opposite direction, decreasing enrollments of these groups by 3.8, 2.8 and 4.1 percentage points, representing a negative effect of 7, 12 and 59 percent for the average program. Finally, the interaction between both policies creates an additional effect that increases enrollments of all vulnerable groups.
I present, then, suggestive evidence to shed light on the mechanisms behind these results. The full adoption of SISU substantially increases the average number of applications, enroll-ments of out-of-state students and average grades of enrollees. This suggests that centraliza-tion creates a more efficient market, as shown by Machado and Szerman (2018). Although the centralized system increases competition across all degrees, I find that it displaces low-SES students in the least competitive programs only. I then show that this pattern can be explained by the heterogeneous effects of SISU on the composition of out-of-state students in different degrees. In the least competitive programs, SISU disproportionately increases enrollments of high-SES out-of-state students, displacing the low-SES ones. Instead, in the most competitive programs, SISU disproportionately increases enrollments of low-SES out-of-state students, leading to no crowding-out effect. This suggests that mobility constraints are an obstacle for low-SES students accepted in degrees with lower expected future returns, but not to high-SES students or to low-SES students accepted in the most prestigious degrees. The expansion of AA also increases the average number of applications. In addition, it increases enrollments of public school students in programs in which their participation was as high as 67 percent in baseline. This suggests that the positive effects of AA on enrollments of
low-SES individuals are probably not only driven by the mechanical change in the admission rule, but also by a change in application behavior.
Finally, I discuss two potential channels behind the positive effects observed in the inter-action of the two policies: one driven by the availability of additional information and another by the extra protection in face of higher competition. The effect of AA is higher when SISU is large. The full adoption of a centralized system induces all interested applicants to join the SISU platform. Once in the system, the low-SES students benefit from the information channel. By providing low-SES students with additional information regarding their own grades and cutoff scores, the platform enables them to better target their applications, lead-ing to more enrollments. In parallel, the effect of SISU is larger when AA is fully adopted. This creates an additional protection channel that prevents the crowding-out effect. Thus, the joint adoption of the policies leads to more enrollments of low-SES students, displacing both local and out-of-state high-SES students.
My paper broadly contributes to the empirical literature that studies the impact of in-terventions that aim to democratize access to higher education. To cite a few examples, this literature has studied the effect of expanding financial aid and reducing tuition costs (e.g. Solis 2017; Rojas et al. 2013; Deming and Dynarski 2010), the enlargement of access to community colleges or technical postsecondary education (e.g. Goldhaber and Peri 2007;
Denning 2017) and the effect of initiatives that aim to change low-SES students’ aspirations and perceived value of attending college (e.g. Kaufmann 2014; Oreopoulos and Dunn 2013;
Jensen 2010). Specifically, my paper adds to the strands within this literature that investi-gate the impact of affirmative action policies in undergraduate education and the effect of reducing application costs on enrollments of low-SES students.
Most of the studies related to affirmative action in higher education focus on the US experience and investigate how the practice of a racial preference has impacted minorities’ overall enrollment, graduation attainment, major choice and labor market outcomes.6 More
closely related to my paper are the contributions of Hinrichs (2012) andBackes (2012), who study how affirmative action affects college enrollments and the demographic composition of universities. The lasting effects of such policies on long-term labor market outcomes begin by their differential effects on enrollments. Therefore, understanding the short-term impact of affirmative action on matriculation of minority groups (and displacement of the majority), and consequently on the composition of students at undergraduate degrees, is an essential step to learning the extent of its effect. Both Hinrichs (2012) andBackes (2012) explore the variation across time and state on U.S. colleges and find that the ban of affirmative action has
6Arcidiacono and Lovenheim (2016) and Arcidiacono et al.(2015) offer a comprehensive updated review
no impact for the typical student and the typical college, but decreases under-representative minority enrollment at selective colleges. Although much can be learned from the evidence of affirmative action in the U.S., the structure of such policies in the Brazilian undergraduate higher education is more similar to the one in India, where institutions have precise quotas and admissions depend solely on grades.7 Bertrand et al.(2010) andBagde et al.(2016) study
the effect of caste-based quotas in higher education in engineering colleges in India, and find that affirmative action substantially increases the probability of admission and attendance of disadvantaged casters.
Previous evidence on affirmative action in Brazil focused on the localized adoption of policies by specific institutions. Francis and Tannuri-Pianto (2012) find that the racial quo-tas introduced by the University of Brasilia increased the proportion of black students and of students from a lower socioeconomic background. Francis and Tannuri-Pianto (2018) con-clude, then, that this policy increased the average years of education, college completion and labor earnings of the targeted group. Estevan et al. (2019) show that racial preferences in admissions at the University of Campinas leads toward a shift of admission to students of families of lower socioeconomic status. These papers find little evidence of behavioral effects on pre-college human capital accumulation.
I expand on this literature in different dimensions. First, I study the impact of affirmative action on the demographic compositions of universities in an institutional context that is remarkably different from both the United States and India.8 Second, I analyze the effect of an affirmative action reform that was both nationwide, as it affected all federal universities of Brazil (17 percent of all undergraduate enrollment) and highly advertised and debated by the public, which differs from most of the experiences in the U.S., India or Brazil, in which affirmative action policies were analyzed in localized (mostly state-level) contexts.
7In the U.S., multiple factors play a role in college admissions, AA is expressed in form of a "racial
preference" that is not precisely quantifiable and depends on specific college policies. In Brazil and India, institutions have precise quotas and admissions depend solely on grades. However, the demographic structure of the Brazilian population is more comparable to the US. Both countries have a diverse mixed-race population composed by descendants of Indigenous, Africans and European immigrants. Also, both the U.S. and Brazil endured a long period of slavery, which is historically one of the main sources of the current racial and social inequality in both countries.
8Brazil and India are among the most unequal countries in the world nowadays. According to Assouad
et al. (2018), in both countries, the top 10% income share is greater than 50% of total pre-tax national income, compared to around 45% in the United States, and less than 40% in Western Europe. Also, while the middle 40% income share comprises 40% of income in the US, this share falls to 30% in Brazil and India. The sources and dynamics of inequality are, however, very different in both countries. In Brazil, the legacy of racial inequality from the almost 400 years of slavery is still very persistent. In India, inequality has its roots in the caste system. Moreover, while inequality in Brazil has been at stable high levels in the past 15 years, in India, it has persistently grown since 1980. Furthermore, AA in higher education is a relatively new policy in Brazil (starting in the early 2000s and expanding nationally in 2013). In India, the Constitution of 1950 already mandates affirmative action for lower-castes (Bagde et al.,2016).
The literature that studies the impact of application costs on students’ decisions to apply and enroll in higher education has shown that more informed students attend higher quality colleges and that financial constraints and information are important drivers of mismatch (e.g. Dillon and Smith 2017; Hoxby and Turner 2015). Although application costs affect decisions of all students, the low-income individuals are usually the ones who benefit more from policies that reduce these costs. Bettinger et al.(2012) find that low-income individuals who receive assistance to complete the application for federal aid increase their likelihood of college assistance and persistence. Similarly, Carrell and Sacerdote (2017) show that providing high-school students at the margin of failing to apply with a college mentoring ap-plication program and apap-plication waivers increases their matriculation in higher education, especially for students at disadvantaged schools. Hoxby and Turner (2015) find that provid-ing low-income high ability students with semi-customized information on applications and application waivers leads to more applications and admissions, especially to better-quality colleges. Bulman (2015) presents evidence that variation in access to SAT testing centers or mandatory in-school administration policies improves college-going, especially for high-ability students at the margin of attendance. Finally,Pallais (2015) shows that even a small reduction in monetary costs is capable of widening students’ applications, leading the low-income ones to attend more selective colleges. In sum, this set of studies finds that relatively small and cheap interventions that reduce application costs can impact important decisions of low-income students and increase their investments in higher education.
I add to this literature by investigating how a much larger change in application costs im-pacts low-SES students’ enrollments. In my context, the introduction of SISU represents an expressive reduction in applications costs in several dimensions: financial constraints, effort provision and information. The previous literature, instead, has focused on smaller-scale in-terventions: application assistance, financial waivers or provision of information to low-SES students. Thus, it is not clear whether the reduction of applications costs caused by the implementation of a centralized assignment should have similar effects as the policies previ-ously studied. One key difference is that the introduction of a centralized system represents a large decline in costs for all students, not only the low-SES group. Thus, understanding its heterogeneous impacts on students’ behavioral responses is essential for uncovering its distributional effects.
These are very relevant questions, both for the economic literature and for policy mak-ers. Centralized assignments are largely adopted in different countries and educational levels. Plenty is known, especially theoretically, about its effects on improving allocation and co-ordination in different contexts. The empirical evidence, though, is still scarce, especially in the field of education. The paper by Machado and Szerman (2018), which explores the
gradual implementation of SISU, is the first to provide empirical evidence on how the in-troduction of a centralized admission system improves allocation in an educational market. They find a positive impact on average grades of admitted students of institutions and pro-grams that adopted the centralized system, interpreting it as an increase in the quality of matching between college and student. They also find that the adoption of SISU increases migration to attend higher education and drop-out rates after a year of enrollment. Yet, they do not explore the heterogeneous and distributional impacts of the introduction of centralized assignments and my paper fills this gap.
Additionally, the unique institutional context analyzed in my paper creates an opportu-nity to test whether the adoption of centralized admissions and of affirmative action quotas simultaneously creates interactions that change the effects that each would have had alone. This provides new evidence for both above-mentioned strands of the literature. Finally, I add to the literature in educational policy in Brazil and other middle-income countries, by quantifying how these interventions contributed to the changes observed in the student body in the recent period.
The remainder of this paper is divided as following. In section 2, I present an overview of the Brazilian higher education system and the institutional context of the reforms. In section 3, I describe the data sources and my main sample of analysis. In section 4, I explain the identification strategy and provide evidence in its support. In section 5, I show the main results, while in section 6, I discuss the potential mechanisms behind them. Finally, in section 7, I discuss the main issues regarding the internal validity of my empirical strategy and, in section 8, I present some policy implications of my findings.
1.2
Motivation
1.2.1
Brazilian Higher Education System
According to the Census of Higher Education of 2014, the Brazilian Higher Education System is comprised of 2368 institutions, 298 public and 2070 private. The public system is a mix of Federal (107), State (118) and Municipal (73) institutions, which correspond, respectively, to 17, 9 and 2 percent of the total undergraduate enrollment of around 6.5 million students.9 Federal and State institutions are, by law, free of any charge, while Municipal schools usually charge some tuition. Private institutions, on the other hand, are a mix of profit (998) and non-profit (1172) organizations and although submitted to federal regulations and education standards, have complete independence regarding tuition fees and administration.
Public institutions (especially Federal) are widely recognized in the country by their average superior quality. For instance, the Federal institutions scored, on average, 3.6 in a scale of 0 to 5 of the Índice Geral de Cursos 2014 (IGC), a quality index elaborated by the Ministry of Education based on performance evaluations of undergraduate and graduate programs. State institutions scored 2.8, and private institutions 2.6. Furthermore, among the universities only, 24 out of the best 25 are public, being 5 of the State administration and the other 19 Federal. On an alternative ranking - Ranking Universitário Folha 2014, elaborated by Folha de São Paulo, the newspaper of the highest circulation in Brazil - a similar pattern appears. Among the top 25 universities, 17 are Federal, 6 are State and 2 are private. Therefore, due to their high quality and free tuition, public institutions usually attract a large number of applicants. In spite of the high demand for their undergraduate degrees, competition is highly heterogeneous by institution and field of study.
Before 2010, the admission system for higher education was decentralized. Institutions organized their own admission exams, the so-called Vestibular, some months prior to the beginning of the academic year or semester. Once the application period was open, students had to opt for a particular degree and pay an inscription fee that would allow them to take the admission test of that specific program-institution. Furthermore, they had to be present on a certain date, time and location and exams were usually offered only in the city of the school. Exams were institution-specific and had a variety of structures and content that often required specific preparation. Because of both high costs of application and moving, the higher education market in Brazil used to be highly localized.
1.2.2
Centralization of Admissions
For the admission process of 2010, the Ministry of Education implemented a centralized admission system called SISU - Sistema de Seleção Unificada. This consists of an online platform, where universities offer their vacancies, and students, using only their grades in the national standardized exam, apply to the offered spots.
Only Federal and State institutions could adopt the SISU and they were free to choose if and how to do so. For instance, they could choose to adopt the system for all the available vacancies, partially or only for some degrees. Institutions adopted the system progressively. Although the adoption of SISU decreased costs of admission processes for both schools and students, many institutions were cautious about how the system would effectively work in the first years of implementation. Table 1.1 shows the gradual expansion of SISU adoption. While in 2010, the system was adopted by 55 institutions offering a total of 17 percent of all undergraduate vacancies in the Brazilian public higher education market, in 2015, the system reached 108 institutions and 59 percent of vacancies. It is also clear from Table 1.1
that the adoption of the centralized system is higher among Federal than State institutions. Since Federal institutions are funded by the national government, they are expected to follow the guidelines of the Ministry of Education. Indeed, by 2015, all but two federal institutions adopted SISU (fully or partially).10 State institutions, on the other hand, had incentives to adopt the centralized system in form of additional resources to be used in student assistance.11
The SISU admission system is solely base on the score students obtained in the so-called ENEM - Exame Nacional do Ensino Médio. This is a national standardized exam handled by the Ministry of Education and available once a year across the whole country. The ENEM exam was created in 1998 as a means of testing the performance of high-school graduates. The importance of the exam has increased over time, as the number of takers went from 157.221, in 1998, to nearly 8.7 million, in 2015.12 As shown in Figure 3.1 fromMachado and Szerman (2018), the evolution of the number of test takers has two jumps. First, in 2004, the exam became a mandatory requisite for PROUNI, a government scholarship targeted at public school and low income students. Second, in 2010, the exam became mandatory for the SISU application.
In order to be used in admission processes, the Ministry of Education reformulated the exam in 2009. It was announced it would become more rigorous and more similar to the admission exams handled by public universities. It consists of 180 multiple-choice questions in four areas - Mathematics, Humanities, Sciences and Languages - and a written essay. Item Response Theory is used for grading, so the scores are comparable across years. Students had to pay a small fee (68 reais or about 20 dollars in 2016), which can be waved in case of financial need. High school graduates had incentives to take the ENEM exam before 2009, as its grade was used fully or partially in some admissions processes of private institutions and in a limited number of public institutions. There were also incentives for high-schools, as national rankings of institutions were elaborated by the Ministry of Education and spread nation-wide every year based on these grades. However, with the adoption of SISU in 2010, incentives increased, especially for students interested in pursuing higher education in public institutions.
Students take the ENEM exam around October or November of the year before starting higher education. The SISU opens its inscriptions in January and July and institutions can
10The two exceptions are UNIR and UFOPA.
11These additional resources could potentially be a confounder of the effect of SISU. Yet, I show that this
is not the case. Although I include both Federal and State institutions in my main specification, results are robust when including only Federal institutions, which do not receive additional resources by adopting SISU. Due to the magnitude of the SISU reform, these additional resources in student assistance might play a marginal role in the enrollment decisions only.
12Since the number of test takers increase from 2010 to 2015, and some of the outcomes of analysis come
choose if they want to offer all their spots in January or split their vacancies between the two yearly editions. Students pay no fee to participate in the system. The SISU is open for 4 or 5 days and students have to submit two choices of institution-major combination (program or degree) at the end of the application period. At the end of every day, the system updates cutoff scores of the programs depending on the people that have already applied. Based on that information, students are able to update their preferences and choose other options for which they might qualify. Only the two choices submitted when the system is closed count for their offers of admission. Candidates are accepted to their most preferred choice. In case they do not qualify, they become part of a waiting list.13
1.2.3
Affirmative Action
Access to public higher education in Brazil has historically been unequal. According to the Census of 2010, 85 percent of students aged 16 to 18 enrolled in high school attended a public institution,14 while only 51 percent of incoming students in public higher education institutions are graduates from public high schools. Moreover, from the high-school enrollees aged 16 to 18, 47.5 percent were non-white and attended a public institution, while only 23 percent of first-year students in public universities were graduated from a public high school and also non-white. The lack of representation of economic and ethnic vulnerable groups in the public tertiary education created a social pressure for more equity in access to this governmental service.
The first public universities to implement affirmative action policies in their admission process were the State University of Rio de Janeiro (UERJ) and the State University of Bahia (UNEB) in 2003. Since then, many other public institutions adopted some type of affirmative action. However, there was not a national initiative that obliged them to do so and many of the country’s best federal institutions were still resistant to adopt quotas. On
13This mechanism of applications is denotedIterative Deferred Acceptance Mechanism. The specific case
of Brazil has recently been studied theoretically by Bó and Hakimov(2016). They find that participants following the simple strategy of choosing the most preferred college in each period is a robust equilibrium that yields the Student Optimal Stable Matching. However, students may not always follow this strategy. Using data from SISU 2016, the authors show that from day 1 to 2, 5.8 percent of programs have their cutoff reduced. The iterative nature of the system might benefit students who are unaware of their true ability, as they are able to update their preferences and apply to programs they first believed to be out of reach. In spite of the positive "feedback feature", SISU is shown to produce some instabilities. For example, around 10 percent of programs have their cutoff reduced after the last update of preferences. This means that, for applicants with grades close to cutoff scores, there might be incentives for strategic applications. The authors conclude that the system could be improved with a combination of an iterative phase and second stage in which unmatched students would submit a list of preferences among the still available options.
14Note that the individuals of 16 to 18 years old that attend high school in Brazil belong to an already
selective group. Around 30 percent of the youth aged 16 to 18 is out of education and other 28 percent is in age-distorted grades, i.e., still in primary or middle school.
August 29th 2012, the Brazilian government approved Law 12.711/2012 - the AA Expansion
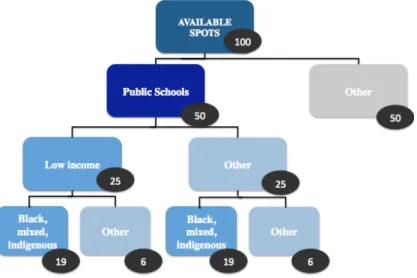
-, stating that 50 percent of the spots in all majors in federal institutions should be reserved to individuals that studied the 3 years of their high school in public institutions.15 The other 50 percent remained open to everyone. Among these reserved vacancies, 50 percent goes to students with family gross per capita income of 1.5 minimum wages or less. Furthermore, a minimum share of the reserved spots is destined to black, mixed and indigenous students (non-white), according to the percentage of these ethnic groups in the population of each state (defined according to the last available population Census). Figure 1.2 contains an example of how the law would be applied to a specific case. Since the state of Bahia has 76.8 percent of non-white, 76.8 percent of the reserved spots or 38.4 percent of total spots have to be reserved to them.
Federal institutions had 4 years to implement the law, i.e., they had to reserve a minimum of 12.5 percent of places in 2013, 25 percent in 2014, 37.5 percent in 2014, reaching 50 percent in 2016, the latest. However, they could adjust to the 50 percent share immediately. Table
1.2 shows the gradual increase in vacancies reserved to affirmative action in Brazilian public higher education institutions from 2010 to 2015. Although reserved spots for quotas increase in every year from 2010 to 2015, it is evident that the adoption of AA, from year 2013 onwards, is responsible for a clear jump in the percentage of reserved undergraduate vacancies offered by institutions. Other interesting aspect is that the increase in reserved spots is driven mostly by the shift in quotas for non-white public school students (ethnic), rather than the vacancies destined to public school students independent of race (non-ethnic).
1.3
Data
This paper uses data from different sources. First, it uses the Census of Higher Education (CES) from 2010 to 2015, which contains information on the universe of students enrolled in undergraduate degrees in all Brazilian institutions. The student level module includes data regarding which program (combination of institution and major) he or she is enrolled in, and demographic information about the student, such as gender, age, ethnicity, place of birth and type of school attended in high school. The CES also comprises modules with data about the institutions and programs, such as number of vacancies and degrees, resources, installations and information regarding professors.
15Note that only federal institutions were required, by law, to adopt the AA policy. State institutions are
not required to do so, as they are not under the federal government administration. Although in my main specification I include both Federal and State institutions, in order to provide results comprehensive for the whole public higher education system, my results are robust when including only Federal institutions, which can be argued to be the most exogenous sample.
I restrict the CES 2010-2015 student-level sample to incoming (or first-year) students only. I also keep only individuals from undergraduate on-campus programs (excluding all online learning degrees) and students that are reported to have been selected through a regular selection process for first year-students (excluding transfers and special programs). Finally, I maintain in the sample only students from Federal institutions and State universities, excluding individuals that attend State centers and institutes.16 My final sample of incoming
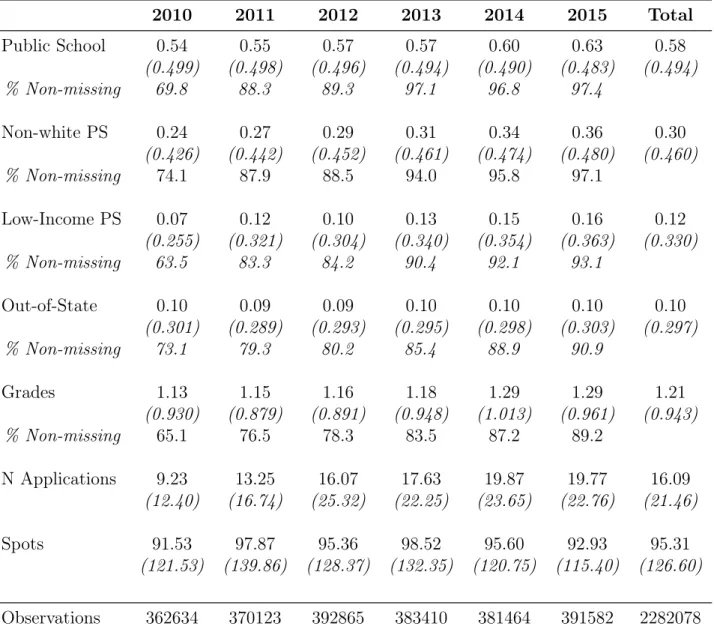
students comprises 2,282,078 individuals, distributed along the 2010-2015 period, as specified by Table 1.3.
Second, I use data from the National Exam of High School (ENEM) Microdata from 2009 to 2014. This dataset contains information on test scores of all students that took the exam in each year with their demographic and socioeconomic characteristics. A unique individual identifier (social security number) is used to link information from the ENEM dataset of year t-1 with the CES data of incoming students of year t. The matched sample comprises 1,829,037 individuals and the matching rate increases from 65 percent in 2010 to 89 percent in 2015. Students from the CES sample that are not found in the ENEM Microdata probably did not take the exam in the year before, either because they were not high school graduates or because they were selected to programs that did not have the ENEM exam as a requirement. The increasing number of matches reflects the growing adoption of the ENEM grade as a requirement for admission in public institutions. Both datasets are only available for researchers upon approval of research projects at the headquarters of the National Institute for Educational Studies and Research (INEP), of the Brazilian Ministry of Education, in Brasilia.
Table 1.3 contains descriptive statistics of the main variables used in the analysis of this paper. It shows an overall increase in the participation of public school, non-white and low-income individuals in the student body, while the share of out-of-state students remained stable. The dummy variables of whether individuals attended a public high school and their ethnicity are based on the information individuals provide in the ENEM questionnaire.17
When the variables are missing, the information is complemented with the answer contained in the CES dataset.18 The variable of low income is defined as whether individuals come
16These individuals correspond to only 5.7 percent of incoming students in public institutions. They are
excluded because the information regarding the adoption of AA in these institutions is missing.
17This might raise concerns about the strategic manipulation of the variables in the self-reported data.
First, students have no incentives to lie when filling the ENEM questionnaire, as the individual students’ answers are not shared with institutions by any means and cannot be used in the admission decisions. Second, to qualify for AA, students need to have attended all three years of high school at a public secondary institution. This information is not easy to be manipulated, as it needs to be proven with school certificates. In the ENEM questionnaire, high school students need to specify which school they are graduating from.
18By adopting this procedure, I reduce considerably the number of missing values for these two
from families with total income of less than one minimum wage and it comes from the ENEM questionnaire.19 The student is defined as from out-of-state if the reported state of residence at the ENEM questionnaire (during the final year of high school) is different from the one where the individual is enrolled in higher education, reported in the CES. The information on grades is an average of the four multiple-choice sections of the ENEM exam: Math, Science, Humanities and Languages. It was standardized to have mean zero and variance one based on all the test takers of that year. Finally, the variables for the number of spots and number of applications per program comes from the CES dataset.
Although the CES dataset contains information on the complete population of first-year students enrolled in Brazilian public higher education institutions, I do not observe individual outcomes for all incoming students, as shown in Table1.3. For instance, in 2010, I observe the type of school attended in high school for 70 percent of the individuals. This share reaches 97 percent in 2015. This selection problem could be an issue for my empirical strategy if the existence of missing values is correlated with the implementation of the treatments. In Section 7, I characterize this problem with detail and show that although the introduction of SISU increases the availability of information, the results of my empirical model remain stable after a series of robustness tests.
In addition to those two administrative datasets, two smaller ones were also used. First, the data of SISU was provided by the Ministry of Education of Brazil (MEC). It contains information on the number of vacancies of each program and institution offered through the centralized admission system from 2010 to 2015. Second, information on the AA expansion was gathered by the author using public documentation of the admission processes, as well as information provided directly by the institutions. The resulting dataset contains the number of vacancies destined to each category of affirmative action of each public institution in the country, from 2010, before the federal law, to 2015, when the law was nearly completely implemented. Additional detailed information regarding data sources, sample restrictions and constructions of each variable are available in the Data Appendix.
the primary source, because studenst answer whether they attended a public high school duringall 3 years
of secondary, a requirement for qualifying to the AA law. In the CES, in contrast, the type of school refers to the the institution where students graduated from in high school.
19Note that the income criteria used in the AA law is different: family per capita income of less than 1.5
1.4
Empirical Methodology
In order to study the causal effects of the implementation of SISU and of the AA Expansion on enrollments of low-socioeconomic status students, I use the following baseline model:
Yiput=β1SISUput+β2AAut+β3SISUput∗AAut+γXput+αpu+αt+αm∗t+εiput, (1.1)
where Yiput is the outcome of student i, of program p, institution u and time t. The treatment variable SISUput ranges from 0 to 1 and is defined as the percentage of spots of program p, institution u, at time t that is offered through the centralized system. The treatment variable AAut also ranges from 0 to 1 and defines the percentage of vacancies at institution u and time t reserved to AA policies. The variable acquires the value one when a share of fifty percent of quotas are adopted, i.e., when the national law is completely implemented. Both variables are demeaned. The inclusion of the interaction between both policies captures the additional effect on the outcome observed when the policies are adopted simultaneously. The vector Xput identifies program controls, which, in baseline, is only the number of vacancies by degree. Finally, I include program fixed effects αpu (which also absorb institution fixed effects, since every program defines major-institution combinations), time-fixed effects αt and a local linear trend αm∗t, defined at the municipality level.20
The main identifying assumption for causal interpretation of parameters β1, β2 and β3
is that dynamics in the outcome variable for treated and control units are equivalent in absence of the treatment. This is analogous to the parallel trends assumption required for exogeneity in a differences-in-differences framework. In this setting, however, the model has multiple periods, multiple treatment and control units and a continuous treatment variable. Yet, the identification assumption is similar. In this type of specification, the presence of program-institution fixed effects absorbs all unobservable time-invariant characteristics at program or institution that might be correlated with the outcome. However, the existence of time-varying unobservable characteristics that are correlated with the outcome could still be a threat to causal identification.
Since the treatment variables are continuous, any binary definition of control and treat-ment group would be arbitrary. Therefore, for illustrative purposes, I present in Table B.1
Panel A, regressions of the main outcomes and covariates used in the analysis in year 2010 on the total treatment jump from 2010 to 2015. Although most of the coefficients are insignif-icant, the point estimates suggest that there might exist some differences in levels between treated and control groups in the baseline. These differences are somewhat expected. In 2010, some institutions or programs had already adopted both of the policies and, therefore, are
expected to have different characteristics if compared to the ones that had not yet adopted them. This difference in levels does not invalidate the exogeneity assumption required to my specification, as long as trends in the outcomes do not change differently between treated and controls. As in a simple differences-in-differences framework, the parallel trends assumption cannot be directly tested. Nevertheless, I run a placebo experiment to provide suggestive evidence that, in pre-periods, this assumption is valid.
Table 1.4 shows results of this exercise for the main outcome variables analyzed in the paper: proportion of public school students (PS), non-white public school students (PSNW), low-income public school students (PSLI) and out-of-state students. As it is usual in the em-pirical literature for fixed effects models (e.g. see Autor 2003), in addition to the treatment variablesSISUpu,tandAAu,t, I include the lead variablesSISUpu,t+1andAAu,t+1, which
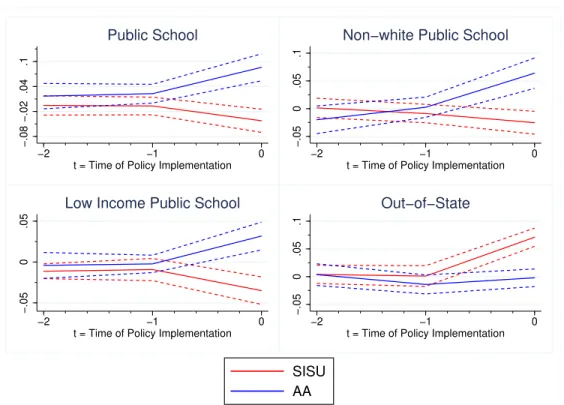
cap-ture the existence of possible trends for the outcomes. Unlike the coefficients forSISUpu,tand AAu,t, the coefficients for the lead variables are close to zero in magnitude and insignificant, providing suggestive evidence that, despite differential levels, in absence of treatment, trends in the outcome variables between treated and control units would likely have been parallel. Additionally, Figure 1.3 presents evidence of an equivalent experiment using two pre-periods instead of one. Results are analogous and confirm that treated and control units had similar pre-trends for the outcomes also when one additional period is included in the placebo test. These exercises show that institutions do not adopt SISU or AA as a response to changes in the outcomes observed one or two years before the implementation of the policies. This means that the adoption of both policies is orthogonal to previous changes in the observed demographic characteristics of the student body. Unfortunately, due to the lack of additional data besides the years 2010 to 2015, used for analysis, the inclusion of additional periods could only occur at the expense of reducing the data sample for testing.21 Yet, the absence
of trends is confirmed by more flexible placebo tests, including either a state-linear trend or no linear trend at the local level, as shown in Table B.2.
1.5
Main Results
1.5.1
Enrollments of Low-SES students
Table 1.5 presents the main results of this paper. The adoption of SISU crowds out students from all vulnerable groups. A full adoption of SISU reduces the enrollments of PS, PSNW
21Note that for the placebo experiment with one lead variable, I use the data from period 2010 to 2014 to
test the treatment implementation from years 2011 to 2015. For the experiment with two lead variables, I use data from 2010 to 2013 to test implementation from periods 2012 to 2015. Therefore, the lack of data from periods before 2010 prevents the testing of parallel trends with multiple pre-periods.
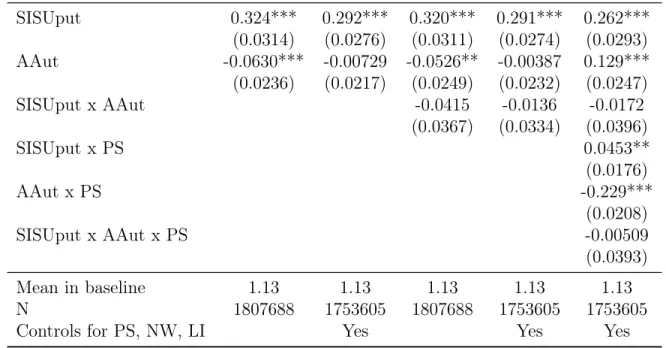
and PSLI by 3.8, 2.8 and 4.1 percentage points, respectively. This represents a decrease of 7, 12 and 59 percent for the average program, when compared to baseline shares. On the other hand, the expansion of AA increases the enrollment of these categories of students. More specifically, the full adoption of the national affirmative action policy (from zero to 50 percent of quotas) increases participation of PS, PSNW and PSLI by 9.9 p.p., 7.0 p.p. and 2.4 p.p, on average, an increase of 18, 29 and 34 percent, compared to baseline shares. The policies act in opposite directions. While SISU hurts the most vulnerable groups, AA increases their enrollments in the public higher education system. Interestingly, the full adoption of AA in the average program more than compensates the crowding out generated by SISU for the PS and PSNW groups. Yet, the effect of AA is comparatively lower for the PSLI. This possibly reflects the lack of effectiveness of the current income criteria used in the national AA law.22 For example, 75 percent of the incoming students in federal institutions in 2012 belong to families with per capita income that fit the AA law target of 1.5 minimum wages or less. Therefore, it seems that this current income rule is excessively broad and does not benefit the poorer individuals among the public school students.
Finally, since the policies act in opposite directions, it is unclear if and how the simul-taneous adoption of both would impact enrollments. The inclusion of a term of interaction between them in the main specification helps clarifying this question. According to Table
1.5, the simultaneous adoption of SISU and AA creates additional effects on enrollments that helps the vulnerable groups. For instance, the effect of SISU on PS enrollment at the mean level of adoption of AA is -3.75 p.p. At the full adoption of AA, it becomes approximately zero.23 This means that, when AA is fully adopted, the interaction between the policies creates an additional effect, which eliminates the negative impact of SISU on enrollments of PS. Similarly, when SISU is fully adopted, the effect of AA becomes equal to approximately 14 p.p.24 Therefore, when SISU is fully adopted, the effect of AA is 40 percent higher than
when it is adopted at the mean.
1.5.2
Heterogeneity of Results
Table 1.5 presents the results on enrollments for the average program and university. Yet, since programs and institutions can be very different regarding their initial characteristics, results are expected to be highly heterogeneous. On Table 1.6 and Figures 1.4 and B.1, I analyze how some of these effects change depending on the initial share of enrollments of
22Remember that I define PSLI as individuals that attended a public school and belong to a family of
total income of less than one minimum wage. In the AA allocation, the income criteria used is considerably broader, encompassing individuals of family income of less than 1.5 minimum wages per capita.
23Here, the effect of SISU is equal toβ
1 +β3 (AA-AA¯ )= -0.0375 + 0.0686 x (1-0.4). 24Here, the effect of AA is equal toβ
PS in the baseline year. Programs with less public school students in 2010 tend to be more competitive. Therefore, it is expected that AA affects their structure the most. Table 1.6
presents results for the baseline specification, with additional interactions of dummies for each quartile of initial share of PS and variables SISU, AA and SISUxAA.
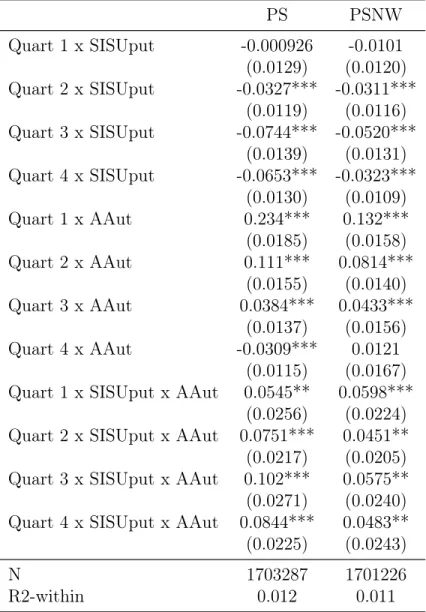
The effect of AA on enrollments of group PS decreases as the initial baseline share in-creases. In the first quartile of PS participation at baseline year, the full adoption of AA increases enrollments by 23 p.p., in the second by 11 p.p., in the third by 4 p.p. and in the fourth it has a negative effect of 3 p.p. The adoption of SISU seems to have little effect in the first quartile and effects in the order of negative 3, 7 and 6 percentage points in the following quartiles. Finally, the effect of the interaction of the policies is positive, signifi-cant and of relevant magnitude in all four quartiles. Although the effect of AA is highly heterogeneous depending on the initial share of public school students, due to its mechanical component, the effect of the interaction between both policies does not seem to be related to this characteristic. Regardless the initial share of PS, the interaction of both policies creates an additional positive effect on enrollments that is not related to the mechanical effect that explains the heterogeneity observed for AA. A similar pattern is observed for the group of PSNW.
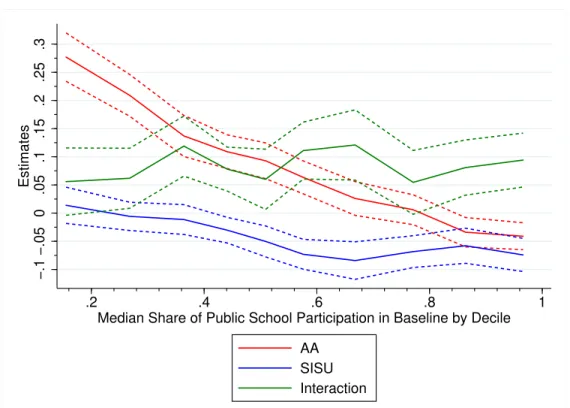
In Figure 1.4, I plot results analogous to Table 1.6, but instead of obtaining coefficients for different quartiles, I estimate coefficients for deciles of initial shares of PS enrollments and plot them against the median share of PS participation in the corresponding decile. The graph presents a pattern very similar to the one shown in Table 1.6. The effect of AA on enrollments of PS decreases remarkably as the baseline share increases. The effect of SISU also becomes more negative, while the impact of the interaction is relatively stable. Figure B.1plots the coefficient of AA on both enrollments of PS and PSNW. Both are highly heterogeneous and decrease remarkably with the initial share of PS, although the coefficients for PSNW are flatter and do not turn negative in the later deciles.
1.6
Potential Mechanisms
The main results presented in Section 5 raise a number of questions related to the mechanisms behind them. Why centralizing admissions crowds out low-SES students from public higher education? It is clear that the AA policy increases enrollments for benefited groups and that this effect is highly heterogeneous depending on initial shares of enrollments of public school students. However, is the effect of AA purely mechanical or is there evidence of any effect on students’ behavior? The interaction between AA and SISU is highly positive, of relevant magnitude and does not seem to be driven by the mechanical component of the effect of AA.
Why the interaction between centralizing admissions and expanding AA creates an additional enrollment-effect for vulnerable groups? Most of these questions cannot be answered with precision with this data and a reduced-form approach, as effects possibly include changes in application behavior and effort provision that induce general equilibrium and spillover effects. Yet, I will try to provide some additional suggestive evidence on the mechanisms behind them.
1.6.1
Why centralizing admissions crowds out low-SES students
from the public higher education?
Results from Table1.5present clear evidence that centralizing admissions crowds out the low-SES students. This is not an obvious result. On the one hand, the reduction of application costs and better access to information benefit low-SES students disproportionately (Bettinger et al. 2012; Pallais 2015; Hoxby and Turner 2015). If this effect had prevailed, the adoption of SISU would likely have increased enrollments of low-SES students. On the other hand, theory predicts that centralization creates more competitive markets. This is confirmed in Table 1.7, which shows that SISU remarkably increases the average number of applications.25
By lowering application costs and providing a nationwide online platform, SISU expands the market of public higher education as a whole. In this line, Machado and Szerman (2018) found that SISU improved the quality of matching between students and institutions, raising the average grades of admitted students and enrollments of students from out of state. Similar results are shown in Tables 1.7 and 1.8. A full adoption of SISU increases average grades of enrollees by 0.3 standard deviations and raises the participation of out-of-state students by 5 p.p. If this effect had prevailed, the implementation of SISU would likely have reduced enrollments of low-SES students, who, on average, have lower average grades than their high-SES counterparts.
In spite the sizeable displacement effects, the impact of SISU on enrollments of low-SES students is not uniform across the distribution of programs. Table 1.9 shows that the full adoption of SISU decreases enrollments of PS, PSNW and PSLI by 6.4, 5.2 and 7.9 p.p. in programs in the lowest quartile of competitiveness. In contrast, SISU has no crowding out effects in the top quartile. Meanwhile, SISU increases enrollments of out-of-state students in all quartiles of competitiveness. The effect is higher in the top quartile: 7.2 p.p. compared
25The average number of applications is defined at the major level and comprises the total number of
applications from both SISU and the decentralized entrance mechanisms. In SISU, individuals can only apply to two programs. Therefore, one could expect that centralization would reduce the number of applications. Yet, SISU can increase the number of applications through two channels: increasing the number of applicants and creating the possibility of one additional application in the same institution. Before centralization, individuals could only choose one major in the same institution and, with SISU, they can now choose two.
to 5 p.p. in the bottom one. Taken together, these results suggest that the creation of a more efficient market alone is not sufficient to explain the heterogeneous pattern of the crowding-out effect.
In Table 1.10, I explore this matter further. I estimate the model separately for out-of-state private and public school students and find considerable differences. For the least competitive degrees (Quartile 1), SISU increases enrollments of out-of-state private school students by 6.6 p.p. and of out-of-state public school students by 4.3 p.p. This represents an increase of 372 and 114 percent respectively, if compared to baseline shares. On the other hand, for the most competitive degrees (Quartile 4), the effect is 7.5 p.p. and 6 p.p., an increase of 78 and 214 percent, respectively. Therefore, in Quartile 1, SISU increases enroll-ments of high-SES out-of-state students by 3.3 times more than of their low-SES counter-parts. This is probably an important driver of the displacement effect observed. In contrast, in Quartile 4, SISU increases enrollments of out-of-state public school students by 2.7 times more than of the private school ones, with no overall effect on enrollments of low-SES stu-dents. This suggests that theseextra out-of-state public school students displace local public school students with lower average grades.
This pattern is corroborated with results from Table1.11. In Quartile 4, SISU increases average grades of private school students by 0.15 standard deviations and of public school students by 0.26. Meanwhile, it has no impact on the demographic composition of enrolled students. Thus, for the most competitive degrees, SISU is able to attract better students in general. Yet, it is able to attract even better low-SES students, increasing efficiency with no cost for equity. In contrast, for the least competitive degrees, SISU displaces low-SES students, increasing efficiency through enrollments of high-SES out-of-state students, but decreasing equity in access.
In sum, the crowding out effect observed is due to the creation of a more efficient nation-wide market combined with the existence of mobility constraints that affect low-SES students only. For the most competitive and more prestigious degrees, SISU is able to attract better students from out of state of different socioeconomic backgrounds. Due to the higher ex-pected future returns of these programs, low-SES students are especially willing to endure the mobility costs of attending college out of their home state. On the other hand, for the least prestigious degrees, costs of mobility become higher than expected returns of attending college out of state for the low-SES students only. Therefore, in this case, SISU attracts out-of-state students that are disproportionately from a higher socioeconomic background, crowding out the PS, PSNW and PSLI groups from public higher education.
1.6.2
Is the effect of AA on enrollments purely mechanical or is
there evidence of any effect on students’ behavior?
From Table 1.5, we learned that the full adoption of AA increases the average enrollments of PS students by 10 p.p. We have also learned that this effect is highly heterogeneous regarding the initial share of PS students. For example, in programs in the first decile, the median share of PS enrollment is 16 percent and the effect of AA is 28 p.p; while in the 8th decile, the median share of PS enrollment is 77 percent and the effect of AA is zero. From this, it is evident that the effect of AA has a large mechanical component. This means that, by construction, AA will have an effect that is larger the lower the initial share of PS is. Howev