CPB Discussion Paper
No 33 July, 2004
Do student loans improve accessibility to higher
education and student performance?
An impact study of the SOFES program in Mexico Erik Canton, Andreas Blom*
The responsibility for the contents of this CPB Discussion Paper remains with the author(s). * Latin America and Caribbean Region, the World Bank.
CPB Netherlands Bureau for Economic Policy Analysis Van Stolkweg 14
P.O. Box 80510
2508 GM The Hague, the Netherlands Telephone +31 70 338 33 80 Telefax +31 70 338 33 50 Internet www.cpb.nl
Abstract in English
Financial aid to students in tertiary education can contribute to human capital accumulation through two channels: increased enrolment and improved student performance. We analyse the quantitative importance of both channels in the context of a student loan program (SOFES) implemented at private universities in Mexico. With regard to the first channel, results from the Mexican household survey indicate that financial support has a strongly positive effect on university enrolment. Two data sources are used to investigate the second channel, student performance. Administrative data provided by SOFES are analysed using a Regression-Discontinuity design, and survey data enable us to perform a similar analysis using a different control group. The empirical results suggest that SOFES recipients (i) show better academic performance, and (ii) tend to have more part-time jobs than students without a credit from SOFES.
Key words: student finance, accessibility, student performance
Abstract in Dutch
Financiële steun aan studenten in het hoger onderwijs kan bijdragen aan de opbouw van menselijk kapitaal via twee kanalen: hogere deelname en verbeterde studieprestaties. We analyseren het kwantitatieve belang van beide kanalen in de context van een
studieleningprogramma (SOFES) ingevoerd bij een groep private universiteiten in Mexico. Voor wat betreft het eerste kanaal wijzen uitkomsten van de Mexicaanse huishoudensenquête erop dat financiële steun belangrijk positieve effecten op deelname aan universitair onderwijs heeft. Twee databronnen worden gebruikt om het tweede kanaal, studieprestaties, te
onderzoeken. Administratieve data geleverd door SOFES worden geanalyseerd gebruikmakend van de Regression Discontinuity (RD) methode, en enquêtedata stellen ons in staat om een vergelijkbare analyse met een anders samengestelde controlegroep uit te voeren. De empirische resultaten op basis van de enquêtedata suggereren dat studenten met een SOFES-lening (i) betere studieprestaties laten zien, en (ii) vaker een bijbaantje hebben dan studenten zonder SOFES-krediet.
Contents
Summary 7
1 Introduction 9
2 Human Capital Model 11
3 Institutional Setting 15
4 Data 19
4.1 SOFES database 19
4.2 SOFES survey 22
5 Impact of Loans on Accessibility to Higher Education 27
5.1 Background 27
5.2 Econometric model and results 29
6 Impact of Loans on Student Behavior 33
6.1 Research strategy 33
6.2 Impact on student performance 35
6.3 Impact on part-time employment 39
7 Conclusion and Policy Considerations 45
References 47
Annex I Calculation of the socio-economic stratification index 49
Summary
In this paper we study the impact of a student loan program implemented in Mexico in 1997. Public universities in Mexico cannot meet the growing demand for higher education, due to budgetary restrictions, only very marginal cost recovery, and efficiency problems. Therefore, many students who are denied entrance into a public university program have to try and find a place in the private higher education sector. However, high-quality private universities charge substantial tuition fees, and students receive no or very little financial support from the government. Not surprisingly, these private universities have traditionally attracted students from affluent families. As a way to expand the potential market, a group of about 40 private universities introduced a credit program for needy and academically talented students. The credit program is both need- and merit-based, but is also selective in the sense that students who bring collateral are preferred. The agency responsible for this student loan program is SOFES, Sociedad de Fomento a la Educacion Superior (Society for the Promotion of Higher Education). This student loan program is supported by a loan from the World Bank. The aim of this paper is to evaluate the impact of the SOFES credit program on accessibility to higher education and on the behaviour of students in terms of academic performance and jobs on the side.
To that end, we use the Mexican household survey and novel data from two sources. First, the SOFES database is a rich source of information on a wide range of variables concerning socio-economic background, educational attainment and information regarding student behaviour. To construct a control group, we propose a Regression-Discontinuity design. Treatment is measured by the size of the credit for which the student is eligible. The estimated treatment effect is thereby connected to what we have labelled the internal margin, i.e. outcome differences due to variation in credit levels within the group of SOFES students. The second data source is a large scale survey among students and graduates, both with and without a credit from SOFES. The control group is then formed by the people who did not receive financial support from SOFES. The impact of treatment thus reflects the effects along the external margin, i.e. between students with and without a SOFES credit.
Briefly, the main findings of this analysis are as follows:
(i) Impact on accessibility to higher education: Using the Mexican household survey ENIGH 2000, we find that students who receive some kind of financial support have a 24%-point higher chance of university enrolment. This is a significant impact. We should mention that this result needs to be interpreted with caution, since we cannot control for some other important variables in the estimation (principally academic aptitudes, type and conditions of financial aid).
Nevertheless, it seems warranted to conclude that financial aid matters for university access. (ii) Impact on academic performance: Using both the SOFES survey and the SOFES database, our findings suggest that SOFES recipients perform better in terms of Grade Point Average (GPA). The GPA increases by 0.174 on a 10 point scale, which is a 3% improvement (or 25% of the standard deviation). However, the causal impact from loans on GPA identified in the
RD-approach is smaller than the survey estimations imply, hence (self-) selection could create a bias in the survey results. In terms of impact on repetition rates, the study does not find a statistically significant effect.
(iii) Impact on part-time employment: Exploring both the SOFES survey and the SOFES database, we find that SOFES recipients work more often than students without loan. The survey data suggest that the likelihood of working on the side increases by 8%-point, while the SOFES database suggests that part-time employment increases by around 30%-point for Master students. This is consistent with the hypothesis that students in the SOFES program are still credit constrained, and therefore have to generate income while studying.
The SOFES program only partially solves the problem of accessibility to higher education. The SOFES program practically operates on no-subsidy / no-profit basis and therefore needs to recover the total outstanding debt. This implies conservative risk taking and highly selective assignment of loans to beneficiaries (by default only students from high-quality private institutions are eligible). Consequently, groups of students still face major problems financing their investments in higher education. A privately run student loan program can help to promote formation of human capital through improving access to higher education, alleviating credit market problems, promoting academic performance, increasing efficiency in the higher education system, and creating savings for the public budget, but it does not suffice to create access to higher education for all segments of the population.
1
Introduction
1The importance of education is underlined in any discussion on economic development. Education is a condition to achieve sustainable economic growth. Human capital makes people more productive, and an educated workforce is needed to support technological change, both in terms of innovation by researchers and through adoption of existing knowledge. Also, education generates a wide range of other social benefits such as better health, less crime, and lower unemployment levels. Education not only yields a high social return, it is also an attractive investment from a personal point of view. Private returns to an additional year of schooling are typically in the range of 5% to 15% (cf. Psacharopoulos and Patrinos, 2002), and these returns are increasing in many countries (for instance because of skill-biased technological change).
The growing importance of knowledge in the production process, popularised as the “knowledge economy”, emphasizes the role of higher education as an engine for economic growth. Access to higher education influences the growth potential of the economy. In many low and middle income countries barriers to higher education entrance are a brake on economic development. Limited access to higher education might be the result of credit market
imperfections, i.e. students facing difficulties to receive loans to finance the cost of their education. Public interventions to relax these credit market imperfections may yield substantial benefits in terms of accessibility to higher education, creation of human capital, and economic growth. Also, it should be noted that credit market problems can be remedied with only limited use of scarce public resources (with the right interventions).
In this paper we study the impact of a student loan program implemented in Mexico in 1997. Public universities in Mexico cannot meet the growing demand for higher education, due to budgetary restrictions, only very marginal cost recovery, and efficiency problems. Therefore, many students who are denied entrance into a public university program have to try and find a place in the private higher education sector. However, high-quality private universities charge substantial tuition fees, and students receive no or very little financial support from the government. Not surprisingly, these private universities have traditionally attracted students from affluent families. As a way to expand the potential market, a group of about 40 private universities introduced a credit program for needy and academically talented students. The credit program is both need- and merit-based, but is also selective in the sense that students who bring collateral are preferred. The agency responsible for this student loan program is SOFES, Sociedad de Fomento a la Educacion Superior (Society for the Promotion of Higher Education). This student loan program is supported by a loan from the World Bank. The aim of this paper is
1
This paper was written while the first author was consultant at the World Bank, on leave from the CPB Netherlands Bureau for Economic Policy Analysis. We thank Bruce Chapman, Bas van der Klaauw, Vicente Paqueo, Dinand Webbink, and participants at a World Bank seminar and a CPB seminar for helpful comments, and Martín Cervantes, Alejandra Diez de Sollano, David Montano Román, and Sergio Ghigliazza Ramos from SOFES in Mexico City for their kind help and hospitality.
to evaluate the impact of the SOFES credit program on accessibility to higher education and on the behaviour of students in terms of academic performance and jobs on the side.
The set-up of this paper is as follows. In Section 2 we recapitulate the human capital model, and briefly review the important market failures and appropriate policy actions in the higher education sector. This provides us with the analytical framework that will be applied throughout the paper. Section 3 provides some background information on the Mexican higher education sector, and discusses the SOFES loan program in more detail. Section 4 describes the data. Section 5 addresses the question of accessibility: has the SOFES credit program increased accessibility to higher education for needy students? In Section 6 we study the impact of the loan program on student behaviour. In particular, we analyse whether the program affected student performance and the decision to take a part-time job. Section 7 concludes and touches upon policy considerations.
2
Human Capital Model
According to the human capital approach, education is considered as an investment in human capital (cf. Becker (1964), Schultz (1961)). The costs of the investment include tuition fee payments, expenses on study material, and the indirect cost of deferred participation in the labour market. This last component, the opportunity cost of attending education, is typically the most important cost for students in higher education. Benefits include higher future labour market earnings, increased job security, and better career opportunities. Rational human capital investors base their educational investment decision on a comparison between the costs and benefits of attending an additional year of education.2
When markets operate well, one should expect that the outcome based on the human capital model is an optimal equilibrium solution, and there is no need for government intervention. There are however several potential imperfections in the market for higher education that may lead to inefficient outcomes. First, the standard human capital approach assumes that students have access to credit markets to finance the cost of their education. In that situation, students can make decisions on how much to invest in higher education independent from the financial resources of their family. The students’ financial needs are accommodated by the credit market. However, in reality commercial banks are typically reluctant to provide credits to students. Banks will not accept the students’ prospective human capital as collateral: banks cannot sell the human capital in case of insolvency, slavery is abolished. In addition, banks have imperfect knowledge about the students’ efforts to complete the program and their academic ability to do so. The first information problem could lead to moral hazard, i.e. students reducing their effort to complete the program or graduates reducing their labour supply (such as searching for part-time work instead of a full-part-time appointment) to try and circumvent their repayment
obligations. The second information problem may induce adverse selection. Students who are more likely not to be able to repay their loan, the “bad risks”, would be more interested in applying for a student loan than the “good risks”. Banks therefore charge a risk premium on top of the risk-free interest rate. This further discourages the good risks to apply for a bank loan, as it entails that the high ability students cross-subsidise the low ability students. Adverse selection would further drive up the risk premium, possibly turning the credit system unsustainable over time. Information problems and their adverse behavioural responses by students and the collateral problem create the credit market problems in higher education financing. When banks are not willing to provide student loans, the government has to intervene in order to ensure that needy students can collect the funds to pay for their education. The government could provide guarantees to commercial banks, or the government could directly provide student loans. The
2
Also, investment in human capital could be explained by the screening hypothesis: people invest in education to signal their ability to future employers (cf. Arrow (1973) and Spence (1973)). Besides investment motives, people may also want to attend higher education because it yields direct utility (i.e. higher education as consumption). Probably all three motivations (building human capital, consumption, and screening) play a role in the enrollment decision, but there is widespread agreement among economists that the human capital model is the dominant explanation.
empirical relevance of credit market imperfections as a barrier to access to higher education is debated in advanced economies (see e.g. Heckman and Carneiro (2003), Kane (1995), Dynarski (2003), and Cameron and Taber (2000)). However, in middle income countries with large income inequalities and limited public student support such as Mexico, difficult access to credit is a real problem with potentially strong implications for higher education enrolment.
A second reason for government interference in the higher education sector is associated with the presence of human capital externalities. People often transfer knowledge outside the usual market transactions, for instance through social interactions. The benefits of education thereby partly accrue to those who have not made educational investments. This implies that society benefits more than the individual who made the human capital investment. In that case, the social return to education is higher than the private return, leading to under-investment in education. To restore the socially efficient investment level, the government needs to subsidise education up to the point where private and social returns to education are equalised. Research on the empirical relevance of these human capital spillovers is still developing. Until now, most studies find no evidence for large discrepancies between private and social returns to education at given levels of public subsidisation of higher education (cf. Temple (2001), Sianesi and Van Reenen (2003) for reviews of the literature). However, human capital externalities can be large for specific disciplines (for instance Life Sciences, Engineering), but no studies are available in which human capital spillovers are attempted to be linked to careers.
Thirdly, investments in education are risky. Prospective students cannot properly assess the effect of the program on their human capital, graduates could end up unemployed, structural shifts in the economy could reduce the worth of the acquired human capital (think of the boom and bust in the demand for ICT-consultants), there is considerable variation in the returns to schooling between individuals, and so forth. Students cannot insure themselves against these contingencies, the insurance market is far from perfect. Risk-averse people might therefore be reluctant to invest in education. The government could partly correct for this insurance market imperfection by offering student loans with income-contingent repayment arrangements. A successful example of such a loan scheme is the Australian Higher Education Contribution Scheme (HECS), see Chapman (1997), Chapman and Ryan (2003), and CPB and CHEPS (2001).
These notions of market imperfections and suitable government actions to restore efficiency and provide equal opportunities are important additions to the human capital model. Our main interest in this paper is to analyse the impact of student loans on access to higher education, bearing in mind that credit market imperfections could erect serious barriers to university entrance in Mexico. A second objective of this study is to investigate the effects of the loan program on student behaviour. While there is a large literature on the first topic, only few studies on the second question are available (e.g. Turner (2003), Stinebrickner and Stinebrickner (2003), Bettinger (2004), Belot et al. (2004)). This is strange, as the actual creation of human capital within universities will be intimately intertwined with the behaviour
of students. An important question is for instance how students allocate their time between leisure, study, and part-time jobs. If students face financing problems, they might be forced to earn additional income from jobs on the side. Labour time could compete with study time, so these jobs on the side could have an adverse effect on student performance. This in turn is likely to increase the time-to-graduate, which is costly to the student (even when taking into account that jobs on the side reduce the opportunity cost of education) and also for society (as the supply of skilled people is effectively reduced). The relationship between financial support and the behaviour of students in terms of performance and part-time employment will be
3
Institutional Setting
Before turning to the SOFES loan program in more detail, let us first briefly describe the Mexican higher education sector. In 2000, almost two million students were enrolled in higher education. The enrolment rate in tertiary institutions is 21% in 2000/2001 (data from UNESCO; enrolment rates are defined as a percentage of the 5-year age cohort following on from the upper secondary-school leaving age).3 Educational attainment shows an upward trend in Mexico. The relative supply of skilled workers with higher education was about 40% higher in 1999 than in 1987 (cf. De Ferranti et al., 2002).
Estimates of the (annualised) private return to higher education in Mexico range from 13% (De Ferranti et al., 2002) to 24% (Chapman, 2003). The relative wages of workers with tertiary education increased substantially over the past 15 years in Mexico, as well as in most other Latin American countries (De Ferranti et al., 2002). In combination with the observation that the relative supply of high-skilled workers has also increased, this points at the emergence of skill-biased technological change (possibly related to increased openness of the Mexican economy). The increasing college premium in Mexico in combination with the relatively low higher education enrolment compared to other countries in Latin America and the OECD suggests that there exists substantial room for expansion of the higher education sector.
About 71% of the students are enrolled in a public university, and 29% attends a private university. The physical capacity of public universities is limited, and there exists a large unmet demand in the public higher education system. According to Mexican officials, about 80% of the applicants at public universities are denied access, though about half of this group is qualified. Students who are not accepted at a public university could try to enrol in a private university. Both the quality of the programs offered and the tuition fees charged show large variation within the private higher education sector. About ninety selective private universities are unified in FIMPES, Federacion de Instituciones Mexicanas de Educacion Superior (the Mexican Federation of Private Universities). FIMPES has its own accreditation mechanism to monitor the academic quality. FIMPES universities founded SOFES, which now covers more than 40 universities.
Students who apply for a SOFES loan provide information about their educational background, socio-economic circumstances, and so forth. This information is used to assess whether the student qualifies for a credit from SOFES, and, if so, the amount of the credit. The financial funds that the family could afford to spend on the student’s education (IAE, Income Available for Education) is calculated as (average monthly family income / number of dependents between the age of 4 and 26 in the family) × 0.15. The average cost of the university (ACU) is defined as the enrolment fee plus the monthly tuition fee. The economic need factor (ENF) is calculated as IAE / ACU. In addition, to be eligible for a SOFES-loan,
3
This is lower than in Argentina (48% in 1999/2000), Bolivia (36%), Chili (38%), Colombia (23%), Uruguay (36%), and Venezuela (29%), but higher than in Brazil with a tertiary enrollment rate of only 17%.
students must have a minimum grade point average at upper secondary school of 7 (on a 10 point scale). The assignment matrix of SOFES loans is presented in Table 3.1.
Table 3.1 Assignment matrix for SOFES credits
Percentage of tuition fee covered by SOFES-loan Advised scholarship
(percentage of tuition fee) Area I
Humanities and Social Sciences Area II Economics and Administration Area III Engineering and Natural Sciences (excluding Chemical Eng.) 0.01 ≤ ENF<0.08 30 [20] 40 [30] 50 [40] 50 0.08 ≤ ENF<0.15 40 [30] 50 [40] 60 [50] 25 0.15 ≤ ENF<0.30 45 [35] 55 [45] 65 [55] n.a. 0.30 ≤ ENF<0.50 50 [40] 60 [50] 70 [60] n.a. 0.50 ≤ ENF<0.68 50 [40] 60 [50] 80 [70] n.a.
Note: The first number refers to the SOFES credit for students with a mortgage free real estate property as collateral. The number in brackets refers to the SOFES credit for students without a mortgage free real estate property as collateral.
Notice that SOFES prefers low risk students to safeguard repayment of the loans. Students whose parents own a real estate property are eligible for a 10%-point larger loan than students without such a guarantee. Secondly, students from middle or higher income families can receive a larger loan than students from low income families. SOFES has to balance between its equity goal (access independent of family income), and its goal to operate as a financially viable institution.4 In addition, the credit level depends on the study field, categorised into three areas (Humanities and Social Sciences, Economics and Administration, and Engineering and Natural Sciences). Finally, SOFES can recommend universities to give grants to students from
relatively needy families (i.e. with an ENF lower than 0.15).5
Students eligible for the SOFES loan need to reapply after every term of their program. Renewal of the loan is contingent upon student performance: students only receive the renewal when they are promoted to the next term. Renewal is also contingent upon payment of interest: insolvent students do not receive the next part of the SOFES-loan.
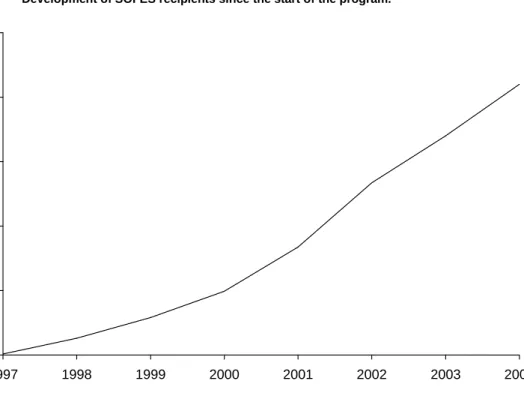
Figure 3.1 shows the development of the number of SOFES recipients over time. The data for 2003 and 2004 are forecasts. Currently there are almost 20,000 students with a credit from SOFES. This is a relatively small number, compared to a total higher education enrolment of almost 2 million students.
4
As students are still confronted with up-front payments, the credit market imperfection is not fully removed by this student loan program (cf. Chapman, 2003).
5
Figure 3.1 Development of SOFES recipients since the start of the program. 0 5000 10000 15000 20000 25000 1997 1998 1999 2000 2001 2002 2003 2004 S O F E S r e c ip ie n ts
4
Data
The data we use in this analysis come from three sources. First, we use the SOFES database containing detailed information on all students receiving a credit from SOFES. Second, we use data from a large-scale survey (carried out in 2003) among students and graduates at Mexican private universities who are member of SOFES. Finally, we use census data on educational attainment and incomes. In this section we describe the data sources. As the Mexican household survey is well-documented6 , we concentrate on the first two sources.
4.1
SOFES database
The database includes information on the student’s educational attainment (for instance grade point averages at various school levels), socio-economic background (e.g. family income, educational attainment of the father, employment information), study program and grade point average during the last term of the program, and a lot of other information. The important variables of the SOFES database are summarised in Table 4.1.7 The first column refers to Bachelor-students with a SOFES-credit, and the second column refers to Master-students with a SOFES-credit. With regard to educational attainment, the SOFES database provides
information on the three previously attended schools. In case of a Bachelor-student, this means upper secondary school (Bachillerato), lower secondary school (Secundaria), and primary school (Basica). In case of a Master-student, the last three attended programs are the Bachelor-program, upper secondary school (i.e. high school), and lower secondary school. This
distinction should be kept in mind when interpreting the results. The table shows that Master-students have slightly higher grade point averages at upper secondary school and lower
secondary school than Bachelor-students. In about half of the cases it is reported that the student attended a private school. As the majority of students in primary and secondary education attends public schools, this suggests that attendance of private schools increases the likelihood of attending university (and this is confirmed in the econometric analysis on Mexican census data presented in Section 5). About half of the SOFES-recipients in Bachelor-programs is female, and 41% of the SOFES-students at the Master-level is female. The average educational attainment of the father is high school.
6
See, for instance, the documentation provided at http://cursos.itam.mx/rodrigo/encuestas/enigh/2000/. 7
As the information is double-checked by SOFES, the data quality in the SOFES database is high. There are, however, a few peculiarities and we cleaned the data in the following way. We dropped missing cases on study field, students in a Ph.D.-program, extreme observations on grade point averages (lower than 6 and larger than 10), extreme reported income levels (lower than 1,000 pesos per month and larger than 50,000 pesos per month), very low reported credit levels (lower than 0.2), very low reported levels of the socio-economic stratification index (lower than 2.1), and very high reported levels of additional financial support (more than 30,000 pesos). Finally, we only include people who are studying at the moment of data collection (June, 2003). The data used in this paper is a random sample of the total SOFES database.
Table 4.1 Summary statistics of the SOFES database
Bachelor-students with a SOFES-credit Master-students with a SOFES-credit
Mean St. dev. Mean St. dev.
General information
Age 22.68 4.38 26.49 6.03
Percentage of female students 50.56% 41.34%
University information Area I Area II Area III 35.19% 40.43% 24.39% 32.90% 47.21% 19.89% GPA 8.48 0.70 8.55 0.66
Tuition fee per month 5,112 pesos 569 5,131 pesos 654
Educational attainment
GPA at Bachelor-program 8.42 0.68
Private university 52.07%
GPA at upper secondary school 8.36 0.73 8.43 0.78
Private upper secondary school 61.60% 47.35%
GPA at lower secondary school 8.51 0.75 8.77 0.74
Private lower secondary school 51.25% 44.78%
GPA at primary school 8.89 0.70
Private primary school 53.61%
Socio-economic information
Father’s educational attainmenta 3.99 1.56 3.85 1.72
Monthly family income 12,778 pesos 8,577 11,764 pesos 7,839
Socio-economic stratification indexb 13.52 4.51 12.95 4.34
Job on the side 24.78% 50.64%
Grant 9.82% 8.44%
Own house 68.19% 61.09%
Program information
Economic Need Factor 0.15 0.11 0.16 0.14
SOFES credit 43.82% 11.02 44.47% 11.52
Observations 6,102 699
a
Educational attainment is measured on a scale from 0 to 6 where the numbers have the following meaning: no completed program (0); completed primary education (1); completed lower secondary education (2); completed lower secondary technical education (3); completed upper secondary school (4); completed higher education (5); completed postgraduate education (6).
The socio-economic stratification index is measured on a scale from 2.1 to 29. The methodology to calculate the index is described in Annex I.
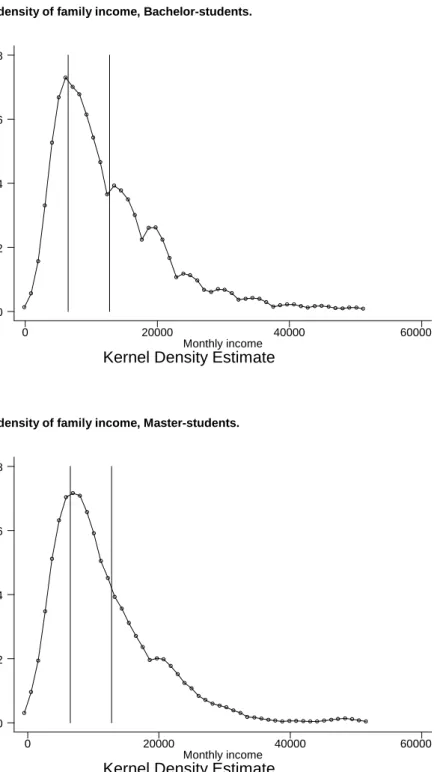
Average monthly family income is around 12,800 pesos for Bachelor-students, and 11,800 for Master-students (1 US$≈10 pesos). Figure 4.1 shows the Kernel density estimate for family income of Bachelor-students, and Figure 4.2 shows the Kernel density estimate for family income of Master-students.8 Both density functions have long tails to the right, suggesting that a non-negligible fraction of SOFES-students comes from relatively affluent families. This is confirmed by comparing average family incomes of SOFES recipients with household data. The vertical line at 6,491 pesos is average family income obtained from the Mexican household 8
survey ENIGH 2000, and the vertical line at 12,778 pesos is average family income of the SOFES recipients.9
Figure 4.1 Kernel-density of family income, Bachelor-students.
D e n s it y
Kernel Density Estimate
Monthly income 0 20000 40000 60000 0 .00002 .00004 .00006 .00008
Figure 4.2 Kernel-density of family income, Master-students.
D e n s it y
Kernel Density Estimate
Monthly income 0 20000 40000 60000 0 .00002 .00004 .00006 .00008 9
Census data is obtained from the Mexican household survey ENIGH 2000 (Encuesta Nacional de Ingresos y Gastos de los Hogares). To make the data comparable, the census data is corrected for inflation (using CPI data from International Financial Statistics).
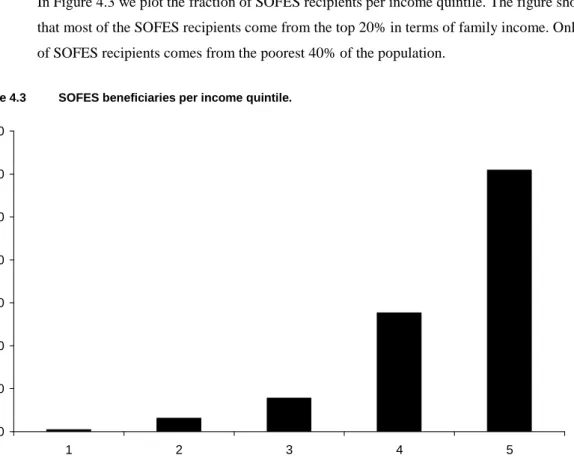
In Figure 4.3 we plot the fraction of SOFES recipients per income quintile. The figure shows that most of the SOFES recipients come from the top 20% in terms of family income. Only 5% of SOFES recipients comes from the poorest 40% of the population.
Figure 4.3 SOFES beneficiaries per income quintile.
0 10 20 30 40 50 60 70 1 2 3 4 5 Income quintile S O F E S b e n e fi c ia ri e s ( % )
About 25% of the Bachelor-students and 50% of the Master-students reports to have a job on the side. Only 10% of the students receives a grant. Ownership of a house by the student’s family is 68% for Bachelor-students, and 61% for Master-students.
Approximately 35% of the Bachelor-students is enrolled in an Area I subject (Humanities and Social Sciences), 40% in an Area II subject (Economics and Administration), and 24% in an Area III subject (Engineering and Natural Sciences). For Master-students the distribution between the three subject areas is 33%, 47%, and 20%, respectively. Tuition fees are
approximately 5,100 pesos per month (i.e. about US$ 510). The Economic Need Factor (ENF) for Bachelor-students is about 0.15, and for Master-students 0.16. Recall that this ENF is used to calculate the amount of credit for which the student is eligible. On average, a student receives a loan covering 44% of the tuition fee.
4.2
SOFES survey
In the summer of 2003, SOFES conducted a large scale survey among students and graduates in Mexico. The survey was designed for this impact study. Four groups were surveyed: students with a SOFES credit, students without a SOFES credit, graduates with a SOFES credit, and graduates without a SOFES credit. Three universities participated in the survey: Universidad Tecnologica de México, Instituto Tecnológico de Monterrey, and Centro Universitario Grupo
Sol. These three universities form a small but fairly representative sub-sample of the more than 40 universities offering SOFES loans.
Table 3 summarises the information collected from the survey.10 The table shows summary statistics of the SOFES survey for students without SOFES credit (i.e. the control group), and SOFES-recipients (the treated group). The survey is organised into seven categories:
1. General information 2. University information 3. Educational attainment 4. Family information
5. Student’s employment and income information 6. Information on SOFES credit program
7. Performance of SOFES credit program
In the first block general information is collected on the students’ age and gender. Students with and without SOFES credit are comparable in terms of average age and gender distribution.
The second block contains university information. We asked the student’s career, the name of the university, her performance in terms of grade point average and percentage of repeated courses, if she took an entry exam at a public university, and – if so – if she passed the entry exam, and the tuition fee level. The majority of the respondents is from Universidad
Tecnológica de México. The table shows that SOFES-recipients show a better average student performance than students without a loan, both in terms of grade point average (8.20 for the treated group versus 8.06 for the control group) and percentage of repeated courses (4.35% for the treated group versus almost 5% for the control group). About 45% of both groups reported to have taken an entry exam at a public university, and approximately a third of the applicants was accepted.
The third block surveys the student’s educational attainment. The table shows that SOFES-recipients more often attended a public high school (51%) than their colleagues without a credit from SOFES (37%). In terms of grade point average at high school, SOFES-recipients perform better than students without the loan.
The block on family information presents statistics on family income and educational attainment of the student’s parents. Average monthly household income in the treated group is almost 14,000 pesos, which is substantially lower than household income in the control group (more than 20,000 pesos, with a large right-tail). The parent’s educational attainment is somewhat higher in the control group (but differences are small).
10
We only include Bachelor-students in the analysis (too few observations of graduate students are available, so we excluded them). Extreme values of the percentage of repeated courses (>50%) are dropped.
Table 4.2 Summary statistics of the SOFES survey
Students without SOFES-credit Students with SOFES-credit
Mean St. dev. Mean St. dev.
I General information
Age 22.63 4.09 22.47 3.56
Percentage of female students 42.32% 38.03%
II University information
Humanities and Social Sciences, Area I 13.25% 19.15%
Economics and Administration, Area II 50.05% 42.00%
Engineering and Natural Sciences, Area III 36.71% 38.85%
Centro Universitario Grupo Sol 13.34% 13.27%
Universidad Tecnológica de México 63.20% 73.46%
Instituto Tecnológico de Monterrey 23.46% 13.27%
GPA 8.06 0.70 8.20 0.59
Percentage of repeated courses 4.99% 7.45 4.35% 6.87
Percentage of students who took entry exam at public
university 45.81% 45.48%
Percentage of students who passed entry exam at public university from students who took an entry exam (Percentage of total sample who passed entry exam at a public university)
34.88%
(15.98%)
36.45%
(16.58%)
Tuition fee level 19,226 15,266 15,240 12,048
III Educational attainment
Percentage of students at public high school 37.26% 51.44%
GPA at high school 7.98 0.72 8.13 0.68
IV Family information
Family income 20,348 37,383 13,757 10,224
Father’s educational attainment
None Primary
Lower Secondary
Lower Secondary Technical Upper Secondary
University Graduate
Estimated Years of Schooling
0.65% 7.85% 13.93% 6.36% 20.28% 39.44% 11.50% 13.2 1.26% 8.40% 12.46% 8.54% 23.67% 36.55% 9.10% 12.8
Mother’s educational attainment
None Primary
Lower Secondary
Lower Secondary Technical Upper Secondary
University Graduate
Estimated Years of Schooling
0.65% 10.85% 19.85% 15.49% 21.80% 25.97% 5.29% 11.7 1.10% 12.40% 21.35% 17.36% 18.32% 24.93% 4.55% 11.4
Table 4.2 Summary statistics of the SOFES survey (Continued) V Student’s employment and income information
Percentage of students with job on the side 35.83% 38.21%
Income from job on the side 7,572 5,904 6,128 4,693
VI Information on SOFES credit program
SOFES credit 53.98% 15.19
Student’s perception of credit level - Low
- Sufficient - High
11.51% 85.34% 3.15%
Student’s perception of interest rate - High
- Normal
- Low
14.29% 73.49% 12.23% Student’s perception of repayment period - Short
- Normal - Long
1.30% 94.04% 4.66% Student’s perception of requirements
Less than expected Reasonable Excessive Difficult to meet 3.98% 80.11% 10.97% 4.94% Percentage of students indicating that SOFES-credit has
affected their university enrolment decision 47.95%
What would have happened if student would not have received a credit?
Would not study
Study at another university Need more time
Would not finish No effect 28.89% 9.22% 38.93% 11.97% 11.00% Percentage of students who know people that did not enrol
in university because of economic reasons 68.97% 69.45%
Percentage of students indicating that SOFES-credit has
affected their effort 59.40%
Percentage of students indicating that the credit affected
their choice of discipline 22.33%
VII Performance of SOFES credit program
Percentage of students indicating that provision of
information is insufficient 5.50%
Percentage of students indicating that they were not
informed on time about deadlines 8.80%
Performance of SOFES representative Bad Normal Good 4.13% 5.78% 90.10% Number of observations 1,087 731 Source: 2003 survey
The fifth block is on the student’s employment and income situation. The table shows that SOFES recipients more often report to have a job on the side than students without a credit. SOFES students with part-time jobs earn slightly less income than students without a loan, possibly an indication that SOFES-students work less hours.
The sixth block presents information on the SOFES credit program. We asked the
percentage of credit the student has received from SOFES, the student’s perception of the level of credit, the interest rate on the SOFES credit, the length of the repayment period of the SOFES credit after graduation, and the requirements to obtain a SOFES credit. We also asked whether the SOFES credit affected the student’s decision to enrol in a university program, what would have happened if the student had not received a SOFES credit, and if the student puts in more effort because of the credit. The majority of SOFES-recipients considers the level of the SOFES credit sufficient, but 12% finds the offered credit low. The fact that this group decided to enrol in a higher education program may suggest that accessibility is not jeopardised. But this group of students might be forced to search for additional sources of income to pay for their education. Also a majority of students considers the interest rate charged on the SOFES credit as normal. Almost all SOFES recipients perceive the length of the repayment period as normal, and 80% thinks the requirements are reasonable.
Finally, the seventh block contains information on the student’s perception of the performance of the SOFES credit program. It was asked how the student considers the provision of information by the SOFES representative at the university, if the student is informed on time on important dates (such as the deadline for renewal of the loan), and how the student considers the performance of the local SOFES representative. The general message from this block is that most students are satisfied. Only 5.5% answered that they regarded the information provided by SOFES as insufficient, and 90% considers the performance of the local SOFES representatives at the universities as good.
5
Impact of Loans on Accessibility to Higher Education
5.1
Background
The SOFES student loan program seeks to solve credit market imperfections in the higher education sector. So we would expect that SOFES contributes to the accessibility of university programs for the low and middle income students. To get a first impression, we asked the surveyed students whether the SOFES credit has affected their university enrolment decision. Almost half of the students, 48%, responded affirmative (cf. Table 3). We also asked what would have happened if the student would not have received a credit from SOFES: 29% would not have enrolled in university, 9% would have enrolled in another institution, 39% would have required more time to complete the program, 12% would not have been able to finish the program, and only 11% replied that it would not have affected them. Finally, about 70% of the respondents indicated that they know people that did not go to university for economic reasons. These findings suggest that the SOFES credit played an important role in the enrolment decision.
Do we indeed observe an increase in accessibility in the data? To study the impact of student loans on accessibility of higher education, information is needed on people who face the question whether to enrol in higher education or not. Typically, these are people in the age of 18-24 who completed high school. When information is available on academic abilities (for instance grade point averages at upper secondary school), socio-economic background, tuition fee levels, college premium, financial support, and the outcome of their enrolment decision (enrolment or no enrolment) we could estimate enrolment elasticities with regard to tuition fee levels and financial support. Unfortunately, the SOFES database and the questionnaire held in 2003 only provide information on people who already are enrolled in a higher education program. In order to get an idea of the impact of financial support on student enrolment, we explore information from the Mexican household survey ENIGH 2000 in this section.
Figure 5.1 give an impression of the accessibility of higher education per income category. The figure shows higher education enrolment (as a percentage of the 18-24 age cohort) per income quintile. The inequalities are very large. University enrolment exceeds 25% in the richest quintile of the population. In contrast, university enrolment in the poorest quintile is only 3%. To study the causes of these inequalities, we look at university enrolment per income quintile among high school graduates in Figure 5.2. This figure gives an impression of transition probabilities from high school into tertiary education. Though the differences across income quintiles are less pronounced, there are still important inequalities in university
entrance. Specifically, high school graduates from the richest income quintile have a 50% larger probability of university enrolment than high school graduates from the poorest quintile. Figure 5.3 shows high school completion rates per income quintile, and reveals that the inequalities with regard to university entrance are equally strongly caused by inequalities in high school
completion. Effective government action to promote access to higher education thus not only calls for an appropriate student finance program (to reduce differences in transition probabilities from high school into tertiary education as illustrated in Figure 5.2), but also requires an improvement in high school completion rates among the poor and middle income groups (Figure 5.3).
Figure 5.1 Higher education enrolment in Mexico, 18-24 age cohort, 2000.
0 5 10 15 20 25 30 1 2 3 4 5 Income quintile U n iv e rs it y e n ro ll m e n t (% )
Figure 5.2 Higher education enrolment in Mexico among high school graduates, 18-24 age cohort, 2000.
0 10 20 30 40 50 60 70 1 2 3 4 5 Income quintile U n iv e rs it y e n ro ll m e n t (h ig h s c h o o l, % )
Figure 5.3 High school completion in Mexico, 18-24 age cohort, 2000. 0 5 10 15 20 25 30 35 40 45 50 1 2 3 4 5 Income quintile H ig h s c h o o l c o m p le ti o n ( % )
5.2
Econometric model and results
ENIGH 2000 provides information on educational attainment, age, income, and also on student support. This allows us to estimate the effect of financial support on accessibility to higher education. To that end, we can estimate the following PROBIT-model:
i i i i X T DENROL=1) =α+β +γ +ε Pr( (5.1)
where DENROL=1 if the person has attended university and 0 otherwise, i refers to the student,
α is an intercept term, X is a vector of control variables, T indicates “treatment”, and ε is an error term. The treatment effect refers to whether or not the student receives financial support from the government. To include this treatment effect, we define a dummy DAID=1 when the student receives a grant from the government, and 0 otherwise. We only include people aged 18-24 and with completed high school (a requirement to be eligible for university entrance) in the sample.
Table 5.1 Impact of financial support on higher education enrolment among high school graduates, household survey
DENROL DENROL DENROL
DAID 0.248c (0.064) 0.216c (0.069) 0.241c (0.070) INCOME (×1000 pesos) 0.005c (0.002) 0.005c (0.002) 0.007c (0.002) DFEMALE 0.017 (0.028) − 0.027 (0.029) 0.027 (0.031) AGE 0.068c (0.007) 0.094c (0.008) 0.119c (0.009) DHIGHSCHOOL_FATHER − 0.131c (0.047) − 0.133c (0.049) − 0.107b (0.051) DUNIVERSITY_FATHER 0.163c (0.043) 0.130 (0.046) 0.109b (0.048) DHIGHSCHOOL_MOTHER − 0.174c (0.046) − 0.208c (0.046) − 0.185c (0.049) DUNIVERSITY_MOTHER 0.229c (0.051) 0.236c (0.051) 0.241c (0.051) WORKHOURS − 0.007c (0.001) − 0.004c (0.001) DPRIVATE_school 0.404c (0.029) N 1,442 1,442 1,442 R2 0.094 0.148 0.232
Note: The regression method is PROBIT. Standard errors are between brackets. a
Significance at the 10%-level. b
Significance at the 5%-level. c
Significance at the 1%-level.
The results are shown in Table 5.1. The reported coefficients should be interpreted as the change in the probability for an infinitesimal change in each independent continuous variable, and the discrete change in the probability for dummy variables. For other factors than the treatment variable (student support), we find the following: (i) the family income variable appears with a positive and strongly significant coefficient: a 1,000 pesos increase in family income corresponds to a 0.5%-point increase in the probability of university enrolment; (ii) students whose father and / or mother only completed high school have a lower probability of university enrolment, and students whose parents completed a university program have a higher probability of university enrolment; (iii) the number of hours devoted to labour market activity has a negative impact on university enrolment: according to the second column, a student who works 8 hours per week has a 5.6%-point lower chance of tertiary education enrolment; and (iv) attendance of a private secondary school strongly influences university enrolment: a student who attended a private school has a 40%-point larger probability of university entrance, and this effect is highly significant.
For the treatment effect - student support - we find that the probability of university enrolment for the eligible population (aged 18-24, with completed upper secondary school)
markedly increases when the students receive financial support from the government. Students with financial support have a 24%-point larger probability of university enrolment than students without financial support, and the effect is highly significant. This impact is not sensitive to the set of controls included in the regression model.
We should mention that these results need to be interpreted with caution. First, we cannot control for some other important variables in the estimation. For instance, we do not have data on academic aptitudes. When financial aid is merit-based, the coefficient on DAID may be biased upwards. Hence, students enrol not because they receive financial aid, but because they are academically proficient which makes them eligible for financial aid. Second, there are some interpretation difficulties. With regard to the student support variable, the amount of the financial support, its conditions (e.g. merit-based, or need-based), and timing of the student aid (some of the financial support may have been granted for primary and secondary education) are not specified in the survey. These problems call for prudence in the use of the econometric results, but it seems warranted to conclude that financial aid matters for university access.
6
Impact of Loans on Student Behaviour
The second channel through which financial support can contribute to human capital accumulation is by changing the behaviour of students. According to the survey results (cf. Table 3), almost 60% of the students indicated that they increased their effort because of the loan. In this section we first discuss the proposed methodology to investigate the relationship between loans and student behaviour, and then turn to a discussion of our findings for student performance and part-time employment decisions.
6.1
Research strategy
We want to investigate the effect of the SOFES loan on the behaviour of students in terms of part-time employment decisions and student performance. To estimate the impact of SOFES on student behaviour we need to have a control group. In case of the survey data the group of students that did not receive a credit from SOFES can be used as a control group. The general regression model is given by
i i i
i X T
Y =α +β +γ +ε (6.1)
where Y is the endogenous variable of interest, and the other symbols have the same meaning as above. The treatment effect, i.e. the impact of the intervention on the outcome variable, is measured by γ. Ideally, assignment to the treatment group and the control group is random (a so-called controlled experiment; this is the standard research method in for instance
pharmaceutical studies where the effects of new drugs are tested). In our case, assignment to the treatment group and the control group is not random, but linked to a set of observed and unobserved factors. Whereas we can correct for the observed factors (the most important being the student’s socio-economic background), the influence of unobserved factors (such as the student’s motivation) cannot be ruled out. When the incidence of treatment depends on unobserved factors (technically, cov(εi,T)≠0), γ will be biased.
Let us further discuss some sources of selection bias. Treatment is not a random event, but the outcome of a deliberate application process. Before entering our analysis as a SOFES recipient, several decisions by students could create sample bias. Students applying for a SOFES loan are well-informed about the terms and repayment conditions, and this can create selection bias. In particular, unmotivated students are not likely to apply, as the consequences of default are severe. Whereas we control for student ability by including information on GPA in the analysis, we do not have an indicator for the student’s motivation. When SOFES students are more motivated than the average student, we might find a positive treatment effect on student performance while this is actually a selection effect. To take such selection effects into
account, the question whether SOFES students put in more effort can yield some insight into the importance of “credit-induced” motivation, although it only captures part of the story.
Second, students without a credit, i.e. the control group, may actually have unsuccessfully applied for a SOFES loan. To the extent that rejected SOFES applicants more closely resemble accepted SOFES applicants than the group that did not apply, the treatment and control group become more similar in observed and unobserved characteristics. This leads to a downward bias of the treatment variable. It is likely that this bias is small, as the coverage of SOFES is still limited.
These potential sources of selection bias should be kept in mind. However, as we shall describe in more detail below, our econometric strategy employing the administrative data does not suffer from selection bias, as treatment is “randomly” assigned. A comparison of the results from both data sources should enable us to get an idea of the quantitative importance of selection bias in the survey data.
An alternative to a controlled experiment is a natural experiment, in which the researcher uses creative solutions to construct a randomly selected treatment group. In our case, we can design a natural experiment by using discretionary changes in the assignment rules. As we have seen in Section 3, the amount of credit a student can receive depends on the student’s so-called Economic Need Factor (ENF) in a discretionary way. For instance, a student can receive a credit of 30% of the tuition fee when her ENF is 0.079, but she can receive a credit of 40% when her ENF is 0.08. However, students just below and just above the threshold will be closely comparable. Assignment to treatment thus involves a random element. This
identification strategy is known as the Regression-Discontinuity (RD) approach (cf. Van der Klaauw, 2002; Kane, 2003). Formally, the financial aid allocation process can be characterised as: } { 1 . } { 1 . } { 1 . } { 1 . 1* 2 2* 3 3* 4 4*
1 ENF ENF ENF ENF ENF ENF ENF ENF
Ti =δ i ≥ +δ i≥ +δ i≥ +δ i ≥
where 1{} is the indicator function, taking the value 1 if the logical condition in brackets holds and the value 0 if not. In words, this equation says that the credit level assigned to students depends on the ENF with known discontinuities at cut-off points ENF*. As ENF is the only systematic determinant of the credit category for which the student is eligible, this structure is known in the literature as a sharp RD design.11 The assumption behind the RD design is that in the absence of the student loan program, the relationship between the dependent and the
11
It should be noted that ENF is not a perfect predictor of student loans, and some randomness is present in the data. We therefore also performed the econometric analysis using a “fuzzy” RD design (cf. Van der Klaauw, 2002). In the fuzzy RD design we adopt a two-stage least squares method. In the first stage we estimate the credit level from the dummy indicating whether the student’s ENF is above or below the threshold. In the second stage we use the credit level as the treatment variable, and perform the sensitivity analysis as presented in Tables 5 and 7. Results hardly changed, and therefore we do not present them.
independent variables would be continuous. The cut-off points are (cf. Table 1): ENF1*=0.08; ENF2*=0.15; ENF3*=0.30; ENF4*=0.50. We compare the outcome variable around the cut-offs.
In this section we will present an econometric analysis on the impact of the loan on student behaviour, using both the SOFES database and the survey data. It should be noted that in the latter case the treatment effect refers to an effect along, as we call it, the “external” margin, i.e. being a SOFES recipient or not. In contrast, the impact of SOFES using the RD-design should be interpreted as an effect along the “internal” margin, i.e. between SOFES-recipients with different credit levels. Econometric results may differ due to unobserved heterogeneity and non-linearity.
6.2
Impact on student performance
Does the level of student support impact on the academic performance of students? On the one hand, students receiving a large loan might be enticed to put in less effort. Universities carry the default risk, and this could lead to moral hazard among students (see Section 2). On the other hand, peer pressure to show good performance on students eligible for a SOFES credit might lead to an opposite effect: students receiving a large loan perform better than students receiving a smaller credit, everything else being equal. In addition, and perhaps more importantly, the loan program is contingent on student performance: a student will receive renewal of the loan only after passing the previous term of the program. To investigate the relationship between loans and student performance, we estimate a model of the following form,
i i i
i X T
GPA =α+β +γ +ε (6.2)
where GPA is the grade point average achieved in the previous term of the program.
Results using the SOFES database are presented in Table 6.1 (Bachelor-students) and 6.2 (Master-students). The table should be read as follows. The cut-off at ENF=0.08 is denoted by DS=0.08 (DS stands for discontinuity sample). We want to compare the change in the outcome variable close to the point of discontinuity. To that end, four sub samples are defined within a narrow range around the cut-off point, but with an increasing width, e.g. DS±0.005, DS±0.01, DS±0.015, and DS±0.02.12 So the first row in Table 5A uses the sub sample 0.075<ENF<0.085, and the second row 0.07<ENF<0.09, etc. More observations become available when the range is widened, but the groups below and above the threshold become more dissimilar. Column (2) denotes the average of the variable of interest in the region below the cut-off (denoted by “<RD”), and Column (3) denotes the average of the variable of interest in the region above the 12
Because of small numbers of observations, we cannot exploit the discontinuity at DS=0.50. For similar reasons, we sometimes omit RD estimation for the smallest sub sample, we sometimes use a broader band width, and we cannot provide a complete sensitivity analysis (including the complete set of control variables) in all cases.
cut-off (denoted by “>RD”). Results from an OLS procedure without controls are reported in Column (4). Socio-economic background controls are added in Column (5), and educational background controls are added in Column (6).
Table 6.1 Impact of SOFES on GPA, Bachelor students, SOFES data
N <RD >RD OLS DS=0.08 (1) (2) (3) (4) (5) (6) ±0.005 253 8.544 8.456 − 0.088 (0.094) − 0.051 (0.088) 0.020 (0.080) ±0.010 733 8.504 8.430 − 0.075 (0.052) − 0.070 (0.050) − 0.046 (0.045) ±0.015 1,051 8.544 8.456 − 0.088 (0.044) − 0.089b (0.042) − 0.043 (0.038) ±0.020 1,292 8.547 8.470 − 0.076 (0.040) − 0.070a (0.038) − 0.024 (0.034) DS=0.15 ±0.005 125 8.359 8.550 0.197 (0.130) 0.162 (0.130) 0.102 (0.107) ±0.010 571 8.460 8.497 0.040 (0.066) 0.027 (0.064) − 0.015 (0.057) ±0.015 683 8.459 8.503 0.046 (0.059) 0.036 (0.057) − 0.008 (0.050) ±0.020 802 8.491 8.539 0.049 (0.053) 0.043 (0.051) 0.002 (0.045) DS=0.30 ±0.01 58 8.484 8.638 0.154 (0.174) 0.226 (0.193) 0.158 (0.163) ±0.02 270 8.474 8.707 0.234b (0.098) 0.236b (0.101) 0.109 (0.086) ±0.03 328 8.471 8.648 0.177b (0.082) 0.165b (0.084) 0.113 (0.074) ±0.04 395 8.478 8.604 0.126a (0.071) 0.136a (0.072) 0.082 (0.063) Controls
Socio-ec. background No Yes Yes
Educational background No No Yes
Note: Standard errors are between brackets. a
Significance at the 10%-level. b
Significance at the 5%-level. c
Significance at the 1%-level.
Controls denoted by “socio-economic background” include the tuition fee level, a dummy indicating whether a student receives a grant or not, family income, the socio-economic stratification index, a dummy indicating the student’s gender, the student’s age, and a dummy indicating whether the student’s family owns a real estate property. Controls denoted by “educational background” include the student’s grade point average at the highest three completed education levels, dummies indicating the type of school attended (public or private), the term of the program in which the student is enrolled, and dummies indicating the study area. DS stands for discontinuity sample and equals the cut-off points for the Economic Need Factor (ENF) where the loan amount increases by additional 10% of tuition.
For Bachelor-students, we do not find a systematic treatment effect of student loans around DS=0.08 and DS=0.15, but the impact of credits on student performance is positive at DS=0.30. A coefficient of 0.234 means that the higher credit level for students above the threshold increases their GPA by 0.234 points (on a 10 point scale). This corresponds to a 3% improvement in grades obtained, which is a relatively large effect. However, statistical
significance is lost when educational background controls are included. No systematic treatment
Table 6.2 Impact of SOFES on GPA, Master students, SOFES data
N <RD >RD OLS DS=0.08 (1) (2) (3) (4) (5) (6) ±0.01 86 8.638 8.491 − 0.147 (0.163) − 0.122 (0.174) − 0.156 (0.163) ±0.02 154 8.592 8.603 0.011 (0.114) 0.001 (0.113) 0.023 (0.102) ±0.03 211 8.607 8.621 0.014 (0.096) − 0.031 (0.099) − 0.025 (0.085) ±0.04 297 8.559 8.634 0.075 (0.079) 0.036 (0.082) − 0.011 (0.070) DS=0.15 ±0.01 65 8.538 8.622 0.085 (0.255) − 0.108 (0.257) − 0.078 (0.238) ±0.02 86 8.547 8.435 − 0.112 (0.184) − 0.183 (0.188) − 0.115 (0.151) ±0.03 130 8.496 8.465 − 0.032 (0.122) − 0.094 (0.126) − 0.036 (0.106) ±0.04 173 8.544 8.438 − 0.106 (0.109) − 0.164 (0.113) − 0.050 (0.094) DS=0.30 ±0.02 34 8.640 8.578 − 0.062 (0.241) − 0.167 (0.266) − 0.234 (0.309) ±0.03 43 8.700 8.708 0.008 (0.204) 0.032 (0.213) − 0.058 (0.232) ±0.04 48 8.714 8.693 − 0.022 (0.203) − 0.068 (0.206) − 0.094 (0.207) Controls
Socio-ec. background No Yes Yes
Educational background No No Yes
Note: Standard errors are between brackets. a
Significance at the 10%-level. b
Significance at the 5%-level. c
Significance at the 1%-level.
Controls denoted by “socio-economic background” include the tuition fee level, a dummy indicating whether a student receives a grant or not, family income, the socio-economic stratification index, a dummy indicating the student’s gender, the student’s age, and a dummy indicating whether the student’s family owns a real estate property. Controls denoted by “educational background” include the student’s grade point average at the highest three completed education levels, dummies indicating the type of school attended (public or private), the term of the program in which the student is enrolled, and dummies indicating the study area. DS stands for discontinuity sample and equals the cut-off points for the Economic Need Factor (ENF) where the loan amount increases by additional 10% of tuition.
effects were found for Master-students (cf. Table 5B).
A comment is in order. Students in the control group receive a lower loan and have a lower ENF than students in the treated group. This could induce so-called dynamic selection bias when loans matter for the enrolment decision. Specifically, students in the control group may be better motivated, as they decided to study despite the lower financial support from SOFES. To the extent that this motivation effect increases student performance, the treatment effect is biased downwards. Our estimated impact from loans on student performance from the RD approach should therefore be considered as a lower bound of the unbiased impact.
Table 6.3 Impact of the SOFES loan on student performance, survey data
GPA REPEAT Treatment effect DCREDIT 0.174c (0.037) − 0.005 (0.004) Socio-economic controls TUITION (×1000 pesos) 0.006c (0.002) 0.000 (0.000) INCOME (×1000 pesos) 0.001 (0.001) − 0.000 (0.000) DFATHERTECH 0.103 (0.072) − 0.001 (0.008) DFATHERUNIV − 0.013 (0.040) 0.000 (0.004) DMOTHERTECH − 0.067 (0.052) − 0.001 (0.006) DMOTHERUNIV 0.013 (0.044) 0.005 (0.005) DFEMALE 0.113c (0.037) − 0.005 (0.004) AGE 0.015c (0.005) − 0.003c (0.001) Educational background GPA_high school 0.150c (0.027) − 0.004 (0.003)
DPRIVATE_ high school 0.005
(0.036) 0.006 (0.004) DAREA_II 0.045 (0.051) 0.005 (0.005) DAREA_III 0.034 (0.054) 0.012b (0.006) Intercept 6.303c (0.241) 0.122c (0.026) N 1,412 1,424 R2 0.063 0.026
Note: The regression method is OLS. Standard errors are between brackets. a
Significance at the 10%-level. b
Significance at the 5%-level. c