Energy Procedia 14 (2012) 438 – 444
1876-6102 © 2011 Published by Elsevier Ltd. Selection and/or peer-review under responsibility of the organizing committee of 2nd International Conference on Advances in Energy Engineering (ICAEE).
doi:10.1016/j.egypro.2011.12.955
Energy
Procedia
Energy Procedia 00 (2011) 000–000
www.elsevier.com/locate/procedia
International Conference on Advances in Energy Engineering
Mid-Term Load Forecasting: Level Suitably of Wavelet and
Neural Network based on Factor Selection
Pituk Bunnoon
a*, Kusumal Chalermyanont
a, Chusak Limsakul
aaElectrical Engineering Department, Fuculty of Engineering, Prince of Songkla University, Songkhla 90120, Thailand
Abstract
This paper proposes the level suitably of a wavelet transform and a neural network method that are very significant technique for a load forecasting. An accurate forecast of the load demand is an essential activity for fuel reserve planning in a power system. Level adjustment of wavelet is demonstrated in this research based on mid-term load demand forecasting in Thailand. The factor correlating with approximate and detail of each level of wavelet is chosen by using the correlated value between factors and components. All of Features input selected are used to the neural network for training and forecasting. The forecasted results show that “two-level” has good prediction properties compared to other level of wavelet transform clearly.
© 2011 Published by Elsevier Ltd. Selection and/or peer-review under responsibility of ICAEE 2011
Keywords: Forecasting; Wavelet transform; Neural Network; Level Suitably; Factor selection
1. Introduction
Mid-term load forecasting plays an important role in the reliability of a power system. It is vital for planning of an adequate fuel reserves to generate the electricity to the consumption demand for the future. This forecast is complicated an effect on load demand by depending two major factors: the complexity of an economy and a weather factor of the whole area. The load forecasting can be classified into four differential types in the power system planning: very short term, a minute to an hour; short term, an hour
* Corresponding author. Tel.: +66-74-558831; fax: +66-74-459395.
E-mail address: [email protected]
© 2011 Published by Elsevier Ltd. Selection and/or peer-review under responsibility of the organizing committee of 2nd International Conference on Advances in Energy Engineering (ICAEE).Open access under CC BY-NC-ND license.
to three months; mid term, three months to three years; long term, three years to twenty five years. Several methods have been developed for forecast that is statistical and artificial intelligent methods.
In conventional, many papers have used statistical method such as regression, multiple linear regressions (MLR), and autoregressive integrated moving average (ARIMA). These methods focus on an estimating of coefficients of variables that are linear and the best. There are prospected functional forms describing quantitative relationship between the electricity demands and influencing factors by using the historical data. Recently, with the emergence of intelligent technologies, the artificial neural network (ANN), the fuzzy logic (FZ), and the genetic algorithm (GA) have been widely implemented to improve the accuracy of load forecasting.
Wavelet is a powerful tool that can be effectively utilized for forecasting of short-term and mid-term load demand forecast. It can be integrated with the other algorithm such as neural network and fuzzy logic. For the present, many researchers preferred differential applications. The paper ref. [1] shows the combination of wavelet and neural network for short-term forecasting based on similar day, furthermore there are three integrating of the method applied to demand forecast that are fuzzy logic, wavelet transform, and artificial neural network in similar year [2]. In ref. [3], the article shows an adaptive wavelet neural network algorithms approach to the energy price forecasting. In 2005, load forecasting proposes wavelet neural network methods which are considered based on the climate factors [4]. In 2008, the research shows a wavelet transform improving an ability of neural network to the next day load [5] and in this year a paper proposes the combination of wavelet, neural network, and genetic algorithm to the demand forecast [6]. In ref. [7], the wavelet transform presents multi-level of the wavelet integrating with neural network to the forecast based on the holiday corrections. In the research ref. [8]-[9], present a demand forecasting using wavelet coefficients integrating with the back propagation neural network and meteorological index based on wavelet de-noising integrating with support vector machine, respectively.
In this research proposes the load demand forecasting by using wavelet transform in a preprocessing stage and neural network in a forecasting stage. In the preprocessing, we use four levels in preprocessing that are one, two, three, and four levels of wavelet to decompose an original signal into detail and approximate components. After that, the detail and approximate forecasted value components will correlate with factors for finding the correlated value and chose features input for a neural network to the prediction. Lastly, the final forecasted values obtain form the detail and the approximate combination. This paper presents a comparison of an accuracy of each level of wavelet transform of forecasting founded on mean absolute percentage error (MAPE).
This article presents the 5 major sections. The section 2 presents an electricity load demand characteristics and theoretical background. The section 3 offers a case study and research stages. The section 4 shows results and discussion. Finally, the conclusion is drawn in section 5.
2. Electricity Load Demand Characteristics and Theoretical background 2.1. Electricity load demand characteristics
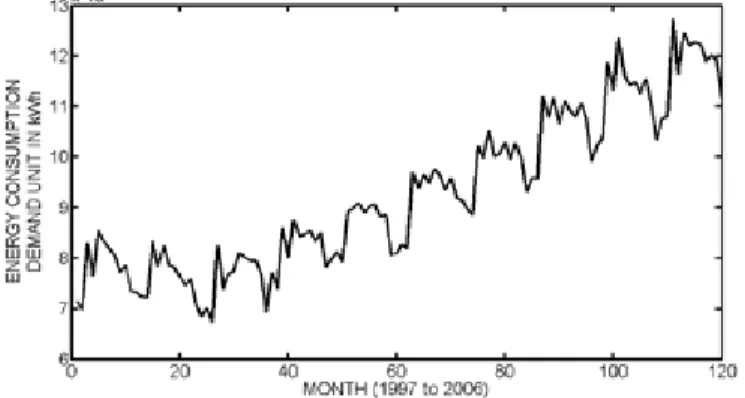
The graphic representation shows the electricity load demand unit in kWh, as illustrates in Fig.1 that is a behavior of an electric trend component increasing every year. The demand interval year 1997 to 2006, case study of Thailand are used in this research. The trend in 1997 to 1999 was quite stable because the world economic problems had occurred and affected to the industrial sectors of the country. In 2000 to 2006, the electricity demand grows at rate 4~6 percent per year. For example, the demand in May was 8,749,926,336 kWh in 2000, 11,171,134,811 kWh in 2004, and 12,444,389,521 kWh in 2006.
The changeable of load behavior in mid-term load demand is very different from a short-term load demand, which it also has a cyclical component, but does not has a trend component of the demand. Thus,
this forecast is significant to find the suitable factors for analyzing the behavior and the trend decomposition from an original load demand, will be discussed in the next section.
Fig. 1. Electricity load demand (kWh) of Thailand 2.2. Wavelet decomposition and reconstruction
This part offers a brief summary of wavelet transform method which can be divided into two categories: continuous wavelet transforms (CWT) and discrete wavelet transforms (DWT). This research, discrete wavelet transform (DWT) is used. The DWT algorithm is capable of producing coefficients of fine scales for capturing high frequency information, and coefficients of coarse scales for capturing low frequency information. Wavelet processing has two stages: decomposition and reconstruction. The decomposition computes the convolution between the load demand and high pass/ low pass filter, while the reconstruction calculates the convolution between the load and inverse filter. In this paper, a mother wavelet based on Daubechie2 (Db2) is used for the filter’s coefficients. It used to decompose an input load demand into low frequency and high frequency components. The decomposition is implemented by using multi-channel filter bank: one, two, three, and four-channels. The reconstructed details and approximations are true parameters of the original signal as follow: S1L=A1 + D1 (Level1), S2L= A2 +
D2 + D1 (Level2),S3L= A3 + D3 + D2 + D1 (Level3), and S4L= A4 + D4 + D3 + D2 + D1 (Level4).
Where SNL is the kWh demand which is decomposed and reconstructed based on N Level (N=1, 2, 3... N).
2.3. Neural network algorithm and Pearson’s correlation
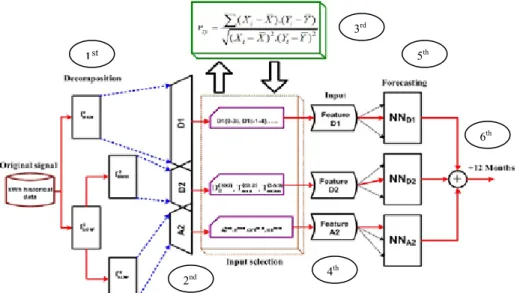
The artificial neural network is one of a good choice to apply for the load demand forecasting problem because this technique is not requiring explicit models to represent the complex relationship between the load demand and factors. The neural network algorithm presented in this paper composes of three layers: the input layer, the hidden layer, and the output layer based on feed-forward back propagation algorithm (FFBP). The input variables come from historical and present data of factors affecting the load demand. The fundamental structure of this algorithm can be presented in Fig. 2. The Pearson’s coefficient correlation equation (rxy) in Fig. 2, it is used to evaluate correlation between variables and is one of the
most familiar measures of dependence between two quantities to show how good a linear relationship among variables or factors is. In the case that the Pearson correlation is +1, it will signify a perfect linearly positive increasing correlation trend. If the Pearson correlation is -1, it will indicate a perfect linearly negative declining correlation trend. If the Pearson correlation is between 1 and -1, it will indicate a degree of linear dependence between the two variables. Lastly, if the Pearson correlation is zero, it
shows that there is no relationship between the variables. Before a load forecasting, we must correlate all variables with the energy consumption load demand to choose the appropriate variables for the best feature inputs for the research model. Where x and y are variables and ris the Pearson product moment of correlation.
3. Case Study and Research stages 3.1. Case study
To demonstrate the low and high frequency demand features employ the historical electricity load demand data, which were recorded as monthly from the Electricity Generating Authority of Thailand (EGAT) from January 1997 to December 2007 are used. Furthermore, a weather factor and an economic factor are also used in this research.
Fig. 2. The two levels of wavelet transform (pre-processing) and neural network method 3.2. Research stages
The main steps proposed for load demand forecasting model are as follows: the first, an original signal of load demand is decomposed to high and low frequency by using dB2 mother wavelet (dB2) for calculating the coefficient of detail (D) and approximate (A) components. The level of wavelet varies from 1 level, 2 levels, 3 levels, and 4 levels based on wavelet discrete transform (DWT). In each decomposition level by wavelet method will obtain the detail and the approximate as follows: there are detail and approximate components for one level, these are D1 and A1; there are the two details and a approximate components for the two levels, these are D1, D2, and A2 respectively; there are the three details and a approximate for the three levels, these are D1, D2, D3, and A3 respectively ; lastly, there are the four details and a approximate for the four levels of wavelet transform, these are D1, D2, D3, D4, and A1 respectively. All data above after decomposing are recorded and taken to step 2. Secondly, coefficient components from step 1 (the first) are reconstructed to the actual components using similar mother wavelet (dB2), these are an actual detail and approximate components of each level. The third, actual detail and approximate components are taken to find the relationship between each component in each
1st 3rd 5th 6th 2nd 4 th
level and factors such as temperature, humidity, rainfall, consumer price index, and industrial index. The fourth, factors which related with the component more than that 40 percent (up) will be chosen it being as quality inputs for a neural network model. Note that, the factor is chosen in each component of wavelet differing following related value. The fifth, feature inputs of a model NNDforecast consists of the detail component and factors are selected from step 4 and the feature inputs of a model NNAforecast consists of an approximate (A) and factors are also selected from this step too. The sixth, after partial forecasts in each sub-model: for example, the 4 levels, sub-model consists of A4, D4, D3, D2, and D1 models; the outputs for all sub-model are integrated to the final forecasting value, can see in sub-section 2.1. Finally, analyses and summary of all level of wavelet presenting are carried out.
4. Results and Discussion
The performance of this developed method for mid-term load forecasting has been tested by using the kWh-actual load demand of the Electricity Generating Authority of Thailand (EGAT) (for year 2000-2007)., and actual temperature data of the Thai Meteorological Department, and economic data of Ministry of Commerce of Thailand (year 2000 to 2007) are used.
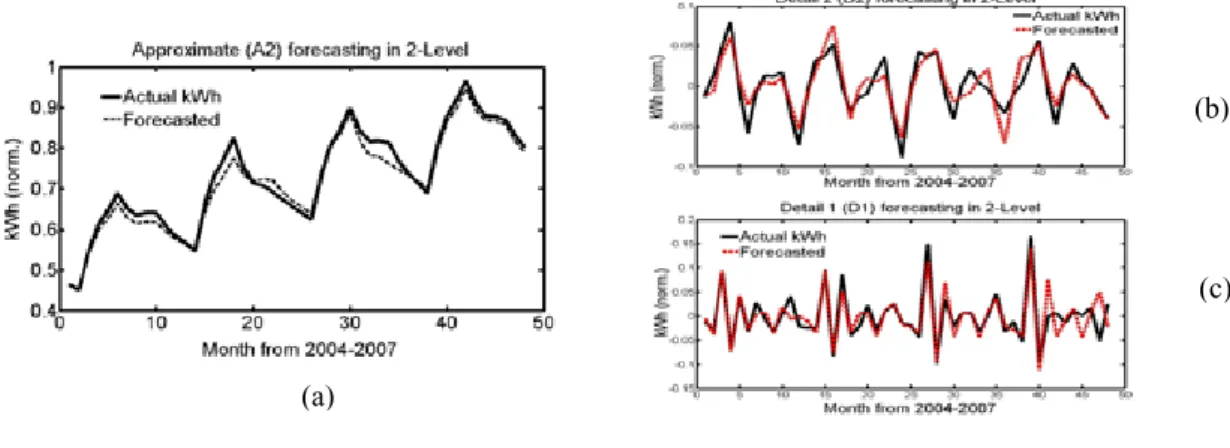
Fig. 3. Actual and forecasted value of (a) Approximate 2; (b) Detail 2; (c) Detail 1 of the two levels MAPE is given by the following:
(1) Where kWhAis the actual energy consumption load, kWhFis the forecast load, Nis the number of data.
1 | | 1 100 N A F A kWh kWh MAPE N kWh − =
∑
× (a) (b) (c)Pituk Bunnoon et al.\ / Energy Procedia 14 (2012) 438 – 444 443 Fig. 4. Comparison between actual and forecasted value in each level
In Fig.4 shows the forecasted results obtained from the four models of wavelet transform in pre-processing stage. The black line is actual load demand. The green, red, blue, and brown lines are one, two, three, and four levels of wavelet which MAPE were 3.58, 2.25, 2.83, and 3.45 percent respectively. The most suitable of level of wavelet transform had been investigated using the mean absolute percentage error (MAPE) as criteria. Most suitable level of wavelet is, “two levels” which show in Fig.2, 3.
5. Conclusion
This paper presents the mid-term electricity demand forecast using level suitably of wavelet in preprocessing, and neural network to load prediction. The historical data from EGAT is decomposed into one to four levels of different frequencies. The correlation technique is used to capture the suitable affecting factors for each frequency component of load demand. The factors which affected in each level are chosen as neural network inputs. Testing results show that the combination of wavelet and neural network which level of wavelet is varied from one to four levels in preprocessing stage that the, “two levels of wavelet,” is given the Mean Absolute Percentage Error (MAPE) better than that other level. In the future research, we will use this model applied to electricity sub-control areas forecasting to whole area.
6. Acknowledgement
This work was funded by the Office of the Higher Education Commission. Pituk Bunnoon was supported by CHE510382 Ph.D. Scholarship.
References
[1] Ying Chen, Peter B. Luh, Che Guan, Yige Zhao, Laurent D. Michel et al.. Short-Term load forecasting: Similar day-based wavelet neural networks. IEEE Trans.on power systs.; 25, p.322-330, 2010. [2] Ajay Shekhar Pandey, Devender Singh, and Sunil Kumar Sinha. Intelligent hybrid wavelet models for short-term load forecasting. IEEE Trans.on power systs.; 25, p.1266-1273, 2010.
[3] N. M. Pindoriya, S. N. Singh, and S. K. Singh. An adaptive wavelet neural network-based energy price forecasting in electricity markets. IEEE Trans.on power systs.; 23, p.1423-1432, 2008.
[4] Jian-Chang Lu, Zhi-Hong Gu, and Hui-Qing Wang. Research on the application of the wavelet neural network model in peak load forecasting considering of the climate factors. International conference on machine learning and cybernetics; p.538-543, 2005.
[5] Chun-Xiang Li, Dong-Xiao Niu, and Ming Meng. Using wavelet transform to improve generalization ability of neural network in next day load curve forecasting. International conference on machine learning and cybernetics; pp.1526-1531, 2008.
[6] Jia Zheng-yuan, Tian Li, and Zhao Dan. Application for short-term power load forecasting using improved wavelet neural network based on GA. International conference on risk management and engineering management; p.353-356, 2008.
[7] Yige Zhao, Peter B. Luh, Carl Bomgardner, and Gutav H. Beerel. Short-term load forecasting: Multi-level wavelet neural networks with holiday corrections. IEEE conference on power and energy society general meeting; p.1-7, 2009.
[8] Renjie Song, and Yixin Bian. Short-term load forecasting in power system based on wavelet coefficients and BP neural network. Asia-Pacific on power and energy engineering conference; p.1-4, 2009.
[9] Li Ran, and Gua Chaoyun. The relevance analysis between electrical day peak load and meteorological index based on wavelet de-noising and SVM.. International conference on electric utility deregulation; p.788-793, 2008.