MODELLING THE ULTIMATE SHEAR BEHAVIOUR OF DEEP
BEAMS WITH INTERNAL FRP REINFORCEMENT
Boyan Mihaylov
Structural Engineering, Department of ArGEnCo, University of Liege, Bât. B52, Quartier Polytech 1, Allée de la Découverte 9, 4000 Liege, Belgium
Abstract
Fiber reinforced polymer (FRP) reinforcement in deep beams has been proposed as an alternative to steel reinforcement to increase the durability of members in corrosive environments. Since FRP reinforcement has lower stiffness than steel reinforcement and typically exhibits higher tensile strength, there is a need for new models capable of capturing the effect of these properties on the shear strength of deep beams. This paper proposes such an approach for members without shear reinforcement, which is an extension of a two-parameter kinematic theory (2PKT) for steel-reinforced deep beams. The original approach is modified to account for the effect of large flexural strains on the shear capacity of the critical loading zones in deep beams where the concrete crushes at failure. It is shown that a simple modification based on test data can result in adequate shear strength predictions. It is also shown that the extended 2PKT captures well the effect of reinforcement stiffness, shear-span-to-depth ratio, and section depth on the shear capacity of deep beams with FRP reinforcement.
Keywords: deep beams, FRP reinforcement, shear strength, kinematic model, ultimate deformations
1
Introduction
Deep reinforced concrete beams with small shear-span-to-depth ratios (a/d ≤ approx. 2.5) are often used to support heavy loads in bridges and other types of public infrastructure. Concerns about the durability of such structures due to corrosion of their steel reinforcement have resulted in search for alternative solutions. One such solution – which in the last decade has been a focus of significant research activity – is the use of internal fiber reinforced polymer (FRP) reinforcement. Compared to conventional steel reinforcement, FRP bars are not susceptible to chloride-induced corrosion and typically have higher tensile strength. At the same time, FRP reinforcement generally exhibits lower stiffness and brittle-elastic behaviour. These properties raise the question of whether conventional methods for the design and analysis of deep beams require modifications, and whether new approaches can offer improved predictions of the shear behaviour of beams with FRP reinforcement. This paper will discuss a new approach for evaluating the shear strength of FRP-reinforced deep beams without shear reinforcement. This approach is an extension of a two-parameter kinematic theory (2PKT) for steel-reinforced deep beams (Mihaylov et. al 2013, Mihaylov 2015). The 2PKT is based on a simple kinematic description of the deformations patterns of diagonally-cracked members, and also includes equilibrium equations and constitutive relationships for the mechanisms of shear resistance across the critical shear cracks. Since the 2PKT is based on first principles, it should be possible to extend it to FRP-reinforced members without significant modifications. To identify the necessary modifications and to validate the model, results from previous experimental studies will be used.
2
Behaviour of deep beams with FRP reinforcement
The behaviour of deep beams with FRP reinforcement will be demonstrated with the help of two tests performed by Farghaly and Benmokrane (2013). The beams had a rectangular cross section and were
subjected to symmetrical four-point bending over a span of 3 m. The effective depth of the beams d
was approximately 1090 mm and the shear-span-to-depth ratio a/d was 1.14. The beams had no shear reinforcement and differed only in terms of their bottom flexural reinforcement. Specimen C12N3 had 12#3 carbon fiber reinforced polymer bars while C12N4 had 12#4 bars of the same material. The #3 bars had a modulus of elasticity of 120000 MPa and a breaking stress of 1596 MPa, while for the #4 bars these values were 144000 MPa and 1899 MPa, respectively.
Figure 1 shows the shear force vs. midspan deflection response of specimens C12N3 and C12N4 together with the crack diagrams of the beams at shear failure. The two specimens behaved very similarly even though they exhibited significantly different shear strengths. The initial response was linear until the propagation of the first flexural cracks in the pure-bending region between the applied loads. Further loading caused the propagation of more flexural and flexural-shear cracks in the two symmetrical shear spans, and the stiffness of the beam decreased gradually. The last major cracks propagated from the inner edge of the supports towards the loading points across the shear spans (diagonal shear cracks). Following the propagation of these cracks, the beams were able to sustain a load increment of about one third of the load at diagonal cracking. The diagonal cracks widened and eventually a shear failure occurred along one of these cracks with crushing of the concrete in the vicinity of the point load. Qualitatively, this behaviour is very similar to the behaviour of steel-reinforced deep beams described in many experimental studies (i.e. Mihaylov et al. 2010).
The difference between steel-reinforced and FRP-reinforced deep beams is demonstrated in Fig. 2. Figure 2a shows the longitudinal strains measured along the CFRP bars of specimens C12N3 and C12N4 at failure. It can be seen that for both specimens these strains were almost constant from support to support as characteristic of arch action in deep beams. Specimen C12N3 failed at a maximum strain of about 6.8x10⁻³ and specimen C12N4 failed at about 4.4x10⁻³. These strains
significantly exceed the yield strain of typical steel reinforcement εy ≈ 2x10⁻³. Figure 2b shows that as
the strain in the test specimens increased by about 55%, the measured shear strength decreased by about 26%. This significant reduction in strength is indeed caused by the strains in the flexural reinforcement. The larger the strains are, the wider are the critical diagonal cracks, and the smaller is the capacity of the cracks to transfer shear through aggregate interlock. The two-parameter kinematic theory (2PKT), originally developed for members with steel reinforcement, accounts explicitly for the width of the cracks and the shear resisted by aggregate interlock, and therefore it has the potential to capture the shear behaviour of FRP-reinforced deep beams. Test results will be used to verify whether other shear mechanisms are also affected by the large strains in FRP reinforcement.
a) Load-displacement response b) Crack diagrams at shear failure
Fig. 1 Behaviour of specimens C12N3 and C12N4 (adapted from Farghaly and Benmokrane, 2013) 0 100 200 300 400 500 600 700 800 900 0 2 4 6 8 10 12 Sh e ar fo rc e V, kN Deflection Δ, mm C12N4 C12N3 first shear cracking flexural cracking shear failure V V C12N3 C12N4
a) Reinforcement strains at failure b) Effect of reinforcement strains on shear strength
Fig. 2 Strain effect (adapted from Farghaly and Benmokrane, 2013)
3
Two-parameter kinematic theory
The two-parameter kinematic theory is built on a simple kinematic description of the crack and deformation patterns of deep beams (Mihaylov et al., 2013). As shown in Fig. 3a, the critical diagonal crack is approximated with a straight line extending from the inner edge of the support to the loading point. The concrete block above this crack is assumed uncracked and rigid, while the concrete below the crack is marked by a series of radial flexure-shear cracks. The struts between these cracks are also assumed rigid and form a “fan” of struts pinned at the loading point and connected to the bottom reinforcement. The rigid block above the critical crack rotates with respect to the vertical section at the load, and translates vertically with respect to the fan. These assumptions form the basis of a kinematic model with two degrees of freedom (DOFs) which describes the entire displacement field of the critical shear span. The geometrical properties of the model are defined in Fig. 3b while the displacement field is given by Eq. 4-7 in Fig. 3c. The two degrees of freedom are the average strain along the flexural reinforcement, εt,avg, and the vertical displacement Δc in the critical loading zone
(CLZ) where the concrete crushes at failure.
(a) Deformation patterns and DOFs (b) Geometry
Effective width of loading plate
(1) 𝑙𝑏1𝑒= (𝑉/𝑃)𝑙𝑏1 Angle of critical crack
(2) 𝛼1= 𝛼 ≥ 35°
𝛼 = angle of line connecting inner end of lb2 to outer end of lb1e
Distance between kinks in bottom reinforcement (3) 𝑙𝑘= 𝑙0+ 𝑑(cot 𝛼 − cot 𝛼1) 𝑙0= 1.5(ℎ − 𝑑) cot 𝛼1≥ 𝑠𝑐𝑟 𝑠𝑐𝑟=0.28𝑑𝜌 𝑏 𝑙 2.5(ℎ−𝑑) 𝑑 (c) Deformations Displacement field • below critical crack
(4) 𝛿𝑥= 𝜀𝑡,𝑎𝑣𝑔𝑥
(5) 𝛿𝑧= 𝜀𝑡,𝑎𝑣𝑔𝑥2
ℎ−𝑧 • above critical crack
(6) 𝛿𝑥= 𝜀𝑡,𝑎𝑣𝑔𝑙𝑡 𝑑 (ℎ − 𝑧) (7) 𝛿𝑧= 𝜀𝑡,𝑎𝑣𝑔𝑙𝑡 𝑑 𝑥 + ∆𝑐 Crack width (8) 𝑤 = 0.75𝜀𝑡,𝑎𝑣𝑔2sin 𝛼𝑙𝑘 1+ ∆𝑐cos 𝛼1
Note: The additional equations required for members with stirrups are omitted for the sake of brevity.
Fig. 3 Kinematic model for deep beams under single curvature – members without stirrups 0 1 2 3 4 5 6 7 8 -1.5 -1 -0.5 0 0.5 1 1.5 Str ai n in fl e x. r e in f. , x10 -3
Distance from midspan, m C12N3 C12N4 support support 0 100 200 300 400 500 600 700 800 900 0 2 4 6 8 Sh e ar st re n gth Vex p , k N
Maximum strain in flex. reinf., x10-3
C12N3
steel- FRP- reinforced deep beams C12N4 c t DOFt,avg DOFc c b2 l x z c a+ t,avg x z h V P b1e l b1 l CLZ 1 d w cr s b d t l rigid k l =l0 w s
Degree of freedom Δc is obtained based on the assumption that the CLZ is at failure under diagonal
compressive stresses. Taking also into account simplifying assumptions about the geometry of the CLZ, the following expression for Δc has been proposed:
∆c= 0.0105lb1ecot α (9)
where lb1e is the effective width of the loading plate and is the angle of the line connecting the inner
edge of the support to the outer end of lb1e, see Fig. 3.
Degree of freedom εt,avg is used to express the shear farce in the member based on the moment
equilibrium of the shear span:
V = ErArεt,avg(0.9d)/a (10)
where Er is the modulus of elasticity of the flexural reinforcement, Ar is the cross-sectional are of the
reinforcement, (0.9d) is the approximate lever arm of the internal forces in the section with maximum moment, and a is the shear span. This shear force can be viewed as a demand on the shear span for a given strain εt,avg. At shear failure of the beam, the shear demand must be equal to the shear resistance
across the critical diagonal crack. In the 2PKT the shear resistance is expressed as a sum of four components: shear resistance provided by the critical loading zone, VCLZ, aggregate interlock along the
critical diagonal crack, Vci, transverse reinforcement crossing the crack, Vs, and dowel action of the
flexural reinforcement, Vd. Since this paper focuses on members without shear reinforcement,
component Vs is zero. In addition, since the dowel action is typically relatively small compared to
components VCLZ and Vci, component Vd will also be neglected. This is a reasonable simplification
considering also that FRP bars are significantly more flexible than steel bars. The remaining two shear components are expressed as follows:
VCLZ= 1.43𝑘(fc′)0.8lb1eb sin2α (11) Vci= 0.18√fc′ 0.31 +a24w g+ 16 bd (12)
where k is a crack shape factor given by:
0 ≤ k = 1 − 2(cot α − 2) ≤ 1 (13)
It can be seen from these equations that VCLZ is not a function of the DOFs of the kinematic model,
while Vci depends on Δc and εt,avg via the width of the critical diagonal crack w. The crack width is
derived from the kinematic model in Fig. 3 – see Eq. 8. According to Eq. 8 and 11, the larger are DOFs Δc and εt,avg, the wider is the critical diagonal crack, and the weaker is the aggregate interlock
shear strength component.
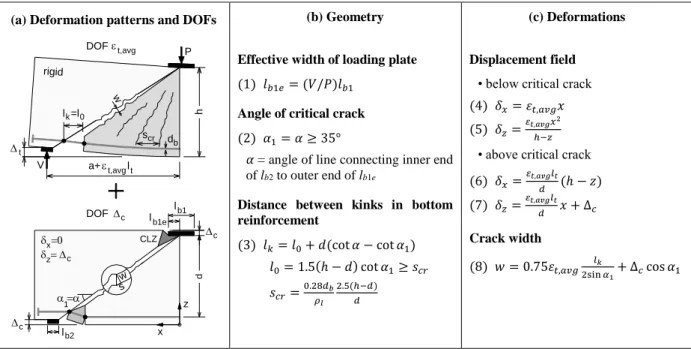
To demonstrate how the above equations can be solved, the 2PKT approach will be first applied without modifications to specimen C12N3. The solution is presented in a graphical form in Fig. 4. On the horizontal axis of the plot is DOF εt,avg and on the vertical axis are the shear forces. DOF Δc is
calculated from Eq. 9 and equals 1.37 mm. The thick black line shows the shear force derived from the moment equilibrium of the shear span (Eq. 10) which increases linearly due to the linear behaviour of the flexural reinforcement. The thick red line, on the other hand, represents the shear resistance along the critical diagonal crack which equals the sum of shear components VCLZ and Vci from Eq. 11 and
12. These components are also plotted in the figure with thin lines. As the shear forces must be in equilibrium, the solution of the 2PKT equations lies at the intersection of the thick black and red lines. This intersection can be found by using the bisection method or simply by a trial-and-error procedure with respect to strain εt,avg. For specimen C12N3 the intersection corresponds to εt,avg of 9.91x10⁻³ – a
bars however would remain elastic under this strain as they had a breaking strain of about 13x10-3. The
shear corresponding to εt,avg of 9.91x10⁻³ is the 2PKT shear strength prediction Vpred=749 kN. This
prediction significantly exceeds the measured shear strength of specimen C12N3 Vexp=596 kN which
is shown with a horizontal dashed line in Fig. 4. The shear strength experimental-to-predicted ratio Vexp/Vpred is 596/749=0.79.
To understand this unconservative prediction, it is necessary to analyze the two components of shear resistance VCLZ and Vci in Fig. 4. It can be seen that component Vci decreases with increasing strains in
the flexural reinforcement as a result of the widening of the critical diagonal crack. Since this component accounts explicitly for the effect of large strains in FRP-reinforcement, it can be disregarded as a main source of error. Therefore, the focus of the following section will be on the shear behaviour of the CLZs in deep beams with FRP reinforcement, which in the original 2PKT approach is independent of DOF εt,avg.
Fig. 4 Solution of the 2PKT equations – specimen C12N3
4
Modification of shear component V
CLZThe weakening of the CLZ with increasing flexural strains can be explained with two phenomena. First, large strains εt,avg are associated with large rotations of the rigid block above the critical crack as
evident from Fig. 3a. These rotations are likely to cause additional damage to the CLZ, and therefore reduce its capacity to carry shear. Second, large strains and rotations also result in wide diagonal cracks and less aggregate interlocking in the cracks. If the aggregate interlock stresses are zero, the thrust line in the rigid block will be straight and almost aligned with the critical diagonal crack. This will cause tension at the top of the rigid block and premature failure of the CLZ due to cracking along its top edge. Such premature failures have been reported in experimental studies of FRP-reinforced deep beams (Andermatt and Lubell, 2013). If however the cracks are narrow and the aggregate interlock is significant, certain tension will be transferred across the critical diagonal crack. This tension will deviate the thrust line upwards and the CLZ will be less susceptible to failure due to cracking at the top of the beam.
These hypotheses will be used to propose modifications to the original expression for the shear carried by the critical loading zone. For this purpose it is of interest to evaluate shear component VCLZ by
using test results. Table 1 summarizes the properties of 18 FRP-reinforced deep beams tested to failure as part of 3 experimental studies (Andermatt and Lubell 2013, Farghaly and Benmokrane 2013, Mohamed et al. 2014). The effective depth of the beams d varied from 257 mm to 1111 mm and the
0 200 400 600 800 1000 1200 0 2 4 6 8 10 12 V, kN εt,avg, x10-3 "capacity" VCLZ+Vci Vci VCLZ Vexp Vpred
shear-span-to-depth ratio a/d from 1.07 to 2.07. The beams had no shear reinforcement while the ratio of the longitudinal reinforcement ρl varied from 0.26% to 2.13%. The minimum modulus of elasticity
of the longitudinal reinforcement was Er=38000 MPa and the maximum modulus was 144000 MPa.
To evaluate VCLZ for each of the tests, it is first necessary to evaluate the two DOFs of the kinematic
model. DOF εt,avg is obtained from Eq. 10 by substituting the shear force V with the measured shear
resistance Vexp. As DOF Δc is not directly measured in tests and is not expressed with the shear force,
it is calculated from Eq. 9 as before. With these values of the DOFs of the kinematic model, shear component Vci is obtained from Eq. 12, and VCLZ is calculated by subtracting Vci from Vexp. Finally,
Eq. 11 is used to calculate factor k for each of the tests in the database. If the 2PKT is used with these
k-factors, it will produce shear strength predictions equal to the shear strengths measured in the tests.
Table 1
Tests of deep beams with FRP reinforcement
Test Beam a/d b d h Er ρl fu fc' Rep. Vexp Vpred Exp/Pred
series name (mm) (mm) (mm) (GPa) (%) (MPa) (MPa) mode (kN) (kN) -
1 A1N 1.07 310 257 306 41.1 1.49 709 40.2 F 407 309 - A2N 1.44 310 261 310 41.1 1.47 709 45.4 S 236 209 1.13 A3N 2.02 310 261 310 41.1 1.47 709 41.3 S 122 118 1.03 A4H 2.02 310 261 310 41.1 1.47 709 64.6 S 96 132 0.73 B1N 1.08 300 503 608 37.9 1.70 765 40.5 F 637 596 - B2N 1.48 300 501 606 37.9 1.71 765 39.9 S 400 366 1.09 B3N 2.07 300 502 607 37.9 1.71 765 41.2 S 216 211 1.02 B4N 1.48 300 496 606 41.1 2.13 709 40.7 S 415 434 0.96 B5H 1.48 300 497 607 41.1 2.12 709 66.4 S 531 504 1.05 B6H 2.06 300 505 610 37.9 1.70 765 68.5 S 188 242 0.78 C1N 1.10 301 889 1003 42.3 1.58 938 51.6 S 1135 1030 1.10 C2N 1.49 304 891 1005 42.3 1.56 938 50.7 S 662 627 1.06 2 G8N6 1.14 300 1097 1200 47.6 0.69 790 49.3 S 724 609 1.19 G8N8 1.15 300 1088 1200 51.9 1.24 750 49.3 S 953 811 1.18 C12N3 1.13 300 1111 1200 120.0 0.26 1596 38.7 S 596 543 1.10 C12N4 1.13 300 1106 1200 144.0 0.46 1899 38.7 S 801 754 1.06 3 G8-8 1.13 300 1106 1200 66.4 1.22 1000 37.0 S 1344 890 1.51 G8-8H 1.13 300 1106 1200 66.4 1.22 1000 44.6 S 1266 964 1.31 Avg.= 1.08 COV= 16.4%
Test series: 1 - Andermatt and Lubell (2013), 2 - Farghaly and Benmokrane (2013), 3 - Mohamed et al. (2014)
Notations: a = shear span; d = effective depth; b = section width; h = total section depth; Er = modulus of elasticity of FRP
flexural reinforcement; ρl = ratio of flexural reinforcement; fu = strength of flexural reinforcement; fc’ = concrete cylinder
strength; Rep. mode = reported failure mode - F for flexure and S for shear; Vexp = measured shear strength; Vpred = 2PKT
predicted shear strength; Exp/Pred = Vexp/Vpred.
The obtained values of factor k are plotted in Fig. 5 as a function of the rotation of the rigid block θblock. The rotation is expressed from the kinematic model as follows:
𝜃𝑏𝑙𝑜𝑐𝑘= 𝜀𝑡,𝑎𝑣𝑔cot 𝛼 (14)
where DOF εt,avg is calculated from the experimental data as explained earlier. The plot shows a clear
results. It can be seen that k decreases significantly with increasing θblock. The scatter of the results is
devoted in part to the approximate nature of the equations of the 2PKT, and in part to natural variations in the material and geometrical properties of the beams. As shown elsewhere (Mihaylov et al. 2010, Mihaylov 2015), random variations in the path of the critical diagonal cracks can have a very significant influence on the shear behaviour of the critical loading zones. This is particularly valid for beams without web reinforcement such as the test specimens used in this study. The CLZ behaviour is also affected by other factors such as the way the load is introduced on the beam – via steel plates, columns, or other.
Fig. 5 Effect of rigid block rotations on the shear resistance of the critical loading zone In the original 2PKT approach factor k is expressed with cot 𝛼 and accounts for the shape of the critical cracks – see Eq. 13. Based on the results presented in Fig. 5, it is suggested to modify this factor to also account for the strains in the flexural reinforcement by using the rotation of the rigid block 𝜀𝑡,𝑎𝑣𝑔cot 𝛼 as a governing parameter. The following expression is proposed to approximate the
trend indicated by the data points in Fig. 5:
𝑘 = 1.5
1 + (200𝜀𝑡,𝑎𝑣𝑔cot 𝛼)2
≤ 1.0 (15)
where the upper limit of 1.0 allows the modified 2PKT approach to transition to the original approach for steel-reinforced deep beams when the rotations of the rigid block are small. This expression is plotted in Fig. 5 with a continuous line.
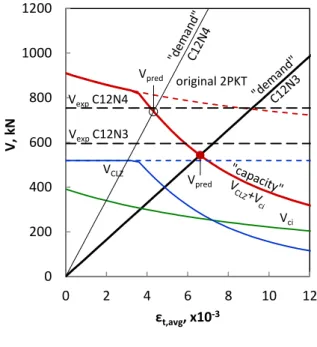
The 2PKT with the modified k-factor is applied to specimen C12N3. Figure 6 shows the solution of the 2PKT equations in the same format as shown earlier in Fig. 4. The only difference with the original 2PKT approach is shear component VCLZ which is not constant, but decreases with increasing
flexural strains when εt,avg exceeds approx. 4x10⁻³. As before, the shear strength prediction is defined
by the intersection of the black demand line and the red capacity line. It can be seen that the modified
k-factor results in a significantly improved shear strength prediction for specimen C12N3. The experimental-to-predicted ratio is Vexp/Vpred=596/543=1.10 as compared to 0.79 obtained with the
original k-factor. The plot also shows the prediction for specimen C12N4 which had 12#4 bars as compared to 12#3 for C12N3. While the red capacity curve remains the same as for specimen C12N3, the demand curve is steeper due to the larger stiffness of the flexural reinforcement. As a result, the two curves intersect at a smaller strain and а larger shear force. The obtained experimental-to-predicted ratio for specimen C12N4 is Vexp/Vpred=801/754=1.06.
Finally, the last column of Table 1 lists the shear strength experimental-to-predicted ratios for all tests used in this study. As shown at the bottom of the column, the average value of these ratios is 1.08 and the coefficient of variation (COV) is 16.4%.
0.0 0.2 0.4 0.6 0.8 1.0 1.2 1.4 1.6 0.000 0.005 0.010 0.015 0.020 Fa ct or k
Rigid block rotation θblock, rad
Fig. 6 Solution of the modified 2PKT equations – specimen C12N3
5
Effect of test variables on the shear strength
The tests in Table 1 and the 2PKT approach can be used to study the effect of different variables on the shear strength of FRP-reinforced deep beams. Figure 7a is generated based on the properties of specimens G8N6, G8N8, C12N3 and C12N4, and shows the effect of reinforcement stiffness. Specimens G8N6 and G8N8 had glass FRP reinforcement with a modulus of elasticity of about 49800 MPa while specimens C12N3 and C12N4 had carbon FRP bars with Er ≈ 132000 MPa. To account for
the different moduli of elasticity and amounts of reinforcement, the horizontal axis of the plot is the product of Er and the reinforcement ratio ρl. It can be seen that as Erρl is doubled, the measured shear
strengths increase by about 33%. The continuous red line in the plot shows that the 2PKT approach captures well this trend. It is predicted that the increase of shear strength is a result of the increase of both shear components VCLZ and Vci.Larger reinforcement stiffness is predicted to result in smaller
rotations of the rigid block and narrower diagonal cracks, which in turn results in stronger CLZ and aggregate interlock shear mechanisms.
Figure 7b shows the effects of the shear-span-to-depth ratio a/d and effective depth d studied in the test program by Andermatt and Lubell (2013). The test specimens were subjected to symmetrical four-point bending similarly to the beams tested by Farghaly and Benmokrane (2013). Three sets of beams with d of 206 mm, 502 mm and 890 mm were tested, and the a/d ratio within each set was varied by changing the span of the beam. It can be seen from the experimental points at d=502 mm that the shear strength decreased about three times as a/d was increased from about 1.1 to about 2.1. It can also be seen that these trends are adequately captured by the 2PKT approach. As can be expected, specimens with a deeper section had larger shear strengths. If the shear strengths are plotted in terms of average shear stress at failure v=V/bd, the three sets of experimental points and prediction lines become almost overlapping. This result can be interpreted as evidence that deep beams do not exhibit size effect in shear. However, since not all beam dimensions were scaled equally, these tests do not allow for a strong conclusion in this regard.
0 200 400 600 800 1000 1200 0 2 4 6 8 10 12 V, kN εt,avg, x10-3 original 2PKT Vci VCLZ VexpC12N4 Vpred Vpred VexpC12N3
a) Effect of reinforcement stiffness b) Effect of a/d ratio and depth d
Fig. 7 Effect of test variables on the shear strength of FRP-reinforced deep beams
6
Conclusions
This paper presented a kinematic-based approach for evaluating the shear strength of deep beams with FRP flexural reinforcement. The approach is an extension of a two-parameter kinematic theory (2PKT) for deep beams with steel reinforcement. The following conclusions were reached by applying the 2PKT approach to 18 tests from the literature:
1) Large strains in FRP flexural reinforcement reduce the shear capacity VCLZ of the critical
loading zones of deep beams.
2) This effect can be captured reasonably well by introducing a reduction factor for VCLZ as a
function of the rotation of the rigid block above the critical diagonal crack. An empirical expression for the reduction factor was proposed.
3) With this factor, the extended 2PKT produced shear strength experimental-to-predicted ratios with an average of 1.08 and a COV of 16.4%.
4) It was shown with the help of individual tests series that the 2PKT approach captured well the effect of reinforcement stiffness, a/d ratio, and section depth of the shear strength of FRP-reinforced deep beams.
5) Further research is necessary to develop a rational model for shear carried in the critical loading zones of FRP-reinforced deep beams.
References
Andermatt, M. F., and Lubell, A. S. (2013). “Behavior of concrete deep beams reinforced with internal fiber-reinforced polymer – Experimental study.” ACI Struct. J., 110(4), 585-594.
Farghaly, A., and Benmokrane, B. (2013). “Shear behavior of FRP-reinforced concrete deep beams without web reinforcement." ASCE J. Compos. Constr., 17(6), 04013015 1-15.
Mihaylov, B. I., Bentz, E. C., and Collins, M. P. (2013). “Two-parameter kinematic theory for shear behavior of deep beams.” ACI Struct. J., 110(3), 447-456.
Mihaylov, B. I., Hunt B., Bentz E. C., and Collins, M. P. (2015). “Three-parameter kinematic theory for shear behavior of continuous deep beams.” ACI Struct. J., 112(1), 47-57.
Mihaylov, B. I., Bentz, E. C., and Collins, M. P. (2010). “Behavior of large deep beams subjected to monotonic and reversed cyclic shear.” ACI Struct. J., 107(6), 726-734.
Mihaylov, B.I. (2015). “Five-spring model for complete shear behaviour of deep beams.” fib Struct. 0.00 0.01 0.02 0.03 0.04 0.05 0.06 0.07 0.0 0.2 0.4 0.6 0.8 1.0 V/ b d .fc ' Er.ρl, GPa vci vCLZ vpred C12N3 G8N6 C12N4 G8N8 0 200 400 600 800 1000 1200 1400 1.0 1.2 1.4 1.6 1.8 2.0 2.2 V, kN a/d A1N d=206 mm A2N A3N B1N B2N B3N C1N C2N d=502 mm d=890 mm 2PKT predictions
Conc., 16(1), 71-83.
Mohamed, K., Farghaly, A. S., and Benmokrane, B. (2014). “Effect of web reinforcement in FRP-reinforced deep beams.” The 7th International Conference on FRP Composites in Civil Engineering, International Institute for FRP in Construction, Vancouver, Canada.