Developing Countries and the Global Dairy Sector Part I Global Overview
58
0
0
Full text
(2) TABLE OF CONTENTS Preface............................................................................................................... iii Abbreviations ........................................................................................................ 4 Executive summary ................................................................................................. 5 Dairy production.................................................................................................. 5 Dairy consumption ............................................................................................... 5 The dairy industry................................................................................................ 6 Dairy trade ........................................................................................................ 6 Dairy policies ..................................................................................................... 7 International standards for dairy products................................................................... 7 Conclusion ......................................................................................................... 7 1. Introduction ....................................................................................................... 1 2. Dairy production.................................................................................................. 2 3. Dairy consumption ..............................................................................................14 4. The dairy industry...............................................................................................18 5. Dairy trade .......................................................................................................20 5.1 Exports .......................................................................................................22 5.2 Imports .......................................................................................................28 5.3 World market price ........................................................................................32 6. Domestic dairy policies.........................................................................................34 7. Dairy trade policies .............................................................................................36 8. Applied policy measures .......................................................................................38 9. International standards for dairy products..................................................................41 10. Conclusion ......................................................................................................43 References...........................................................................................................44 Annex.................................................................................................................48. Figures Figure 1: Figure 2: Figure 3: Figure 4: Figure 5: Figure 6: Figure 7: Figure 8: Figure 9: Figure 10: Figure 11: Figure 12: Figure 13: Figure 14: Figure 15: Figure 16: Figure 17: Figure 18:. World milk production* per capita, 1980-2004 ................................................. 3 Production trends for selected products in developing countries, 1980-2004 ............ 4 Cost of milk production and milk prices 2002 .................................................. 6 World milk production 1980-2003 ................................................................ 7 Trends in milk production for the six biggest producers, 1980-2003 ....................... 8 Trends in skim milk powder production for the six biggest producers, 1980-2004 ....... 9 Trends in whole milk powder production for the six biggest producers, 1980-2004 ....10 Trends in butter production for the six biggest producers, 1980-2003....................11 Trends in cheese production for the six biggest producers, 1980-2003 ...................12 Share of developing countries in world milk production, 1980-2003 ......................13 Milk production indexes for developed and developing countries, 1980-2003 ...........13 Trends in milk consumption (skimmed and whole) in developing and developed countries, 1980-2002 ..............................................................................14 Trends in liquid milk consumption by region, 1980-2002....................................15 Consumption indexes by region, 1980-2002 ...................................................15 Dairy consumption profile per capita by region...............................................17 Top-20 companies by dairy turnover (2003) ...................................................19 Destination of world milk production, 1980-2002 ............................................20 Trends in global milk equivalent exports, 1980-2002 ........................................21. i.
(3) Table of Contents. Figure 19: Figure 20: Figure 21: Figure 22: Figure 23: Figure 24: Figure 25: Figure 26: Figure 27: Figure 28: Figure 29: Figure 30:. Trends in dry milk exports for the six biggest exporters, 1980-2002 ......................23 The four biggest milk powder exporters .......................................................24 Trends in butter export for the four biggest exporters, 1980-2002........................25 The four biggest butter exporting countries...................................................25 Trends in cheese exports for the six biggest exporters, 1980-2002........................26 The six biggest cheese exporting countries....................................................26 Food aid in dairy products to developing countries, 1980-2002 ............................28 Trends in dairy imports of developing countries..............................................29 Developing countries’ dairy imports as share of domestic supply, 1980-2002 ...........30 Dairy trade (in milk equivalents) by region, 2001-2003 (3-year-average) ................31 Trends in milk imports for the major importing countries, 1980-2002....................32 World market price trends for major dairy products, 1995-2005 ..........................33. Tables Table 1: Table 2: Table 3: Table 4:. Average yield per cow in different feeding systems (kg/cow/year)........................ 5 Producer Subsidy Equivalents for Milk (as percentage of value of gross farm receipts) 38 Export subsidy expenditures for different dairy products by country 1995-2001........39 Applied tariff rates by product of some of the major dairy importing countries........40. ii.
(4) PREFACE This is the 30th of a series of Working Papers prepared for the Pro-Poor Livestock Policy Initiative (PPLPI). The purpose of these papers is to explore issues related to livestock development in the context of poverty alleviation. Livestock is vital to the economies of many developing countries. Animals are a source of food, more specifically protein for human diets, income, employment and possibly foreign exchange. For low income producers, livestock can serve as a store of wealth, provide draught power and organic fertiliser for crop production and a means of transport. Consumption of livestock and livestock products in developing countries, though starting from a low base, is growing rapidly. This paper is the first part of a study on the impacts of global dairy trade on developing countries, giving an overview of global dairy production, consumption, industry structure, trade, policies and standards. In the second part of the study, the dairy sectors of six developing countries (Bangladesh, Jamaica, Peru, Senegal, Tanzania and Thailand) are analyzed in order to identify the impacts of (subsidized) milk powder imports on milk producers and consumers. We hope this paper will provide useful information to its readers and any feedback is welcome by the author, PPLPI and the Livestock Information, Sector Analysis and Policy Branch (AGAL) of the Food and Agriculture Organization (FAO).. Disclaimer The designations employed and the presentation of material in this publication do not imply the expression of any opinion whatsoever on the part of the Food and Agriculture Organization of the United Nations concerning the legal status of any country, territory, city or area or its authorities or concerning the delimitations of its frontiers or boundaries. The opinions expressed are solely those of the author(s) and do not constitute in any way the official position of the FAO.. Author Vivien Knips has been a consultant to the FAO Pro-Poor Livestock Policy Initiative and is now working in the Economic Analysis and Development Policy Unit of the World Food Programme. Email: [email protected]. Acknowledgements I would like to thank Joachim Otte for continuous discussions and supervision as well as David K. Leonard, Torsten Hemme, A.M. Prins and Saule Kazybayeva for their comments on earlier drafts.. Keywords Global dairy sector, dairy production, dairy consumption, dairy trade, dairy industry, market protection, subsidies, international standards Date of publication: 1 December 2005.. For more information visit the PPLPI website at: http://www.fao.org/ag/pplpi.html or contact: Joachim Otte - Programme Coordinator of the Pro-Poor Livestock Policy Facility Email: [email protected] Tel: +39 06 57053634 Fax: +39 06 57055749 Food and Agriculture Organization - Animal Production and Health Division Viale delle Terme di Caracalla 00100 Rome, Italy. iii.
(5) ABBREVIATIONS EBA. Everything But Arms. EU. European Union. FAO. Food and Agriculture Organisation of the United Nations. GDP. gross domestic product. HACCP. Hazard Analysis Critical Control Point. IPPC. International Plant Protection Convention. LDC. least developed country. MT. Metric tonnes. OECD. Organisation for Economic Co-operation and Development. OIE. World Organisation for Animal Health. PSE. producer subsidy equivalent. QTY. quantity. SMP. skim milk powder. SPS. sanitary and phyto-sanitary. TBT. Technical Barriers to Trade. TRQ. tariff rate quota. URAA. Uruguay Round Agreement on Agriculture. US. United States. USAID. United States Agency for International Development. USSR. Union of Soviet Socialist Republics. WFP. World Food Programme. WHO. World Health Organisation. WMP. whole milk powder. WTO. World Trade Organisation. ZMP. Zentrale Markt- und Preisberichtstelle. 4.
(6) EXECUTIVE SUMMARY Globally, the dairy sector is probably one of the most distorted agricultural sectors: producer subsidies are in place in many developed countries, encouraging surplus production, export subsidies are paid by governments to place the excess production on the world markets, and tariff and non-tariff barriers are erected both by developed and developing countries to protect their dairy sector from ‘unfair’ competition. These market distortions are having significant and different impacts on producers and consumers in developing and developed countries, which are however extremely difficult to quantify. Oxfam, in a recent paper, claims that Europe’s dairy regime is devastating livelihoods in the developing world, giving Kenya, Dominican Republic and Jamaica as examples where the livelihoods of “thousands of poor small-scale farmers have been destroyed by imports of cheap subsidized EU dairy products”.. Dairy Production Milk has certain features that distinguish it from other agricultural products and shape its production, processing and trade. As opposed to grains, milk is a bulky and heavy commodity which requires high-cost storage and transportation as it spoils quickly without cooling. Due to the fact that even the largest dairy farms cannot provide adequate quantities to supply a processing plant, but each single dairy farm only supplies a small share of the total milk processed, the dairy industries in many countries are organised along co-operative lines. Milk producer co-operatives bundle the interest and supply of a large number of dairy farmers and strengthen their bargaining power towards processors or even run their own processing plants. Over the last 24 years, total world milk production has increased by 32 percent, whereas per capita world milk production has declined by nine percent which indicates that world milk production has not kept pace with the increase in world population. The decline in global milk production per capita can be attributed to falling production in the developed countries whereas per capita milk production in the developing countries has slightly risen over the last 24 years. As opposed to the trend towards intensification of milk production in developed countries, production growth in developing countries is to a large part due to increasing numbers of milk animals (and dairy farms) and only to a small part due to productivity gains.. Dairy Consumption Total milk consumption in developed countries stayed more or less constant over the last twenty years, while significant increases in global milk consumption are due to population growth and per capita income growth in developing countries (see Figure 12). The latter has led to the emergence of an affluent middle-class in many low and middle income countries in Southeast Asia, Latin America and Central and Eastern Europe. Additional “westernization” trends leading to increasing preferences for new value-added products in many of these economies generate additional dairy market growth. The composition of dairy product consumption varies across different regions with liquid milk as the overall most important product by volume. However, processed dairy products become more important with increasing incomes and living standards, and in developed countries the trend goes more and more towards high value. 5.
(7) Executive Summary. functional foods that require considerable research investments and sophisticated processing.. The Dairy Industry Dairy companies all over the world face a number of changes and challenges which are forcing them to reconsider their strategies. The most important challenges are a growing demand for dairy products, with world demand growing by 2 percent a year or a quantity equal to the entire annual production of Australia, coupled with concerns about the milk supply growing at a slower pace than demand. Furthermore, dairy companies face an increasing number of consumer requirements in combination with increasing customer power. Food retailers, the foodservice industry and the food processing industry are the key customers for dairy products. The leading companies in this sector tend to be significantly larger than the players in the dairy industry and the on-going global consolidation process is further increasing their market power. Consequently, the concentration process by means of mergers, acquisitions and strategic alliances in the dairy industry has been very pronounced and is expected to continue. As demand in dairy products is not rising at equal rates all over the world but hardly at all in developed and strongly in some developing regions the challenges dairy companies face vary depending on the market they operate in. Companies operating in the big but mature dairy markets of Europe and the US face limited market growth opportunities in volume terms as per capita consumption levels are among the highest in the world and growth can only occur by increasing market shares or switching to higher value-added products. Due to these limited market opportunities in developed countries, multinational dairy companies are often attracted by strong growth markets in developing countries. To benefit from the growth of their own domestic markets, local companies will have to raise product quality and efficiency to be able to withstand foreign competition.. Dairy Trade The dairy sector is highly localised, as milk is a bulky and perishable product, and dairy products are mostly consumed in the country or region where they are produced. Only a small fraction of global production is traded internationally. Despite the technological developments in refrigeration and transportation only 7 percent of the milk produced is traded internationally if intra-EU trade is excluded. Trade in dairy products is very volatile, as dairy trade flows can be affected by (a) overall economic a situation in a country, (b) fluctuations in supply and demand, (c) changing exchange rates and (d) political measures. Additional volatility is introduced by the fact that the global dairy market is extremely concentrated in terms of buyers and sellers; hence, supply or demand shocks are not easily absorbed. With demand for dairy products most rapidly rising in regions that are not selfsufficient in milk production, volumes of dairy trade are growing. Also the share of global dairy production that is traded will increase as trade will grow at a faster pace than milk production. Since 1990, a shift in world dairy exports from high export subsidizing countries, e.g. EU and US towards non-subsidizing countries, e.g. New Zealand and Australia has been taking place. The developed countries account for 62 percent of the world’s dairy imports (measured in milk equivalents) and 93 percent of the exports, showing clearly that the major part of the global dairy trade takes place among developed countries.. 6.
(8) Executive Summary. Dairy Policies In many, and predominantly in developed countries, the dairy market is one of the most heavily regulated agricultural markets. Government interventions in the domestic dairy market are most commonly aimed at controlling quantities of production, establishing minimum prices and guaranteeing farmers’ incomes. Frequently, governments also intervene through public purchases and storage of oversupply or apply policies to foster dairy consumption. In countries where domestic prices for dairy products are supported well above world market prices, as a consequence, the domestic market has to be protected against foreign competition in order to ensure the market outlet for domestic farmers who would otherwise have difficulties to sell their overpriced products. The major policies countries put in place to limit imports are tariffs and tariff rate quotas (TRQs) and other non-tariff barriers. Globally dairy products are among the agricultural commodities with the highest tariff protection with an average protection level of over 80 percent (the average over all agricultural commodities being 62 percent). The most important measure promoting exports are export subsidies. Under the WTO Agreement on Agriculture, countries that used export subsidies on agricultural products were required to set commitment levels on the volume and value of export subsidies that could be provided. The most significant user of export subsidies on dairy is the European Union, accounting for over 80 percent of the total value of export subsidies on dairy granted during the period 1995-2001. Over the same period values of export subsidies have been reduced considerably, and in the case of the EU, subsidies for dairy exports in 2001 were only slightly more than 40 percent of those in 1995.. International Standards for Dairy Products Though standards were initially developed by the public sector to reduce transaction costs and ensure product quality and safety they have become a strategic instrument of competition of differentiated product markets. Especially in developing countries, but not exclusively there, it can be very difficult for farmers to meet private standards for milk quality and safety which might require investment in mechanical milking, on farm cooling, new feeds and genetic improvement. Apart from the initial investment cost a dairy farmer faces to meet those standards, also high operating costs might render small and even medium-scale units unprofitable in the long run.. Conclusion Different developments are occurring in the global dairy sector at the moment: Production in developed countries is falling (together with the number of dairy cows and farms), while productivity is rising. Simultaneously milk production in developing countries is growing strongly and numbers of cows are increasing. This development is mirrored in consumption. Dairy consumption levels in developed countries are constant or falling, whereas in many developing countries, foremost in East and Southeast Asia and driven by population growth and growing per capita incomes, dairy consumption is rapidly increasing. With consumer demand in developing countries rising faster than domestic production, global dairy trade volumes are increasing as well with import demand of developing countries being the major driver. OECD dairy policies mainly result in a financial transfer from consumers in OECD countries to producer and processors. Actually, some benefits of the OECD dairy policies, through the depressed world market prices to which they lead, probably also 7.
(9) Executive Summary. accrue to consumers in developing countries in terms of increased supply of dairy products predominantly in urban centres – especially considering that many developing countries are not expected to be self-sufficient in dairy production in the future and therefore will have to import increasing amounts of dairy products. However, the artificially low world market price for dairy products, and here especially milk powder, might have negative impacts on dairy farmers in developing countries who have to compete on their local markets with imported milk powder. The extent to which this is the case will be examined in detail in a companion paper by means of dairy sector country studies for Bangladesh, Jamaica, Peru, Senegal, Tanzania and Thailand.. 8.
(10) 1. INTRODUCTION Globally, the dairy sector is probably one of the most distorted agricultural sectors: producer subsidies are in place in many developed countries, encouraging surplus production, export subsidies are paid by governments to place the excess production on the world markets, and tariff and non-tariff barriers are erected both by developed and developing countries to protect their dairy sector from ‘unfair’ competition. For example, the EU alone spends around Euro 16 billion a year in support of its dairy industry, dairy farmers in the US are estimated to receive a producer subsidy equivalent of 48 percent and Mexico applies tariffs of over 100 percent on a variety of dairy products. These market distortions are having significant and different impacts on producers and consumers in developing and developed countries, which are however extremely difficult to quantify. Although there is consensus that a reduction of OECD dairy subsidies would lead to an increase in the world market price for milk, estimates of the size of that price increase vary widely and, given the complexities of the global dairy sector, disagreement exists about who would draw most benefit from a higher world market price and who would be the losers. Oxfam, in a recent paper, claims that Europe’s dairy regime is devastating livelihoods in the developing world, giving Kenya, Dominican Republic and Jamaica as examples where the livelihoods of “thousands of poor small-scale farmers have been destroyed by imports of cheap subsidized EU dairy products”. However, the evidence supporting this claim is rather anecdotal and the paper fails to take into account the costcompetitiveness of local producers vis-à-vis non-subsidized imports and it does not consider dairy market differentiation, market structure nor requirements of the processing sector. Given the importance of milk production as an activity that supports the livelihoods of millions of small-scale farmers in the developing world, the prima facie negative effect of the current policy regimes supporting dairy production in developed countries on producers in developing countries, and the attention directed towards subsidies and their impacts in WTO trade negotiations, further research in this area appears warranted. This study consists of two companion papers which will attempt to contribute to a better understanding of the impact of long and short term dumping of dairy products (mainly milk powder) by the EU, US and other major producers on the welfare of small-scale dairy producers and consumers in developing countries. The first paper (Part I) provides an overview of the global dairy sector, its development trends over the past twenty years and the main international dairy trade flows as background information and overall context. The specific question shall be addressed in Part II using a case study approach of selected countries (Thailand, Bangladesh, Tanzania, Senegal, Peru and Jamaica), for which a detailed analysis of the dairy sector will be carried out. The above countries have been chosen because they have high dairy import bills, because there have been claims of damage done by dumping and because they reflect a wide spread of cultural, agro-ecological and socio-economic circumstances. It is hoped that the general overview and the case study evidence will allow to draw some general conclusions about the role of dairy product dumping in the array of constraints small-scale producers face when attempting to participate in national and international dairy markets and, on the other hand, the possible welfare gains of consumers through reduced prices for dairy products.. 1.
(11) 2. DAIRY PRODUCTION Milk has certain features that distinguish it from other agricultural products and shape its production, processing and trade. As opposed to grains, milk is a bulky and heavy commodity. Liquid milk contains 87 percent of water and 13 percent of solids such as fats, proteins, lactose, minerals, vitamins and enzymes. Milk is also highly perishable and starts to deteriorate as soon as it leaves the udder. It requires high-cost storage and transportation as it spoils quickly without cooling. Finally, milk has a high nutritional value, especially for the diet of children, hardly faces cultural taboos, but is potentially subject to adulteration. Milk is a very valuable and at the same time extremely expensive raw material that can be used to make a wide range of high-value products, as a result the processing industry is very important to the dairy farming sector. The vast majority of dairy farmers are small-scale producers, with a weak and vulnerable position in the market due to their low level of production and need to market milk daily. Dairy farming involves a high percentage of fixed costs with adjustments to changing markets only possible gradually. On the other hand, milk provides a regular source of income and the production is highly labour-intensive. Due to the fact that even the largest dairy farms cannot provide adequate quantities to supply a processing plant, but each single dairy farm only supplies a small share of the total milk processed, the dairy industries in many countries are organised along co-operative lines. Milk producer co-operatives bundle the interest and supply of a large number of dairy farmers and strengthen their bargaining power towards processors or even run their own processing plants. Furthermore, co-operatives can guarantee farmers the purchase of their daily production. Even in developed countries, co-operatives still hold strong positions in milk processing with producer cooperatives (such as Dairy Farmers of America (DFA) or Fonterra) marketing the major share of milk from farms. The dairy sector plays an economically important part in the agriculture sector in most industrialized and also many developing countries. In most OECD countries milk production generates more than 20 percent of farm cash receipts (Meilke and Larivière, 1999). Over the last 24 years, total world milk production has increased by 32 percent from 466 million tonnes in 1980 to 613 million tonnes in 2004, whereas per capita world milk production has declined from 105 kg per capita per year in 1980 to 96 kg per capita per year in 2004 – a decline of nine percent. These figures indicate that world milk production has not kept pace with the increase in world population. The decline in global milk production per capita can be attributed to falling production in the developed countries whereas per capita milk production in the developing countries has slightly risen over the last 24 years (see Figure 1).. 2.
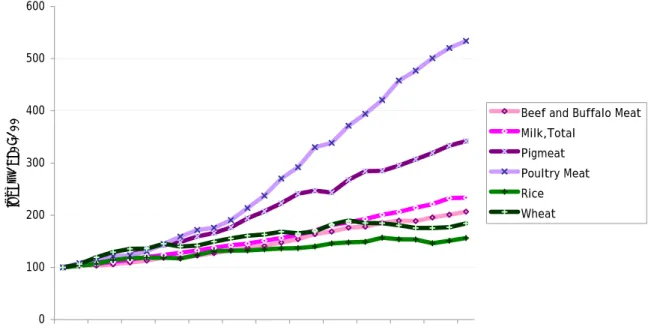
(12) 2. Dairy Production. Figure 1:. World milk production* per capita, 1980-2004. 350 300. kg/person/year. 250 200 150 100 50 0 1980. 1982. 1984. 1986. 1988. 1990. Developing Countries Milk per cap kg/person/year. 1992. 1994. 1996. 1998. 2000. 2002. 2004. Developed Countries Milk per cap kg/person/year. World Milk per cap kg/person/year. * Total milk production: Cow 84%, buffalo 12%, sheep 1%, goat 2%, camel 0.2% Source: FAOSTAT. In other livestock sub-sectors developing countries managed to achieve much higher output growth rates: pork and poultry meat production increased by 81 percent and 187 percent respectively over the same period. However, beef and buffalo meat production increased only by 30 percent and increases in cereal production were still lower (see Figure 2).. 3.
(13) 2. Dairy Production. Figure 2:. Production trends for selected products in developing countries, 1980-2004. 600. 500. Index 1980=100. 400. Beef and Buffalo Meat Milk,Total Pigmeat. 300. Poultry Meat Rice Wheat. 200. 100. 0 1980 1982 1984 1986 1988 1990 1992 1994 1996 1998 2000 2002 2004. Source: FAOSTAT. Natural resources (climate, length of forage growing season, soil fertility and availability of land) have a significant impact on the development and evolution of dairy systems. Grassland-based systems, like those in New Zealand, Australia and Argentina, with the possibility of year-round grazing allow for low-input, low-cost production with large dairy herds and relatively lower milk yields per cow. Land shortage or a short forage-growing season lead to more cereal-based systems with high-input, high-cost production in which dairy herds are relatively small. The most intensive production systems are in place in Israel, the US and Japan with very high yields per cow. Production in the EU and Switzerland is somewhat less intensive with lower yields and Australia can be seen as an intermediate case between the two feeding systems. Despite the fact that the major part of world milk production originates from these two systems, globally crop-residue based milk production is the most prevalent system. It is a minimum input and cost production system with the lowest milk yields per cow, compared to the other two systems (see Table 1), due to low feed quality. Crop-residue based milk production is practised in regions lacking pasture area where intensive cereal based production is not affordable to farmers, as it is the case in many developing countries. Milk production, especially if grassland or crop-residue based, tends to be highly seasonal due to the biology of the animals themselves and the plants they are fed on. Due to the high perishability of milk, seasonal production leads to storage problems. Moreover, farmers receive varying prices for milk throughout the year depending on seasonal supply. While in developed countries refrigeration, ease of transportation and processing, growing international trade, and husbandry practises reducing seasonality of production have largely solved these problems, in developing countries they persist and often constitute a major obstacle to the development of the dairy sector.. 4.
(14) 2. Dairy Production. Average yield per cow in different feeding systems (kg/cow/year). Table 1:. Feedbase. cereal based. grassland based. crop-residue based. Country. 20001. 20032. Israel. 10,715. ... US. 8,256. 8,500. Japan. 7,390. ... EU 15. 5,926. 5,920. Switzerland. 5,450. ... Australia. 5,146*. 4,630. Argentina. 3,842. 3,950. New Zealand. 3,700. 3,730. ... 1,000. India. * litre/year Sources: 1ZMP 2004, 2IDFA 2004. Costs of milk production and domestic prices for milk in the major milk producing countries are shown in Figure 3. While the countries with grassland-based production systems can be found in the lower cost range, with Argentina having the lowest production costs of 9 USD per 100 kg milk, cereal-based systems are found at the upper end of the cost range. Among the depicted countries only Pakistan, Argentina, Brazil, New Zealand and Australia have production costs at or below the world market price.. 5.
(15) 2. Dairy Production. Figure 3:. Cost of milk production and milk prices 2002. 80. Milk price level. Range: Cost of milk production only,. USD / 100 kg milk ECM*. 70 0 60 50 40 30 20 World market price level. 10. New Zealand. Australia. Brazil. Argentina. Bangladesh. Pakistan. India. EU-Acces.. EU-15. USA. Israel. Canada. Norway. Switzerland. 0. Source: Hemme et al. (2003), IFCN Dairy Report 2003 * ECM: Energy corrected milk 4% fat 3.3% protein. In developed countries nearly all the milk produced on farms is delivered to dairies (for the EU the share was 95 percent in 2003 according to ZMP). The major processed products include: liquid milk, cheese, fermented products, processed skim milk for casein, butter, condensed milk, skim milk powder (SMP) and whole milk powder (WMP). In regions that are more than self-sufficient in milk, such as the EU, butter and SMP are residuals of total milk supplies. When all other milk requirements (mainly for higher value products such as cheese, fresh products and WMP) are satisfied, the remainder is processed into butter and SMP for storage. Production volumes are therefore strongly linked to the supply and demand conditions of high-value dairy products. Thus, fluctuations in cheese production are a major determinant of butter production. Consequently, the interdependence in production can result in dairy markets moving in different directions. For instance in the case of butter, owing to this ‘residual’ function, production is very volatile and so are world markets and prices of butter (Rabobank, 2004b; OECD, 2002). Recombination of milk used to be seen as a means for deficit milk producing countries with deficient cold chains to feed malnourished populations and for surplus producers to dispose of milk powder. However, advances in technology and expanding markets in developing countries are leading to a change in the recombined dairy products sector,. 6.
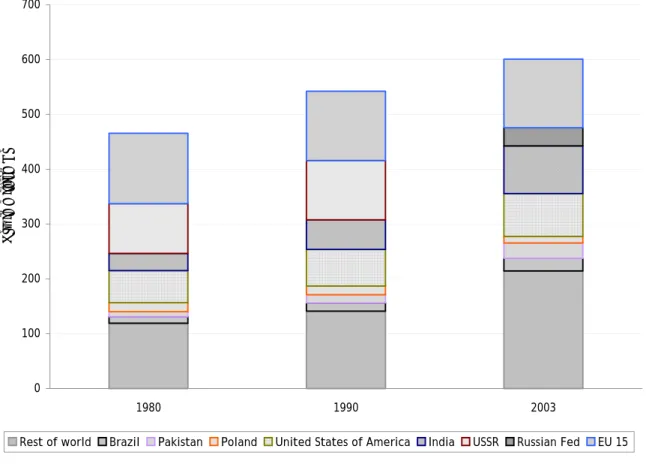
(16) 2. Dairy Production. creating high-value end products that increasingly require new ingredients. Rather than only using SMP as may have been the case in the past, such products may also be composed of milk protein concentrates, whey protein concentrates, whey protein isolates, lactoferrin, dairy peptides and dozens of other dairy fractions (US Dairy Export Council, 2004). In 2003 the most important milk producers were the EU 15, followed by India as the world’s single largest milk producing country, the US, the Russian Federation, Pakistan and Brazil. Most of the major producers increased milk production between 1980 and 2003, with the most notable increase in production of 176 percent in India. As opposed to this trend, milk production in the EU dropped slightly while the falling apart of the USSR resulted in a strong output reduction of milk during the transformation period and a continuing fall in production in the Russian Federation (see Figures 4 and 5). Whereas the biggest six producers accounted for 57 percent of global milk production in 1980 by 2003 their share in global production had risen to 63 percent (despite the strong reduction in output by the former USSR).. Figure 4:. World milk production 1980-2003. 700. 600. Qty in million Mt. 500. 400. 300. 200. 100. 0 1980 Rest of world. Brazil. Pakistan. 1990 Poland. United States of America. 2003 India. USSR. Russian Fed. EU 15. Source: FAOSTAT. Expected future trends in world dairy production include an increase in world milk production by 12.8 percent over the next decade, with more than 70 percent of the gains due to rising productivity per cow. One-third of the 58.9 million tonnes increase in milk production is expected to occur in the Americas and over 44 percent in Asia, primarily China and India (FAPRI, 2004).. 7.
(17) 2. Dairy Production. In the developed countries the general trend in milk production continues to go towards increasing intensification. A smaller number of dairy farmers with increasing herd sizes - but overall falling numbers of dairy cows – produce increasing quantities of milk per cow (ZMP, 2004). Figure 5:. Trends in milk production for the six biggest producers, 1980-2003. 160. 140. Qty in million Mt. 120. 100. 80. 60. 40. 20. 0 1980. 1985. 1990. 1995. 2000. EU 15. India. United States of America. USSR (from 1992 'Former area of'). Pakistan. Brazil. Russian Federation. Source: FAOSTAT. Production trends in processed milk products in many instances show quite different trends from those in raw milk or from each other. In the case of SMP the EU, who is the biggest global producer, has cut SMP production by 66 percent from a peak of 2.8 million tonnes in 1983 to 0.96 million tonnes in 2004. Over the same period raw milk production in the EU declined only slightly. The output reduction of raw milk during the transformation period of the USSR is also mirrored in the production levels of SMP that have fallen since 1992 and continued to do so for the Russian Federation (see Figure 6). For the other important SMP producers, production levels have risen over the last 24 years. Most markedly is the increase in production in New Zealand and Australia where SMP production increase by factors of 2.3 and 4.4 respectively whereas production increases in the US and Japan are far less dramatic.. 8.
(18) 2. Dairy Production. Figure 6:. Trends in skim milk powder production for the six biggest producers, 1980-2004. 3. 2.5. Qty in million Mt. 2. 1.5. 1. 0.5. 0 1980. 1982. 1984. 1986. 1988. 1990. 1992. 1994. 1996. 1998. 2000. European Union (15). US. New Zealand. Russian Federation. Australia. Japan. 2002. 2004. USSR (from 1992 'former area of'. Source: FAOSTAT. As opposed the trend in SMP production, the EU’s WMP production stayed more or less at the same level between 1980 and 2004 with production peaks in the late 1980s and early 1990s. Similar to the trend in SMP production, WMP production in the other major production countries increased with the most pronounced increase by a factor of 7.2 for New Zealand (see Figure 7). Excluding the EU, skim milk powder production is expected to grow in most countries, increasing a total of 10.2 percent over the next ten years. Production of WMP is expected to rise by 22.2 percent, with the greatest gains occurring in China, Brazil, New Zealand and Argentina. WMP production for these four countries is expected to grow 36.8 percent, 37.7 percent, 18 percent and 61.4 percent respectively (FAPRI 2004).. 9.
(19) 2. Dairy Production. Figure 7:. Trends in whole milk powder production for the six biggest producers, 1980-2004. 1 0.9 0.8. Qty in million Mt. 0.7 0.6 0.5 0.4 0.3 0.2 0.1 0 1980. 1982. 1984. 1986. 1988. 1990. 1992. 1994. 1996. 1998. European Union (15). New Zealand. Brazil. Australia. Argentina. Mexico. 2000. 2002. 2004. USSR (from 1992 'Former area of'. Source: FAOSTAT. The EU 15 has been the world’s largest butter producer over the last two decades, though production has declined from a peak of 2.8 million tonnes in 1983 to 1.8 million tonnes in 2003. Also the USSR, the second biggest butter producer till the beginning of the 1990s, experienced a strong reduction in butter production and Poland’s butter production declined as well. Butter production in the US remained more or less constant since 1980 while production in Australia and New Zealand has risen slightly with New Zealand becoming the world’s third biggest butter producer in the late 1990s (see Figure 8). While the six biggest butter producers accounted for the production of 85 percent of the global butter production in 1980, this share fell to 71 percent in 2003. Global butter production is expected to increase by 11.2 percent over the next decade, with India, Australia, New Zealand, and Russia accounting for the bulk of the growth. EU butter production is expected to decline by 200,000 tonnes (FAPRI 2004).. 10.
(20) 2. Dairy Production. Figure 8:. Trends in butter production for the six biggest producers, 1980-2003 T r e nd s fo r the 6 b ig g e st b ut te r p r o d uc e rs. 3. Qty in million Mt. 2.5. 2. 1.5. 1. 0.5. 0 1980. 1982. 1984. 1986. 1988. 1990. EU 15 New Zealand Poland USSR (from 1992 'former area of'). 1992. 1994. 1996. 1998. 2000. 2002. USA Russian Federation Australia. Source: FAOSTAT. The EU 15 is by far the biggest cheese producer in the world. Cheese production in the EU rose from 4.3 million tonnes to 7.1 million tonnes in 2003. A similar growth trend can be observed for the US, the world’s second biggest cheese producer. The fall in production that can be observed for the USSR in the other dairy products is also observable for cheese (see Figure 9). The market share of the six biggest cheese producers remained constant at 78 percent between 1980 and 2003. Total cheese production is expected to grow by 12.3 percent, with production in the US, Argentina and New Zealand increasing 1.4 percent, 3.6 percent and 2.8 percent annually, respectively (FAPRI 2004).. 11.
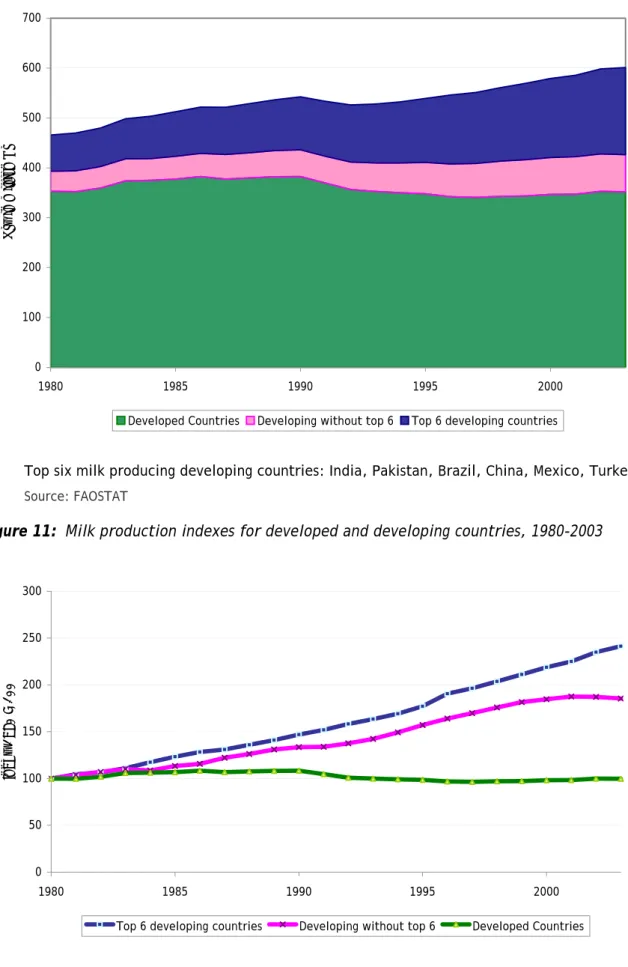
(21) 2. Dairy Production. Figure 9:. Trends in cheese production for the six biggest producers, 1980-2003. 8 7. Qty in million Mt. 6 5 4 3 2 1 0 1980. 1985. 1990. 1995. EU 15. USA. Poland. Russia. Egypt. Argentina. 2000. USSR (from 1992 'former area of'). Source: FAOSTAT. The developing countries can be divided into traditional milk producing regions, namely the Mediterranean countries, the Middle East, the Indian subcontinent, the Savannah regions of Western Africa and the highlands of Eastern Africa as well as South and Central America, whereas the majority of the countries in humid regions, such as Southeast Asia, China and Korea count among the non-traditional milkproducing countries. While dairy production in the developed countries has remained constant or even declined over the past twenty years, milk production in developing countries has increased sharply with a large share (approximately two thirds) accounted for by the top six milk producing developing countries: India, Pakistan, Brazil, China, Mexico and Turkey (see Figures 10 and 11). As opposed to the trend towards intensification of milk production in developed countries, production growth in developing countries is to a large part due to increasing numbers of milk animals (and dairy farms) and only to a small part due to productivity gains (Hemme, 2003; FAOSTAT).. 12.
(22) 2. Dairy Production. Figure 10: Share of developing countries in world milk production, 1980-2003. 700. 600. Qty in million Mt. 500. 400. 300. 200. 100. 0 1980. 1985 Developed Countries. 1990 Developing without top 6. 1995. 2000. Top 6 developing countries. Top six milk producing developing countries: India, Pakistan, Brazil, China, Mexico, Turkey Source: FAOSTAT. Figure 11: Milk production indexes for developed and developing countries, 1980-2003. 300. Index 1980 = 100. 250. 200. 150. 100. 50. 0 1980. 1985 Top 6 developing countries. 1990. 1995. Developing without top 6. 2000 Developed Countries. Source: FAOSTAT. 13.
(23) 3. DAIRY CONSUMPTION Total milk consumption in developed countries stayed more or less constant over the last twenty years, while significant increases in global milk consumption are due to population growth and per capita income growth in developing countries (see Figure 12). The latter has led to the emergence of an affluent middle-class in many low and middle income countries in Southeast Asia, Latin America and Central and Eastern Europe. Additional “westernization” trends leading to increasing preferences for new value-added products in many of these economies generate additional dairy market growth. Figure 12: Trends in milk consumption (skimmed and whole) in developing and developed countries, 1980-2002. 400 350. Qty in million Mt. 300 250 200 150 100 50 0 1980. 1985. 1990 Developed Countries. 1995. 2000. Developing Countries. Source: FAOSTAT. The decline in average global per capita milk consumption since 1980 demonstrates that increasing milk demand was driven to a large part by population growth. Indeed, only in South and Southeast Asia, the regions that exhibited the strongest growth in milk consumption over the past twenty years (see Figure 13) has the increase in per capita consumption had a greater effect than population growth (IFCN, 2004). Latin America and the Caribbean as well as North Africa show lesser increases in per capita consumption and in sub-Saharan Africa and the Near East per capita consumption has even fallen between 1980 and 2002 (see Figure 14). While this decline of consumption in sub-Saharan Africa can be attributed to strong population growth without increases in per capita income, the fall of per capita consumption in the Near East is hard to explain.. 14.
(24) 3. Dairy Consumption. Figure 13: Trends in liquid milk consumption by region, 1980-2002. 100 90 80. Qty in million Mt. 70 60 50 40 30 20 10 0 1980. 1985. 1990. 1995. Africa South of Sahara. East & South East Asia. South Asia. Near East & North Africa. 2000. Latin Amer & Caribbean. Source: FAOSTAT. Figure 14: Consumption indexes by region, 1980-2002. 300. CINS base 1980=100. 250. 200. 150. 100. 50 1980. 1985 Africa South of Sahara. 1990 East & South East Asia. 1995 Latin Amer & Caribbean. South Asia. 2000 Near East & North Africa. Source: FAOSTAT. 15.
(25) 3. Dairy Consumption. The composition of dairy product consumption varies across different regions with liquid milk as the overall most important product by volume (see Figure 15), however, processed dairy products become more important with increasing incomes and living standards, and in developed countries the trend goes more and more towards high value functional foods that require considerable research investments and sophisticated processing. Dairy consumption is generally increasing with rising per capita incomes, urbanization and Westernisation of diets. Consumers in developing countries with relatively low per capita incomes tend to have relatively high income elasticities of demand, meaning that with increasing disposable income they will increase their consumption of dairy products disproportionately and decrease their consumption of staple foods. On the other hand, with falling per capita incomes, consumers in developing countries tend to drastically reduce their dairy consumption. Opposed to this, consumers in developed countries have very low demand elasticities for food including dairy products and tend to spend only a very small fraction of an increased income on dairy products.1 Nevertheless, per capita income is not the sole factor influencing dairy consumption, also traditional dietary habits remain an important influence, which implies that nations with comparable per capita incomes might exhibit quite different dairy consumption levels. For instance, within the developed world, European consumption levels greatly exceed those in North America or Australasia, whereas Japanese dairy consumption remains comparatively low (Pritchard, 2001). Likewise traditional milk producing countries among the developing countries, such as Somalia, Sudan or India tend to have higher per capita dairy consumption levels than other developing countries with similar per capita incomes.. 1. Whereas the income elasticities of demand for dairy products are typically around 0.09 in developed countries in developing countries they often range between 0.50 and 1.00 (Dimaran and Mc Dougall, 2002).. 16.
(26) 3. Dairy Consumption. Figure 15: Dairy consumption profile per capita by region. 250. kg/person/year. 200. 150. 100. 50. 0 1980 2002 1980 2002 1980 2002 1980 2002 1980 2002 1980 2002 1980 2002 1980 2002 Developed Countries. Africa South North Africa of Sahara Milk, Whole. Near East. Butter, Ghee. East & South East Asia Cheese. Cream. China, Mainland Whey. South Asia. Latin Amer & Caribbean. Other. Source: FAOSTAT. 17.
(27) 4. THE DAIRY INDUSTRY Dairy farmers are highly dependent upon having a local processing facility to buy their product as milk rapidly deteriorates prior to processing. Traditionally, this has encouraged the development of co-operatives in the dairy sector. Co-operatives emerged worldwide in the dairy sector as an instrument to alleviate the vulnerability of dairy farmers and bundle resources. By pooling their supply and operating collectively owned dairy processing plants, dairy farmers were able to minimize their market risk. Though changes in technologies and transport have changed these patterns in many countries the dairy sector remains largely co-operatively organised with dairy co-operatives ranging from very small scale to globally acting businesses, and varying levels of co-operative-private capital mixes. Among the global top twenty dairy companies eight are - at least partially - co-operatively owned2(see Figure 16). Dairy companies all over the world face a number of changes and challenges which are forcing them to reconsider their strategies. The most important challenges are a growing demand for dairy products, with world demand growing by 2 percent a year or a quantity equal to the entire annual production of Australia, coupled with concerns about the milk supply growing at a slower pace than demand. Furthermore, dairy companies face an increasing number of consumer requirements in combination with increasing customer power. Food retailers, the foodservice industry and the food processing industry are the key customers for dairy products and the leading companies in this sector tend to be significantly larger than the players in the dairy industry and the on-going global consolidation process, further increasing their market power (Rabobank, 2001b). Growth is essential to most of the dairy companies’ strategic options. This is due to strong competition among these companies on markets with relatively low growth potential plus strong pressure from retailers. Companies that are unwilling or unable to grow and do not hold a strong position in a niche market run the risk of being overwhelmed by their competitors (Rabobank, 2001b). Consequently, the concentration process by means of mergers, acquisitions and strategic alliances in the dairy industry has been very pronounced and is expected to continue further. Already big companies are becoming even bigger, and the rate of expansion across national borders by mergers, joint ventures and co-operations has increased (Hetzner and Richarts, 2002). As demand in dairy products is not rising at equal rates all over the world but hardly at all in developed and strongly in some developing regions the challenges dairy companies face vary depending on the market they operate in. Companies operating in the big but mature dairy markets of Europe and the US are facing strong competition in branded products, growth in market shares of private label products, fierce competition amongst retail customers resulting in downward price pressure and demanding end consumers. Market growth opportunities in volume terms are quite limited because the per capita consumption levels are among the highest in the world and growth can only occur by increasing market shares or switching to higher valueadded products (Rabobank 2004b). Local companies operating in growth markets benefit from growing consumer demand for dairy products. In this situation growth opportunities are mainly determined by per capita income growth. However, market growth attracts foreign competition and the global trend towards market liberalisation leads to intensifying competition. To benefit from the growth of their own domestic markets, local companies will have to raise product quality and efficiency to be able to withstand foreign competition. 2. Dairy Farmers of America, Fonterra, Arla, Campina, Land O Lakes, Sodiaal, Humana and Nordmilch. 18.
(28) 4. The Dairy Industry. (Rabobank 2004b). However, entering developing countries’ markets is fraught with organisational challenges. A well organised supply structure is one of the crucial elements of a successful dairy business. In most emerging dairy countries, however, milk production is anything but well organised, and given their familiarity with the often chaotic situations, local companies have an important role to play in this part of the dairy chain (Rabobank 2004b). As a consequence, for entering developing countries’ markets multinational dairy companies such as Nestlé and Parmalat have followed a strategy of first buying or setting up joint-ventures with local firms and using commodity dairy products to generate cash and provide a distribution platform. With increasing incomes in these countries, multinationals push higher-value products through the same channels, build brand awareness for their products, and ultimately introduce a range of value-added products and set up their own network of contracted dairy farmers or co-operatives (Dobson and Wilcox, 2002; Gutman, 2002). Figure 16: Top-20 companies by dairy turnover (2003). Nestlé, CH Dean Foods, USA Dairy Farmers of Am., USA Arla Foods, DK/S/UK Danone, France Fonterra, New Zealand Parmalat, Italy Kraft Foods, USA Lactalis, France Unilever*, NL/UK Friesland Coberco, NL Meiji Dairies, Japan Bongrain, France Morinaga, Japan Campina, NL Land O'Lakes, USA Sodiaal, France Humana, Germany Schreiber Foods*, USA Nordmilch, Germany. 0. 2. 4. 6. 8. 10. 12. 14. 16. 18. billion USD. Source: Rabobank 2003. 19.
(29) 5. DAIRY TRADE The dairy sector is highly localised, as milk is a bulky and perishable product, and dairy products are mostly consumed in the country or region where they are produced. Only a fraction of global production is traded internationally. Despite the technological developments in refrigeration and transportation only 7 percent of the milk produced is traded internationally if intra-EU trade is excluded (see Figure 17). Figure 17: Destination of world milk production, 1980-2002. 700. 600. Million Mt. 500. 400. 300. 200. 100. 0 1986. 1988. 1990. 1992. Domestic use. 1994 Intra-EU trade. 1996. 1998. 2000. 2002. International trade. Source: FAOSTAT. The total volume of milk traded internationally increased from 42 million tonnes in 1980 to 73 million tonnes in 2003 while over the same period the value of traded milk increased from 13 billion USD to 27 billion USD (in constant 1995 dollars) (See Figure 18).. 20.
(30) 5. Dairy Trade. Figure 18: Trends in global milk equivalent exports, 1980-2002. 80. 35. 70. 30. Qty in million Mt. 25. 50 20 40 15 30 10. 20. Value in billion USD (const 1995). 60. 5. 10 0. 0 1980. 1985. 1990 Export volume. 1995. 2000. Export value. Source: FAOSTAT. One of the characteristics which makes the dairy sector and markets unique is the differentiation into non-tradable fluid (drinking milk) and tradable ‘manufacturing’ milk. Hence, trade is of different importance depending on the product (and its suitability for trade) with milk powders having the highest share of production that is traded. For WMP the share amounts to 50 percent of production, 30 percent of SMP, 10-15 percent of butter and retail packed condensed milks, 3 percent of yogurt and other fresh dairy products, less than 2 percent of retail packed cream and less than 0.5 of retail packed liquid milks is traded internationally (IDF 2000). Most dairy product trade, as measured in volume, is in bulk commodities. Butter, cheese and dry milk powders are the main traded items. These commodities accounted for over 80 percent of value of all dairy exports in 2003 (excluding intra-EU exports), according to FAO. However, a shift in dairy trade away from bulk products towards value-added products has been taking place over the last 15 years. Furthermore, disaggregated (FAO) trade data does not include casein, milk proteins and other milk components which are also gaining in importance in international dairy trade as milk processing techniques become more and more sophisticated, and as a way to circumvent the high tariffs levied on traditional dairy products. Trade in dairy products is very volatile, as dairy trade flows can be affected by (a) overall economic a situation in a country, (b) fluctuations in supply and demand, (c) changing exchange rates and (d) political measures. Additional volatility is introduced by the fact that the global dairy market is extremely concentrated in terms of buyers and sellers; hence, supply or demand shocks are not easily absorbed. Some regions in the world, such as East and Southeast Asia, Near East and North Africa as well as sub-Saharan Africa are not likely to ever attain self-sufficiency in dairy products, and those that are currently self-sufficient will rather loose this position in. 21.
(31) 5. Dairy Trade. the medium term as they will most likely not be able to increase production as fast as population and income growth would make necessary. Oceania, on the other hand, has built its entire dairy industry based on its export position. Changes in this landscape of global dairy trade are occurring slowly, driven to a large extent by political measures, such as progressing trade liberalisation, as well as by individual company ambitions (Rabobank, 2004a). Demand for dairy products in developing countries is strongly linked to the general economic situation. Most developing countries are net importers of dairy products because local production does not meet local demand. Economic growth boosts dairy demand, and generally increases the net-importing position. On the other hand, in a deteriorating economic situation, milk and dairy products are some of the first food items to be removed from the daily menu and import demand suffers accordingly (Rabobank, 2004b). In non-self-sufficient dairy nations the local milk supply is complemented with imported milk powders, both SMP and WMP. Processors use imported dairy ingredients because they are often price competitive compared to local supply, convenient, consistent in quality, constantly available and can be used to make almost every dairy product with the exception of natural cheese. When recombining SMP, vegetable fats and oils are frequently used to substitute for milk fat (Rabobank, 2004b). With demand for dairy products most rapidly rising in regions that are not selfsufficient in milk production, volumes of dairy trade are growing. Also the share of global dairy production that is traded will increase as trade will grow at a faster pace than milk production. The net-importing countries of Southeast Asia, China, Brazil and Russia will be especially big contributors to increased trade in the near future (Rabobank, 2001).. 5.1 Exports Growth in world dairy export markets depends to a large part on growth trends in regional and country GDP per capita. The world recession that followed the Asian crisis had sizeable impacts on key dairy export markets in the developed economies (EU, US, Japan) and developing economies especially Asian markets, Brazil and Mexico) (OECD, 2002). Export markets can be broadly divided into value-added versus low-value bulk commodity markets. Value-added products compete on quality and branding with established local and multinational processors and tend to be more income sensitive than bulk commodity markets. Trade in value-added products takes mostly place among developed countries. Competition on bulk commodity markets is predominantly on price with established low-cost exporters who have ‘first mover’ advantages such as established accounts, dependable supply and quality etc. Bulk products are predominantly exported from developed to developing countries (OECD, 2002). Since 1990, a shift in world dairy exports from high export subsidizing countries, e.g. EU and US towards non-subsidizing countries, e.g. New Zealand and Australia has been taking place. Whereas the EU and the US were the most important dry milk exporters in 1986, by 2002 exports had dropped considerably. Between 1990 and 2000 the EU’s share in world milk powder exports dropped from 51 percent to 29 percent. By 2002, New Zealand had become the biggest milk exporter followed by the EU and Australia, the US only ranking fifth behind Argentina (see Figures 19 and 20).. 22.
(32) 5. Dairy Trade. Figure 19: Trends in dry milk exports for the six biggest exporters, 1980-2002. 10 9. Qty in million Mt MEQs. 8 7 6 5 4 3 2 1 0 1986. 1991 New Zealand. EU (15) Excl.Intra-Trade. 1996 Australia. Argentina. 2001 United States of America. Poland. Source: FAOSTAT. Even though the share of the four biggest milk powder exporters dropped from 82 percent of global milk powder exports in 1990 to 73 percent by 2000, the global milk powder export market remains highly concentrated.3. 3 Note: Exports and imports are given as three year averages starting in 1986 as before trade data for the EU excluding intraEU trade are not available.. 23.
(33) 5. Dairy Trade. Figure 20: The four biggest milk powder exporters. 3. Qty in million Mt. 2.5. 2. 1.5. 1. 0.5. 0 1990 EU (15) Excl.Intra-Trade. 2000 New Zealand. Australia. United States of America. Others. Source: FAOSTAT. The EU and New Zealand the two biggest dairy exporters show remarkable differences in export orientation. Whereas the EU produces 23 percent of world milk and exports 10-15 percent of its total production, New Zealand produces only about 3 percent of the world’s total milk but exports more than 90 percent of its production. The world butter market is dominated by New Zealand which has replaced the EU in this position and in 2000 alone accounted for 40 percent of the world’s butter exports, followed by a share of 21 percent for the EU and 15 percent for Australia. The share of the four biggest butter exporters dropped from 85 percent of global butter exports in 1990 to 76 percent in 2000 (see Figures 21 and 22).. 24.
(34) 5. Dairy Trade. Figure 21: Trends in butter export for the four biggest exporters, 1980-2002. 4.5 4. Qty in million Mt. 3.5 3 2.5 2 1.5 1 0.5 0 1986. 1991 New Zealand. 1996. EU (15) Excl.Intra-Trade. Australia. 2001 United States of America. Source: FAOSTAT. Figure 22: The four biggest butter exporting countries. 0.9 0.8. Qty in million Mt. 0.7 0.6 0.5 0.4 0.3 0.2 0.1 0 1990. EU (15) Excl.Intra-Trade. 2000. New Zealand. Australia. United States of America. Rest. Source: FAOSTAT. The share of the six biggest cheese exporters in international cheese trade, counting among them the EU, New Zealand, Australia, Switzerland, the US an Poland, rose from 21 percent in 1990 to 33 percent in 2000. Currently, the EU is the world market leader for cheese, handling 34 percent of the global trade. However, Australia, New Zealand and also the US doubled their exports in the period between 1990 and 2000. Over the. 25.
(35) 5. Dairy Trade. same period the volume of cheese traded globally increased by 66 percent from 0.82 million tonnes to 1.36 million tonnes (see Figures 23 and 24). Figure 23: Trends in cheese exports for the six biggest exporters, 1980-2002. 2.5. Qty in million Mt. 2. 1.5. 1. 0.5. 0 1986. 1991. 1996. 2001. EU (15) Excl.Intra-Trade. New Zealand. Australia. United States of America. Switzerland. Poland. Source: FAOSTAT. Figure 24: The six biggest cheese exporting countries. 1.6 1.4. Qty in million Mt. 1.2 1 0.8 0.6 0.4 0.2 0 1990 EU (15) Excl.Intra-Trade. New Zealand. 2000 Australia. Switzerland. United States of America. Poland. Rest. Source: FAOSTAT. 26.
(36) 5. Dairy Trade. The amounts of dairy products distributed as food aid to developing countries, especially in the form of milk powder, have decreased strongly from a peak of 333,000 tonnes in 1984 to 56,000 tonnes in 2002 (see Figure 25). The same trend can be observed for the share of food aid in total dairy imports of developing countries (FAOSTAT). While food aid at among it dairy food aid was used as a major outlet for production surpluses by developed countries since the 1970s there has been a major policy shift away from the use of food aid as a conduit for surplus commodity disposal, towards its use in emergency operations and sustainable development programs. The policy shift followed the recognition that the large amounts of milk powder donations that had been given to developing countries during the 1970s and 1980s had in some cases hampered local dairy business growth and discouraged local milk production (Ferris-Morris, 2003). The now well documented experience of EU dairy food aid in countries as varied as China, India and a number of African countries, highlights the risk of disincentives at a sub-sectoral level. Such aid was invariably intended either to provide inputs to the local dairy processing industry or for monetisation and revenues were to be used to finance the development of dairy farming, especially by small-scale producers. However, ‘Operation Flood’ in India apart, dairy aid has hardly been associated with any substantial development of local dairy farming, least in small scale production. Often tensions have been severe between supplying urban demand, including middle and high income consumers and the service sector (hotels, public institutions, etc), supporting marketing and processing and promoting small-scale production. The record of poor performance and changed perceptions regarding public sector involvement in dairy processing and pricing has led to a progressive cutback in dairy aid over the past decade (Clay et al., 1998). A rethinking has also been taken place in the use of milk powder in emergency operations. Major organisations carrying out emergency food aid, such as WFP and USAID, state in their guidelines that dried milk powder must not be distributed to beneficiaries as part of a general dry ration. The reason given is that despite the potential nutritional value of dried milk products and their relative ease of use in emergency feeding activities, there is a danger of negative health effects when used improperly, e.g. its potential substitution for breast milk or the potential for inducing diarrhoeal and other diseases through microbial contamination where milk powder has been reconstituted with unclean water. These guidelines have also been widely adopted among other international organisations and NGOs active in food emergency environments (WFP, forthcoming; Ferris-Morris, 2003). With the rapid increase in humanitarian food aid flows and the reduction of program food aid flows, there has been an expansion in non-cereal food aid, with milk powder now being most currently used as an ingredient in ‘blended foods’ – usually cereals fortified with milk powder and micronutrients for use in supplementary feeding programs (Barrett, 2002).. 27.
(37) 5. Dairy Trade. Figure 25: Food aid in dairy products to developing countries, 1980-2002. 400 350. Qty in 1,000 Mt. 300 250 200 150 100 50 0 1980. 1985. Butteroil. 1990. 1995. 2000. Other Dairy. Skim milk evaporated. Source: WFP/FAOSTAT. 5.2 Imports Because many developing countries are not self-sufficient in dairy but are net importers of dairy products, the overall growth in demand has led to a strong increase in import volumes over the last twenty years (see Figure 26). At the same time, import dependency as measured as the share of net imports in total domestic supply has fallen for these countries from 10.7 percent in 1980 to 5.8 percent in 2002 (see Figure 27). Whereas milk production in developing countries has been rising 3.7 percent annually, between 1980 and 2003, imports grew ‘only’ by 1.9 percent per annum over the same period reducing import dependency for the group as a whole.. 28.
(38) 5. Dairy Trade. Figure 26: Trends in dairy imports of developing countries. 30. 25. Qty in million Mt MEQ. 20. 15. 10. 5. 0 1980. 1990 Dry Whole Milk. Dry Skim Milk. 2002 Other. Source: FAOSTAT. In terms of import expenditure, the share of dairy import expenditure, in total agricultural import expenditure of developing countries, has fallen from levels of around 7 percent in the 1980s to 5.4 percent in 2003 (FAOSTAT).. 29.
(39) 5. Dairy Trade. 12. 30. 10. 25. 8. 20. 6. 15. 4. 10. 2. 5. 0. 0 1980. 1985. 1990. 1995. Qty in million Mt. percent %. Figure 27: Developing countries’ dairy imports as share of domestic supply, 1980-2002. Dairy imports as % of supply Total dairy imports. 2000. Source: FAOSTAT. The developed countries account for 62 percent of the world’s dairy imports (measured in milk equivalents) and 93 percent of the exports, showing clearly that the major part of the global dairy trade takes place among developed countries. East and Southeast Asia account for 14 percent of global milk imports followed by the Near East and North Africa with 11 percent, Latin America and the Caribbean with 9 percent, sub-Saharan Africa with 3 percent and South Asia with 1 percent of global milk imports (see Figure 28). Dairy exports from developing countries are very low. Latin America contributes 3 percent to global exports, East and South East Asia for 2 percent, the Near East and North Africa for 1 and South Asia and sub-Saharan Africa each for 0.2 percent. The limited participation of South Asian countries in world dairy trade, despite the fact that milk production is very important in the region, can be partly explained by the fact that most countries in the region strive for self-sufficiency in food; hence, both imports and exports of dairy products are restricted by the government (Cox and Zhu, 2005). During the 1970s and 1980s sub-Saharan Africa received a large part of the imported dairy products as food aid. However, since then a significant proportion of food aid has been redirected to transition economies with the share of food aid in African imports dropping from approximately 40 percent in 1988 to less than 4 percent in 2003. On the other hand, the affordability of commercial imports of dairy products (without current export subsidies) is questionable for many African countries (Cox and Zhu, 2005).. 30.
(40) 5. Dairy Trade. Figure 28: Dairy trade (in milk equivalents) by region, 2001-2003 (3-year-average). 80 70. Qty in million Mt. 60 50 40 30 20 10 0 De. -10 -20. ve lo pe d. Af ric Co un tr ie. s. a. So u. Ne ar th. of. Sa. ha ra. Imports. Ea st &. Ea st & No rt. Exports. h. Af. So u So. ut h. ric a. Ea st. As ia. th. in cl. As ia. La tin. Am. er &. Ca ri b be an. Ch in a. Net exports. Source: FAOSTAT. Whole and skimmed milk powders account for about half of total dairy trade, and are almost exclusively imported by the developing and transition countries. Among the developing countries the single biggest milk powder importers are the oil exporting countries such as Mexico, Algeria, Venezuela, Malaysia, Saudi Arabia, (Brazil, China) and the fast growing economies in Southeast Asia such as Indonesia, Philippines and Thailand which dispose over the necessary foreign exchange earnings. Imports of most other developing countries are constrained by limited foreign exchange resources (see Figure 29). The highest growth in milk powder imports in recent years has been registered in South East Asia. In China, despite growth in domestic milk production, imports of milk powders have kept rising each year to meet domestic consumption, which has been rising by some 14 percent annually in the past few years. The Philippines, one of the world's major milk powder importers, continues to increase imports by some 10 percent each year. In Central America, Mexico has long imported large volumes of SMP through a parastatal importing company, to be distributed largely to its low income population. Other significant importers of milk powder are found in North Africa where income growth over the past few years has contributed to a higher demand (FAO, 2005). Figure 29 illustrates the aforementioned volatility in dairy trade. Most of the countries show big variations in year-to-year import quantities caused by exchange rate fluctuations, domestic economic performance, domestic milk production and the world market prices for milk powder. However, import volatility seems to be higher for countries with relatively higher domestic milk production and lower import dependency, such as Mexico and Brazil, whereas countries with high import dependency, such as the Philippines, Malaysia and Thailand, show less volatility in milk powder imports. 31.
(41) 5. Dairy Trade. Figure 29: Trends in milk imports for the major importing countries, 1980-2002. 3000. 3000. 2500 Qty in 1,000 Mt. Qty in 1,000 Mt. 2500 2000 1500 1000. 2000 1500 1000 500. 500. 0 1980. 0 1980. 1985. 1990. China. Indonesia. Philippines. Thailand. 1995. 1985. 1990. 1995. 2000. 2000 Malaysia. Algeria. Brazil. M exico. Saudi Arabia. Source: FAOSTAT. 5.3 World market price Due to heavy export subsidies, mainly by the EU and the US, world market prices for dairy products are kept artificially low. Domestic prices of most dairy products in the US and the countries of the EU are substantially (1.5 to 2 times) higher than the world market prices making them uncompetitive in the global markets without subsidies. A number of studies that have attempted to estimate the potential impact of a reduction in subsidized dairy exports found that world market prices for dairy would rise significantly4 if subsidies were cut (Donnellan and Westhoff, 2001; Shaw and Love, 2001; OECD, 2000; Larivière and Meilke, 1999). Though distortions have been reduced in the post-WTO period, the world market for dairy will continue to be affected by subsidised European products but the volumes will be much less. The reform of the EU dairy policy in 2003 resulted in lower intervention prices for butter and SMP and further reduced EU processors’ incentives to manufacture these products for the world market. International dairy prices have shown rising trends over the last couple of years (see Figure 30) and may regain momentum in the short term, especially if the lower export supplies from Oceania and the EU are not fully compensated by increasing supplies from the United States and South American exporters (FAO, 2005). Owing to the fact that there are relatively few trading nations present in the global dairy market, short-term price volatility is a characteristic feature of world trade in dairy products (European Commission, 2002).. 4. For example, Shaw and Love 2001 estimate that a halving of the maximum volume of subsidised dairy exports from the EU and US would lead to a rising of the world market price of SMP of 27 percent, the price of WMP would rise by 32 percent and the world cheese and butter prices by 16 and 14 percent respectively.. 32.
(42) 5. Dairy Trade. Figure 30: World market price trends for major dairy products, 1995-2005. 3,500. 3,000. current USD per Mt. 2,500. 2,000. 1,500. 1,000. 500. 0 1995. 1996. 1997. 1998 WMP. 1999 SMP. 2000. 2001. Butter. 2002. 2003. 2004. 2005. Cheddar cheese. Source: FAO CIWP. 33.
Figure


+7


Related documents