More lottery tickets than milk
and no money in the bank
Fayzan Bakhtiar
Supervisors: Professor Robert SlonimDr. Stephen Cheung
This thesis is submitted in partial fulfilment of the requirements for the degree of
Bachelor of Economics (Honours)
School of Economics
The University of Sydney
Statement of originality
I hereby declare that this submission is my own work and to the best of my knowl-edge it contains no materials previously published or written by another person, nor material which to a substantial extent has been accepted for the award of any other degree or diploma at the University of Sydney or at any other educational institution, except where due acknowledgement is made in the thesis.
Any contribution made to the research by others, with whom I have worked at the University of Sydney or elsewhere, is explicitly acknowledged in the thesis.
I also declare that the intellectual content of this thesis is the product of my own work, except to the extent that assistance from others in the project’s design and conception or in style, presentation and linguistic expression is acknowledged.
. . . .
Fayzan Bakhtiar Economics Honours IV
Abstract
A significant proportion of US households have insufficient savings to cope with even moderate consumption shocks that can result in substantial externalities. At the same time, the most financially fragile households have the highest level of lot-tery expenditure as a proportion of income. A product which exploits the demand for lottery tickets, a prize-linked savings account, could ‘nudge’ at-risk households to save more. Prize-linked savings accounts offer individuals a savings product with principal-security and the chance to win a lottery-type jackpot. Using an online experiment, this thesis finds that the introduction of prize-linked savings accounts significantly increases the total level of savings, and reduces lottery expenditures and current consumption. The results imply that the introduction of prize-linked savings is a plausible policy option to nudge savings in the right direction, and improve welfare.
Acknowledgements
I am grateful to my supervisors, Bob Slonim and Stephen Cheung, for their guid-ance, insightful comments and enthusiasm. I would also like to thank Andrew Lilley for innumerable helpful conversations and comments throughout the year. I am indebted to the friends who piloted the experiment for their constructive com-ments: Priyanka Goonetilleke, Tony Ghazavi, Dominic Reardon, Vivian Jiang, Hannah Ryan, Donna Zhou, and the awesome Lan Wei. I would also like to thank my sister, Shahbano Bakhtiar, for her good-natured assistance in programming the survey.
I acknowledge the helpful conversations with Kadir Atalay, Garry Barrett, Colin Cameron, Diane Dancer, Graham Loomes and Garth Tarr regarding the experi-mental design and econometric estimation techniques.
In particular, I would like to thank Jessica Morr and the Business School PASS team for their generous support, effectively allowing me to use their office as my own.
Finally, I would like to thank the Economics Honours IV 2011 cohort for making this year enjoyable and memorable, and my family for their love and support.
Contents
1 Introduction 1 2 Literature review 5 2.1 Prize-linked savings . . . 5 2.1.1 Overview . . . 5 2.1.2 Appeal . . . 52.1.3 Empirical studies of Premium Bonds . . . 7
2.1.4 A US field study . . . 8
2.2 The lottery ticket puzzle . . . 9
2.2.1 Probability weighting . . . 11 2.2.2 Skewness . . . 14 2.3 Welfare implications . . . 16 2.4 Summary . . . 18 3 Hypothesis 20 4 Design 22 4.1 Establishing an experimental framework . . . 23
4.2 Online subject panels . . . 24
4.2.1 Study Response . . . 25
4.2.2 MTurk . . . 26
4.2.3 Advantages and concerns . . . 27
4.2.4 Differing payment procedures . . . 28
4.3 The experiment . . . 29
4.3.1 Portfolio allocation in three stages . . . 30
4.3.2 Ensuring internal validity . . . 32
4.4 Descriptive statistics . . . 36
5 Results 38 5.1 Total savings analysis . . . 38
5.1.1 Fixed-effects estimation . . . 39
5.1.3 Analysis of savings available to subjects . . . 48
5.2 Sourcing PLS demand . . . 50
5.3 The dreaming premium . . . 52
5.4 Payment mechanisms and sample selection . . . 58
6 Discussion 59
7 Conclusion 63
A Descriptive Statistics 65
B Additional Results Tables 71
List of Figures
2.1 RDEU probability weighting function . . . 12
2.2 CPT value function . . . 13
2.3 Friedman-Savage utility function . . . 15
4.1 The Jackpot Index . . . 34
5.1 Mean total savings – before and after PLS introduction . . . 39
5.2 The dreaming premium – kernel density plot . . . 54
List of Tables
4.1 Lottery odds . . . 31
4.2 Experimental conditions after the introduction of the PLS . . . 33
4.3 Lottery expenditure behaviour . . . 36
4.4 Savings behaviour . . . 36
5.1 The effect of PLS introduction on total allocation to savings . . . . 42
5.2 Comparing MTurk and Study Response groups’ savings behaviour . 44 5.3 Analysis of demographics and savings behaviour . . . 46
5.4 The effect of PLS introduction on total savings available . . . 49
5.5 Effect of PLS introduction on portfolio allocations . . . 51
5.6 Subject characteristics and the dreaming premium . . . 55
5.7 Relationship between PLS participation and the dreaming premium 56 A.1 Summary of subject characteristics . . . 65
B.1 Comparing Study Response subgroups’ savings behaviour . . . 72
B.2 Effect of PLS introduction on portfolio allocations (OLS) . . . 73
B.3 Analysis of demographics and savings behaviour . . . 74
B.4 Analysis of demographics and the dreaming premium (all charac-teristics) . . . 77
1
Introduction
“How confident are you that you could come up with $2,000 if an un-expected need arose within the next month?”
Lusardi, Schneider and Tufano (2011) asked 2,148 US residents this question in an online survey. Half of respondents answered that they would be unable to come up with the money. Approximately two-thirds
indicated that they did not have $2000 in the form of savings.1
Unlikely events occur all the time. Sometimes they are good things, like finding a twenty dollar note on the street. Other times they are bad things, emergencies like a car’s transmission breaking down, or a child or spouse falling ill. Economic theory predicts that people, being generally risk-averse, would insure against uncertain, adverse outcomes. Insurance against these small, unexpected consumption shocks is most commonly expected to be found in the form of interest-bearing savings, which have the advantage of liquidity. The findings of Lusardi, Schneider and Tufano (2011), however, indicate that most Americans do not have $2000 safely
tucked away for a rainy day.2
At the same time, US households spend, on average, $540 per annum on lottery tickets, compared with $430 spent, on average, per annum on dairy products. This figure is relatively stable across income groups so that households with the lowest incomes spend, proportionally, the greatest amount on lottery tickets (Kearney et al., Forthcoming). Low-income households are also the least able to come up with $2000 in the event of an emergency. Thus, rather than insuring against unlikely adverse outcomes, the most financially fragile households purchase lottery tickets, which provide a remote chance at a life-changing positive outcome. The extreme financial fragility of the majority of US households, two-thirds of whom do not have a $2000 buffer in case of an emergency, poses an externality on society and results in a undesirable welfare outcome. A related study by Lusardi, 1Savings is defined as “otherwise inefficiently invested wealth that provides liquidity” (Morse,
2011).
2The $2000 figure was chosen because it is the cost of an unexpected home or car repair, or a
Schneider and Tufano (2010) finds that, in response to the current financial crisis, Americans cut back on non-emergency medical coverage more than individuals in countries with national health coverage, and that financial fragility was one of the strongest predictors these cuts. At minimum, the high degree of financial fragility is a cause of anxiety and stress. At worst, the inability to come up with $2000 at short notice in response to an emergency could result in familial strife, depression and bankruptcy. Low levels of savings, thus, are an undesirable welfare outcome.
The negative welfare outcome and externalities associated with the high levels of financial fragility of US households can be remedied with a number of policy responses. Direct government action, however, in the form of mandated savings or direct cash injections to increase liquidity is problematic. The former is likely to be impractical as savings must be liquid to be effective consumption insurance. Households who do not save will simply withdraw their savings, and any attempt to limit withdrawals to genuine emergencies would lower liquidity and increase red-tape. Furthermore, it is possible that savings mandates may be politically impractical as such a policy may be viewed as paternalistic. Direct cash injections are also unlikely to be effective as research has shown that cash injections to low-income households simply increase current consumption (Adams, Einav and Levin, 2009; Stephens, 2003). Thus, a policy which encourages people to choose to save more is considered.
This thesis explores the introduction of a novel financial product, which exploits the broad appeal of lottery tickets to influence individuals’ choice to save. Prize-linked savings (PLS) products are savings devices which, instead of an certain interest payment, pool the interest payments of all investors and pay the total out
to one randomly chosen investor at regular intervals.3 PLS products are “no-lose
lotteries” as they guarantee principal-security. They have the appeal of lotteries, as well as the additional savings appeal of liquidity, and principal-security. Evidence from over 20 countries in which PLS products are offered shows that PLS products are both profitable for public and private issuers, and appealing to savers (Kearney 3The jackpot prize for the longest running PLS product in the UK is £1 million pounds per
et al., Forthcoming). PLS products present a choice for individuals, which is designed to encourage saving.
The main hypothesis presented in this empirical thesis is that the introduction of PLS products in an economy will increase the total level of savings. This hy-pothesis is tested using an diverse online panel. The online panel allows for the modelling of a simple economy where subjects are faced with an individual port-folio allocation problem. Subjects are first presented with a series of decisions in which they can allocate funds to current consumption, traditional savings or lot-tery tickets subject to a budget constraint. Then they are presented with a similar set of decisions with the option to allocate funds to the PLS product as well. The effect of the introduction of PLS on the total level of savings can, thus, be measured. Furthermore, the sources of PLS demand can be fully analysed using the detailed individual-level information on allocations to current consumption, traditional savings and lottery tickets which is not available in the field. Sourc-ing PLS demand is of particular importance because if PLS demand is sourced primarily from traditional savings then the externality exists and welfare is not improved. However, if PLS demand is sourced primarily from current consumption and lottery ticket expenditure, then the level of total savings increase and welfare is improved.
This experiment shows that the introduction of the PLS significantly increases total savings by 25 percent. In particular, total savings increase most amongst subjects who report having no savings. Econometric analysis of the ‘dreaming premium’ subjects pay when they buy lottery tickets with a large ($1000) jack-pot payoff instead of investing in traditional savings shows a positive relationship between the premium of dreaming and the likelihood of PLS take-up when it is introduced. This suggests that PLS are considered to be an alternative to lotter-ies. Examination of the sources of PLS demand show that current consumption and lottery ticket expenditure decrease by 38 and 33 percent, respectively, whereas traditional savings decline by only 20 percent. Thus, the total increase in the level of savings is greater than the interest foregone by subjects when they invest in the PLS. It is unambiguous that the change in the choice set caused by introduction
of the PLS ‘nudges’4 individuals to save more money, on average.
This thesis proceeds as follows: Section 2reviews the literature on PLS products,
the theoretical literature explaining the lottery ticket puzzle, and work on the
financial fragility of American households. Section 3provides a full statement of
the hypotheses tested by the experiment. A key methodological contribution to the experimental literature regarding the interaction between hypothetical payoffs
and incentivised payoffs, and sample-selection is discussed here. Section 4details
the motivation behind the design of the experiment and presents key details of the
experimental procedure. Sections 5 & 6provide an overview of the results of the
experiment followed by a discussion of the results, their relation to the hypotheses
and contribution to the literature. Section 7concludes.
4This term is borrowed from Thaler and Sunstein (2008). A ‘nudge’ is when a positive policy
outcome can be attained by altering individuals’ choice set, or the choice architecture they face, without reliance on mandates, or other such mechanisms.
2
Literature review
2.1
Prize-linked savings
PLS products have been largely unstudied by scholars despite their widespread availability and long history. Academic work in this area focuses on the history and appeal of such products, and uses macroeconomic data to study the sources of their demand. The focus of most empirical work is on British Premium Bonds, which are the longest-running PLS program currently in existence.
2.1.1 Overview
The structure of PLS products is almost identical across financial institutions – they are offered as a kind of deposit account (when offered by private institutions) or as an alternative government-backed bond which bear little or no interest and instead provide investors with a randomised return in the form of cash or in-kind prizes, whilst maintaining principal-security and liquidity. They are offered in over
20 countries5 and have been available since the 1694 ‘Million Adventure’ in the
United Kingdom (Kearney et al., Forthcoming; Murphy, 2005).
2.1.2 Appeal
Kearney et al. (Forthcoming) identify the key aspects of PLS products which appeal to savers and issuers. Savers are drawn to PLS because of the skewness of its return, that is, PLS provides investors with exposure to upside-risk without exposure to potential losses, and due to the element of entertainment or ‘fun’ associated with lotteries. For institutions issuing PLS products, they are often found to be more profitable than traditional savings products as they have lower costs of marketing and production due to public familiarity with lotteries, and because they may be invested into relatively simple investments compared to other financial market products such as mutual funds. Moreover, salient prizes can be 5Including in Australia: http://www.boq.com.au/save_to_win/default.htm
created and maintained by simply altering the odds and underlying interest rate over time. This also allows issuers to maintain liquidity as prize-eligibility can be denied to those making withdrawals. The experience of Latin American banks indicates that the cost of raising funds through PLS is between one-half and two-thirds of that of regular savings accounts, suggesting that PLS accounts are a viable source of revenue for the banks that offer them (Guillén and Tschoegl, 2002). Kearney et al. draw an important link between lottery gambling, its prevalence amongst low-income households in the US and low savings rates amongst these households, and point to PLS products as a possible policy response to this phe-nomenon. In 2008, 42 states and the District of Colombia offered state lotter-ies which collectively raised $60 billion in sales, or more than $540 per house-hold, despite a negative expected return of $0.52 per dollar. Astonishingly, in 2008, average household expenditure on lottery tickets exceeded expenditure on dairy ($430) and alcohol ($444). Furthermore, lottery gambling is prevalent across several socio-economic characteristics, especially race, sex, income and education groups. Average annual lottery spending is constant across income groups, thus low-income individuals proportionally have the highest lottery expenditure. These stylised facts lead Kearney et al. to hypothesise that there is unmet demand in the US for saving products which offer the, albeit small, possibility of changing current wealth status, rather than incrementally building wealth with certainty.
The introduction of PLS products to the US could fill a ‘missing market’ for the 50 percent of households unable to cope with a consumption shock of $2000(Lusardi, Schneider and Tufano, 2011; Kearney et al., Forthcoming). Currently, the market for emergency savings is limited to interest-bearing savings accounts. Over an uncertain horizon of several months or years, compound interest does not provide a compelling reason to save. PLS allows savers to maintain liquidity and principal certainty, while providing a chance to win a large prize, at the cost of a small
interest payment (Kearney et al., Forthcoming). In particular, the skewness of
PLS returns means that individuals receive the opportunity to enter a higher wealth, and social, class, whilst maintaining their current wealth levels. Limited data from the introduction of a PLS program in South Africa, which attracted $US201 million of funds from 1.1 million individuals, many of whom had never
had bank accounts before, supports their hypothesis. This hypothesis is tested in this study.
2.1.3 Empirical studies of Premium Bonds
Premium Bonds (PBs) have been offered to British savers continuously since 1956, and were introduced to combat inflation and finance British WWII debt obliga-tions. PBs are widespread in Britain with 23 million PB holders investing more than £33 billion. PB holders are given chances to win tax-exempt prizes ranging from £50 to £1 million. The odds of winning a prize in September 2006 were
approximately 24,000 to 1.6 Major empirical studies on PBs have been conducted
by Lobe and Hölzl (2007), and Tufano (2008).
Lobe and Hölzl (2007) consider the risk attitudes of PB holders, and test whether
these risk attitudes determine PB demand. Lobe and Hölzl estimate the risk
tolerance of an investor who is indifferent between PBs and a risk-free investment. They find indifference risk coefficients which are close to risk neutrality, especially in recent years, and are relatively stable. Across tax brackets, they find that PB holders in the lowest tax bracket are either risk neutral or slightly risk-seeking, and high-income taxpayers with a slight degree of risk aversion also invest in
PBs. They conclude that PBs are not considered risky because investors retain
principal-security, and there are no other participation fees other than foregone interest.
Where Lobe and Hölzl frame PB demand in terms of risk attitudes, Tufano (2008) aims to determine whether the savings aspect, the lottery aspect, or the hybridi-sation of the two causes demand for PLS. This is done via time series analysis of correlations between net PB sales (i.e. sales less redemptions), gambling
ac-tivity and traditional savings acac-tivity, for the period 1987-2006.7 Tufano finds
that net PB sales are significantly and positively correlated with gambling activity and positively correlated changes in savings at a level approaching significance. A 6Further information can be found at
http://www.nsandi.com/savings-premium-bonds.
7Traditional savings are measured using M4 (household fixed income holdings including saving
accounts, and term deposits) less cash-at-home and checking accounts. Gambling activity is measured using a time series of general, pool and bingo betting, and National Lottery sales.
significant and positive correlation between gambling and savings is also found. However, the correlations of the first differences of these series are not significantly different from zero, which suggests that the time series examined are complements, or correlated with a common macroeconomic factor such as wealth but otherwise independent. Tufano concludes that investors consider PBs to be a hybrid product with a clear savings element.
Lobe and Hölzl (2007), and Tufano (2008) provide valuable insights into the char-acteristics of PB holders, and the determinants of PLS demand. However, further study is needed to determine whether individuals’ risk attitudes, or preference between savings and gambling cause demand for PLS products, which are ques-tions which cannot be dealt with adequately with macroeconomic data. In an experimental-setting with a simplified model economy it may be possible to deter-mine the links between risk attitudes and demand for PLS products, and, through a study of the comparative statics following introduction of PLS products, whether this demand derives from savings, lottery expenditure, new investments, or some combination of all three.
2.1.4 A US field study
The two PB studies analyse PLS demand in an economy with an established, well-known PLS program. Tufano, De Neve and Maynard (2011), on the other hand, provides an equally important contribution to the literature as the only field study conducted on the introduction of PLS products in a developed economy without previous experience of such a product. Tufano, De Neve and Maynard study the launch of the first US PLS product in 2007 by Centra Credit Union in Indiana. A survey conducted in Clarksville, Indiana accompanying the launch is the primary data source. The survey was conducted at a local Wal-Mart and 547 customers provided demographic information and answered the question:
Would you be interested in a savings account that awarded chances to win prizes based on the amount of money you save? The account would also have no fees, no minimum balance, and still earn interest.
A majority said that the concept appealed to them. A regression analysis of stated interest using explanatory variables reflecting demographics and socio-economic characteristics found that PLS appealed more to non-savers, who were 70 percent more likely to state interest. Participants with assets between $1 and $2000 showed 2.5 times greater interest in the PLS compared to those with over $50,000 of assets. In addition, those who spent over $100 in the past six months on lottery and gambling activity showed interest levels 2.9 times higher than those who spent less than $100. Optimistic participants (who possibly overestimated their chance of winning) showed 2.1 times more interest than those who foresaw no change in their income over the coming five years, consistent with the behavioural research of Puri and Robinson (2007). However, other demographic factors were insignificant. Tufano, De Neve and Maynard (2011) is an important contribution to the litera-ture as it is the first to examine the introduction of the PLS with microeconomic data. The results suggest a high degree of heterogeneity in PLS demand. It is an important first step in determining the demographic sources of PLS demand. Nonetheless, more study is needed to determine the financial sources of PLS de-mand and to answer pertinent questions: Do people save more when the PLS is introduced? Do they buy fewer lottery tickets? Do people make new investments when the PLS is introduced? Such issues are critical to the question of increasing savings rates, and the implications of PLS introduction.
2.2
The lottery ticket puzzle
The stylised fact that consumers purchase both lottery tickets and insurance prod-ucts, displaying at once risk-seeking and risk-averse behaviour, is a long-standing puzzle for economists. Multiple solutions have been offered, including the seminal work by Friedman and Savage (1948), yet no single, coherent theoretical expla-nation of this phenomenon exists. Any attempt to offer such an explaexpla-nation is beyond the scope of this empirical study. However, notable explanations for this puzzle are considered in order to meaningfully interpret and explain the nature and sources of demand for PLS products in this study. This is because PLS prod-ucts borrow the key salient feature of lotteries – a risky chance to win a large,
life-changing prize – to appeal to consumers.
Expected utility theory provides a coherent theoretical framework within which subjects attitudes towards risk can be tested. Key microeconomic studies of risk preferences provide evidence for risk-aversion (Holt and Laury, 2002, 2005; Ander-sen et al., 2008; DellaVigna, 2009) which further confounds the puzzle. Generally, risk-aversion under expected utility predicts a preference for the safe certainty of compound interest over the extreme uncertainty of lottery tickets. This theoret-ical prediction stands at odds with the stylised facts of low savings levels, and a high level of lottery ticket sales in the US (Lusardi, Schneider and Tufano, 2011; Kearney et al., Forthcoming).
Despite the inconsistency of observed risk-aversion with expected utility’s theo-retical predictions, lottery demand can be explained by assuming individuals buy lottery tickets because they are ‘fun’. That is, when people consider purchasing lottery tickets they do not consider them as solely financial gambles, in which case a risk-neutral person would maximise her expected value and save the money in-stead, but instead as hybrid consumption-financial products. The motivation for buying lottery tickets is then to receive a ‘utility from dreaming’ which is suffi-cient to offset the loss in expected return relative to savings, or other safer financial products.
Formal expected utility models which incorporate this utility of dreaming are
ex-tremely rare in the literature. In the only model of additive expected utility
available in the literature (Oster, 2002), individuals maximise utility over ticket purchases (n), where
U = (1−(1−p)n)·u(J+X−n) + (1−p)n·u(X−n) +EUs,n+V(J, X, λ), if n >0,
and if n= 0,U =u(X), where n is the number of tickets, u(·) is a concave utility function,u0(·)>0, u00(·)<0,J is the jackpot,Xis the individual’s wealth,pis the
probability of winning,EUs,nis the expected utility of winning smaller prizes when
n tickets are bought and λ is a free parameter capturing heterogeneity in feeling
about the lottery. Thus,λ is the parameter capturing the ‘dreaming premium’ an
utility of current wealth, whereas the utility of purchasingntickets is the expected utility of the tickets plus the utility of dreaming associated with the lottery (the
V(·) function). V(·) is assumed to be increasing in jackpot size, J, decreasing in
wealth, X, and increasing in λ. Expected utility theory can, therefore, explain
demand for lottery tickets when they are taken to have some sort of consumption element, like the utility from dreaming. Moreover, Oster’s model is an extremely valuable contribution to the literature as the only model to specify the utility of dreaming.
Even though expected utility can explain the demand for lottery tickets, alterna-tive behavioural theories provide richer descriptions or explanations for the de-mand for lottery tickets. They can be divided into two categories: rank-dependent expected utility theory (Quiggin, 1982) and cumulative prospect theory (Tversky
and Kahneman, 1992) which rely on subjective probability weighting to show that
individuals overweight the small objective probabilities of winning a lottery jack-pot; and, theories which rely on the idea that individuals aim to move out of their current wealth ranking, in comparison to others, and so invest in products with a small entry fee and an opportunity to win a large, risky payoff (Shefrin and Statman, 2000; Hopkins, 2011). The latter explanation is often referred to as skewness – the small chance to win a large, life-changing prize – which is cited as an appealing feature of PLS products (Kearney et al., Forthcoming; Tufano, De Neve and Maynard, 2011; Tufano, 2008).
2.2.1 Probability weighting
Quiggin’s (1982) rank-dependent expected utility (RDEU) model extends von
Neumann-Morgenstern (1944) expected utility theory. In RDEU, a subjective
probability weight is attached to any prospect which not only depends on the objective probability of the prospect but also on its ranking relative to the other
outcomes of the prospect. The probability weighting function, π(pi), which is a
transformation on cumulative probabilities such that P
i∈Nπ(pi) = 1, reflects the
subjective view of risky prospects which then enter the value function, V(.). In
Figure 2.1: RDEU probability weighting function
π(p)
1
1
p
0
that wi = wj even if pi = pj, which allows the weight attached to the
conse-quence to vary according to how subjectively ‘good’ or ‘bad’ it is. The inverted-S form presented in Figure 2.1 of the probability weighting function proposed by
Quiggin (1982) reflects subjective probability, π(p), associated with the objective
probability, p, whereby lower-ranked outcomes will be overweighted relative to
higher-ranked outcomes. Thus, remote outcomes such as the possibility of win-ning a lottery jackpot are systemically overweighted. This provides a coherent explanation for lottery ticket demand by risk-averse individuals.
Tversky and Kahneman’s (1992) cumulative prospect theory (CPT), is an alterna-tive to expected utility which incorporates Quiggin’s probability weighting
func-tion.8 In CPT outcomes are interpreted as gains and losses relative to a reference
point, such as status quo wealth. Gains and losses are evaluated using a value func-tion which is concave for gains and convex for losses, and steeper in the domain of 8Tversky and Kahneman (1992) conduct laboratory experiments to elicit the shape of the
prob-ability weighting function. Their findings are consistent with the S-shaped function proposed by Quiggin (1982).
Figure 2.2: CPT value function
losses Figure 2.2. This functional form implies that agents exhibitdiminishing
sen-sitivity and loss aversion. Diminishing sensitivity holds that psychological impact of a change relative to a reference point decreases as it moves further away from a reference point. This is analogous to diminishing marginal utility for gains, and diminishing marginal disutility for losses. Loss aversion is the principle that “losses loom larger than corresponding gains” (Tversky and Kahneman, 1992).
CPT incorporates the RDEU probability weighting function so that risky prospects are evaluated with reference to a weighting function that underweights large and overweights small probabilities. The S-shaped function is used because a value function with the property of diminishing sensitivity will be steepest around the reference point, and, if the end points of the probability scale provide natural reference points, diminishing sensitivity implies a probability weighting function which is steep near zero and one but relatively flat around the middle.
Both RDEU and CPT provide a coherent theoretical explanation why normally risk-averse agents purchase lottery tickets – they overweight the probability of
winning the lottery jackpot. Given that PLS shares the salient feature of a jackpot prize, this can explain PLS demand. Moreover, the principle of loss aversion in CPT provides a further basis for PLS demand. As principal investments in PLS are safe and liquid, nominal deposits are not ‘lost’ in the same way as money paid for a losing lottery ticket is. PLS products, thus, guarantee loss-aversion.
2.2.2 Skewness
An early approach to explaining the demand for lottery tickets was developed by Friedman and Savage (1948), who attempted to explain why agents simultane-ously exhibit risk-averse and risk-seeking behaviour. This is represented using an S-shaped utility function (Figure 2.3), which is concave for lower wealth levels, as agents are risk-averse in the neighbourhood of their current wealth level, and con-vex for higher wealth levels, as agents may be risk-seeking with respect to prospects which may take them into a higher wealth, and therefore social, class. This can explain why people buy insurance contracts to maintain their current wealth level, but also purchase lottery tickets to move up to a higher wealth level.
This model has been extended by several researchers (Flemming, 1969; Kim, 1973; Ng, 1975; Crossley, Low and Smith, 2011) to argue that since agents’ budget sets are discontinuous, either due to large indivisible expenditures such as univer-sity tuition, or due to imperfect credit markets, lottery tickets are purchased to ‘convexify’ agents’ budget sets. However, a number of important objections to the Friedman-Savage model have been made (Machina, 1982; Quiggin, 1991); the most important one is that the individuals’ observed gambling behaviour does not change radically in response to changes in their initial wealth, which is consistent with the stylised facts about gambling in the US reported by Kearney et al. (Forth-coming). The Friedman-Savage utility function, however, implies that behaviour will be highly sensitive to changes in initial wealth, with only individuals near the inflexion points displaying propensities to both gamble and insure.
The Friedman-Savage utility function remains an extremely important contribu-tion despite flaws to its funccontribu-tional form. It is useful for identifying an important reason for the demand for lottery tickets – skewness or the desire to ‘get rich, quick’
Figure 2.3: Friedman-Savage utility function
(Kearney et al., Forthcoming; Tufano, 2008). The utility of moving up the social ladder is the basis of two differing theories – Hopkins’ (2011) model of inequality and risk-taking behaviour, and Shefrin and Statman’s (2000) behavioural portfolio theory – which explain the demand for lottery tickets and PLS.
Hopkins (2011) develops a model of social competition (i.e. tournament) which determines how a range of ranked rewards or status positions are allocated. He finds that if the value of the minimum status approaches zero, the lowest-ranked in society will be risk-seeking, even if they have substantial wealth. Intuitively, low social status or exclusion leads to desperation, which gives an incentive to gamble. Thus, the prospect of low status, independent of the affluence of society, determines risk-taking.
Hopkins’ model provides a theoretical mechanism to link the apparent empirical relationship between inequality and risk-taking behaviour, which is consistent with the stylised facts reported by Kearney et al. (Forthcoming). According to Hopkins’ model, low-ranked households and individuals fear outcomes which will maintain
their low-rank. This fear causes desperation, which in turn leads to risk-seeking behaviour to avoid low-rank outcomes, and seek outcomes which could improve their social ranking. This risk-seeking behaviour may range from engagement in criminal activities (in particularly dire cases) or, more usually, higher expenditure on lottery tickets as a proportion of income. By a similar logic, the highest level of demand for PLS products should be from low-income individuals.
Behavioural portfolio theory (BPT) (Shefrin and Statman, 2000) considers the decision to invest in savings accounts, or lottery tickets in terms of a portfolio
of several mental accounts. BPT portfolios resemble layered pyramids, where
layers are associated with aspirations. In a simple two-layer portfolio there is
a low aspiration layer designed to avoid poverty (e.g. savings in the form of
Treasury bonds) and a high aspiration ‘for a shot at riches’ (e.g. lottery tickets). Moreover, Shefrin and Statman cite British premium bonds as an optimal single investment for low-income individuals, as they combine low- and high-aspiration outcomes.
Skewness can thus explain the demand for lottery tickets. Individuals purchase lottery tickets because they derive some utility from ‘a shot at the riches’. PLS products share the feature of a large jackpot prize with lottery tickets and, thus, skewness explains the appeal of PLS.
2.3
Welfare implications
US households spend, on average, $540 per annum on lottery tickets, which indi-cates a high level of demand for financial products offering the remote chance to win a large, life-changing outcome. The findings of Lusardi, Schneider and Tufano (2011) indicate, however, that whilst US households demand financial products with a large, uncertain payoff, there is a strikingly low level of insurance against transitory consumption shocks amongst US households. In an online survey 2,148 US residents were asked, “How confident are you that you could come up with $2000 if an unexpected need arose within the next month?” 50 percent of
respon-dents answered that they would not able to come up with $2000.9 This suggests that half of American households are extremely financially fragile in the face of a ‘routine’ emergency. In particular, two-thirds of respondents in the lowest income bracket reported themselves as being unable to come up with $2000. Econometric analysis shows that these findings are robust across a range of socio-economic char-acteristics, although the unemployed, those who have suffered large wealth losses, and families with children are more likely to report being unable to cope with a $2000 shock. This finding is broadly consistent with other surveys, such as the 2007 Survey of Consumer Finances, which showed that 42 percent of Americans has less
that $2000 in savings accounts.10 Moreover, a study by Blundell, Pistaferri and
Preston (2008) finds that unpredictable consumption shocks far exceeding $2000 are quite common, which suggests that Lusardi, Schneider and Tufano’s findings underestimate the level of financial fragility in the US. As such, Lusardi, Schnei-der and Tufano’s study is an extremely important and relevant contribution to the literature.
The fact that the majority of American households are extremely financially frag-ile, with more than half of respondents indicating that they do not have the savings to weather a $2000 storm, poses an externality on society and results in an un-desirable welfare outcome. Psychologically, the anxiety or pessimism associated with a high degree of financial fragility could lower welfare. Low levels of savings could also increase bankruptcies in a country which already has over 1.5 million
individual bankruptcies in a twelve month period.11 A related study by Lusardi,
Schneider and Tufano (2010) finds that, in response to the financial crisis of 2008, Americans cut back on non-emergency medical expenditure more than residents in countries with national health coverage. Controlling for wealth, income and other economic indicators, their measure of financial fragility was one of the strongest predictors of the likelihood that a household would cut its non-emergency health-care expenditure. Although more research is needed in this area, it is suggestive 9Of the 50 percent who responded that they could come up with the $2000, only 60 percent
named savings as the source of the $2000. This indicates that two-thirds of respondents did not have $2000 of savings.
10This survey was conducted before the 2008 recession.
11US Courts data for the 12-month period ending 31 March, 2011 (http://www.uscourts.gov/
of the externalities, or negative welfare outcomes of financial fragility, and low-savings. Low levels of savings and associated high levels of financial fragility thus pose a major issue for policymakers as they result in externalities which reduce overall welfare.
In order to address this negative policy outcome, governments could regulate, or mandate savings requirements. However, the enforcement of such a policy would be problematic given that emergency savings must be liquid, and easily accessi-ble, and therefore savings could be withdrawn even when there is no consumption shock. A possibly more effective method of increasing savings levels is the in-troduction of PLS, which has two advantages over government mandated savings requirements. First, PLS products are easy to market and explain to individuals, and easy to understand because they borrow their salient features from lottery tickets and offer principal security. This is particularly relevant since Lusardi, Schneider and Tufano (2011) find a correlation between low levels of financial literacy and high levels of financial fragility. Second, savings mandates may be viewed with resistance by households and groups who view it as a form of
gov-ernment paternalism.12 The availability of PLS products from the private sector
could ‘nudge’ households towards saving more by changing their choice architec-ture. The framing of choices and the setting of default options has been shown to have an affect on households’ decisions, and the availability of PLS products could encourage savings (Thaler and Sunstein, 2008; Atalay, 2011). Thus, PLS products are a viable potential policy response to the financial fragility and low-savings rates
of American households.13
2.4
Summary
The literature on PLS products has largely focussed on their appeal and history. Empirical studies of PBs have contributed to the literature by addressing ques-12Lusardi, Schneider and Tufano (2011) also find that those with higher levels of financial fragility
were found to have negative attitudes towards regulation.
13State lotteries, which are used to fund services like education, generally have a monopoly on
lotteries. This has been a legal barrier to PLS products in the US. To implement PLS state lottery laws may need to be relaxed.
tions of PLS appeal and demand using aggregate data. However, they have been unable to clearly determine the sources of PLS demand, or address the effect their introduction has on savings levels due to a lack of detailed micro data. Proper consideration of the sources of PLS demand and savings levels requires detailed in-formation on households’ portfolio allocation to consumption, savings and lottery ticket expenditures. Such datasets are not available in the field. An experiment, however, allows for the construction of a model economy in which the effect of the
introduction of the PLS on individual portfolios can be studied. A priori
hypothe-ses regarding the effects and their policy implications are motivated by theoretical and applied literature on the lottery ticket puzzle and low-savings levels in the US.
3
Hypothesis
It is assumed that before the PLS is introduced individuals,
maxUi(αCi, βSi, θLi) subject to α+β+θ = 1, (?)
where Ci is the amount individuals allocate to current consumption, Si is the
amount saved in traditional interest-bearing accounts, andLi is the amount spent
on lottery tickets. α, β and θ are the proportion of an individual’s portfolio
allo-cated to current consumption, traditional savings, and lottery tickets. After the PLS is introduced individuals,
maxUi(α∗Ci, β∗Si, θ∗Li, γ∗P LSi)subject to α∗+β∗+θ∗+γ∗ = 1, (??)
where Ci, Si and Li are defined as in(?), andP LSi is the amount invested in the
PLS. α∗, β∗, θ∗ and γ∗ are the proportion of an individual’s portfolio allocated to current consumption, traditional savings, lottery tickets, and PLS.
The theoretical considerations in the Literature Review motivate the following a
priori hypotheses regarding the introduction of the PLS –
H1 Current consumption will decrease, or remain constant: α∗ ≤α.
The introduction of the PLS alters the choice set for individuals, who now have the option of investing in a novel financial product which possesses the salient features of lottery tickets, with the appeal of skewness, and traditional savings, with liquidity and principal-security. Individuals will now reallocate from current current consumption to PLS, thereby creating ‘new’ savings. This captures a ‘missing markets’ for savings.
H2 Traditional savings levels will decrease, or remain constant: β∗ ≤β.
Savers can now choose a savings product that offers skewness at the expense of certain interest income. The desire to improve one’s social ranking and wealth level will to some degree be greater than the appeal of compound interest and thus, traditional interest-bearing savings will decrease.
H3 Expenditure on lottery tickets will decrease, or remain constant: θ∗ ≤θ. The PLS borrows the key salient feature of lottery tickets – a large jackpot payment. Individuals who derive a utility of dreaming from lottery tickets now face a trade-off as they find that they can derive similar utility from the PLS product. They may now buy lottery tickets, in which case the money allocated to the lottery is ‘lost’ if they do not win the lottery jackpot, and receive higher odds of winning the jackpot prize than if they invested in the PLS, which offers principal-security but also lower odds of winning. It is hypothesised skewness and loss-aversion cause individuals to reallocate funds from the lottery to the PLS.
H4 Total savings will increase, or remain constant: β∗+γ∗ ≥β.
Current consumption, traditional savings and lottery expenditure are all hypothesised to decrease when the PLS is introduced, with the amounts re-allocated to the PLS. The increase in savings through the PLS, that is the certain return from the PLS and traditional savings including interest, will exceed the certain interest foregone when individuals reallocate funds from traditional savings to the PLS. Thus, the level of total savings is increased primarily through a reduction in current consumption and lottery ticket ex-penditure.
4
Design
To experimentally measure the effect of PLS on the level of total savings, and the sources of PLS demand, it is necessary to recognise that individuals’ problem before the PLS is introduced is essentially to maximise their utility by allocating their portfolio to current consumption, lottery tickets, or traditional savings. The introduction of the PLS alters individuals’ choice set. Individuals then maximise their utility by allocating their portfolio to current consumption, lottery tickets,
traditional savings, or PLS. This is the problem described by (?) and (??) in the
Hypothesis section. Field data regarding individual portfolio allocation in this context is not available. An experimental approach allows a simple economy in which individuals face a portfolio allocation problem to be modelled.
A key feature and innovation of the experimental design presented below is its non-standard subject panel, which was recruiting using the popular online services, Study Response and MTurk. Student subjects are the standard for experimental panels due to their convenience for academic researchers. Standard student pan-els, however, are not ideal for a portfolio allocation experiment to determine the level and sources of PLS demand. First, student subject panels are not generally heterogenous in age, income, savings level, or education. Given the heterogeneity in the characteristics of financially fragile households in the US, and their lev-els of education and financial literacy (Lusardi, Schneider and Tufano, 2011) the recruitment of a heterogenous, representative subject pool online confers many advantages on such a study. Second, an online panel comprises of subjects of vary-ing ages and higher levels of experience in managvary-ing a household portfolio. Thus, decisions in the experiment are made by subjects more experienced in household portfolio management than a standard student panel. Third, the relatively low cost of online recruitment allows for the recruitment of a relatively large subject
panel (N = 562), which is generally unfeasible in lab experiments. Thus, this
ex-periment has the properties of both anartefactual field experiment (i.e. a relevant
population) and framed field experiment (i.e. relevant context), in the taxonomy
4.1
Establishing an experimental framework
The choice between risky lottery tickets and safe interest-bearing savings reflects peoples’ risk attitudes. Moreover, since interest payments and lottery jackpot pay-ments are made after a delay, the decision to buy lottery tickets or save in the first place, reflects peoples’ time preferences. Thus, studies of time and risk preference elicitation form the basis for the experimental design presented below.
The elicitation of time preference and individual discounting rates, and risk prefer-ences have been the subject of a large body of experimental literature. Discounting studies, surveyed by Frederick, Loewenstein and O’Donoghue (2002), have elicited
high discount rates, often in excess of 1000 percent. Any decision over time,
however, involves a degree of uncertainty and earlier estimates, while extremely important from a methodological perspective, were biased upwards as they as-sumed risk-neutrality (see Coller and Williams, 1999). Risk preference studies have generally been conducted separately from time preference studies and their findings support earlier findings of risk-aversion from micro-econometric studies (Holt and Laury, 2002, 2005). Recognising this bias, and the intertwined nature of time and risk preferences, recent studies by Andersen et al. (2008), Andreoni and Sprenger (Forthcoming), and Laury et al. (2011) form an invaluable contribu-tion to the literature as the three clear theoretical and methodological approaches to joint elicitation of time and risk preferences.
Andreoni and Sprenger’s (Forthcoming) convex time budgeting (CTB) method to jointly elicit time and risk preferences is, in particular, relevant to the portfolio allocation context of this study. Using the CTB method, subjects are asked to allocate a portfolio over two different payment dates, with money allocated to later dates earning various rates of interest. The approach effectively imposes a budget constraint with concave utility (i.e. risk-averse subjects). Therefore, subjects maximise u(ct, ct+k) subject to the future-value budget constraint,
(1 +r)ct+ct+k =m, (4.1)
the interest rate and m is experimental endowment. This approach, therefore, convexifies the multiple price list (Coller and Williams, 1999) approach in which subjects are required to maximise their utility subject to the discrete future-value budget set,
((1 +r)ct, ct+k)∈ {(m,0),(0, m)}. (4.2)
Implicit in this approach is the fact that the budget constraint (4.1) is non-binding for risk-neutral subjects, for whom the corner-solutions consistent with the Coller and Williams (1999) budget set, (4.2), are possible.
The CTB approach forms the basis for this experiment for two reasons. First, the procedure is adaptable to a setting which involves portfolio allocation between current consumption, savings, PLS, and risky lottery products with a jackpot drawn in the future, along a continuum of choices, unlike multiple-price lists in which subjects can only allocate ‘all or nothing’ to an option. The approach itself, recognises the fundamental issues of time and risk preferences which, although not the focus of this study, are an important issue to account for. Second, the principle of constrained optimisation is the only theoretical assumption in this approach. CTB is thus the most appropriate framework for this experiment.
4.2
Online subject panels
The subject panel recruited for this experiment uses the Study Response14 and
MTurk15 panels as a key feature of this experiment. The diversity of subjects in
these panels is considerably greater than that of any physical laboratory. This is an advantage for a study measuring the levels and sources of PLS demand, with a particular focus on low-savings households. Study Response and MTurk allow for the easy recruitment of two experimental groups with different payment methods.
Study Response subjects (N = 113) are compensated using more standard
exper-imental payment methods. Approximately ten percent of subjects were randomly 14This service is found at
http://www.studyresponse.net
15This service is found at
chosen at the end of the experiment to receive payment for one randomly chosen decision made by them during the experiment. The remaining subjects a flat-fee
for participation. MTurk subjects (N = 449), on the other hand, all received
a $1.50 flat-fee for participation. This is a relatively high amount for a service where subjects generally receive between $0.05 and $0.50 for each task they per-form (Horton, Rand and Zeckhauser, 2011). MTurk subjects were inper-formed that they would only receive a flat-fee whereas Study Response subjects were informed of the decision-payment method. This allows for a methodologically interesting examination of the interaction between decisions made under different payment schemes.
4.2.1 Study Response
Established as a unit of Syracuse University, Study Response recently became an independent provider of subject panels for online academic studies. It is operated as a traditional panel, which acts as an intermediary between researchers and subjects.
Study Response has developed procedures to ensure simple recruitment of subjects, and credible payment. Study Response maintains a large and representative panel of subjects, and this allows for the simple recruitment of a large number of subjects via email invitations. In addition, it is in Study Response’s interests to maintain trust between researchers and subjects with regards to the use of their information, and the credibility of payment. This is done by requiring Institutional Ethics Board approval, and by enforcing a policy of double anonymity between researchers and subjects to discourage collusion between subjects and the coercion of subjects by researchers. Its requirement of prepayment of funds by researchers increases the credibility of payment, and trust of subjects. This ensures a subject pool which has trust in researchers’ motives and their ability to provide the promised compensation.
4.2.2 MTurk
MTurk is a service offered by Amazon.com and is primarily operated as an online labour market where employers (‘requesters’) advertise ‘jobs’, known as human intelligence tasks (‘HITs’), to be completed by workers. The purpose of MTurk is to provide a platform where tasks, which cannot be computerised because they require higher-order cognitive skills, can be advertised and completed quickly at low cost. The tasks advertised range from simple data-cleaning tasks, to higher-order tasks such as transcribing audio, with the associated payments ranging from
$0.01 for extremely simple tasks to over $5for more advanced tasks.
An advantage of MTurk, and online experiments generally, is that they are often easy to set-up. On MTurk an experiment is advertised as a HIT, which offers a general description of the experiment which they can accept. Subjects can then
accept the HIT which takes them to the experiment.16 HITs are verified by
pro-viding subjects with a randomly generated ‘completion code’ at the end of the experiment. If the codes generated by the experiment match the codes entered by subjects on MTurk, then it is approved by the researcher and subjects are paid.
MTurk has several features which promote trust between researchers and subjects. Like Study Response, all interactions with subjects are anonymous, which prevents coercion of subjects by researchers. Protocols to prevent collusion amongst sub-jects, and, more importantly, to stop subjects from completing the study multiple times are also in place. Subjects are not allowed to have more than one account,
and CAPTCHA verification17 is used to ensure that the experiment is completed
by humans. The likelihood of multiple computerised attempts by the same subject is also lower for one-shot experiments, like this experiment, since the cost of creat-ing an algorithm to complete the experiment outweighs the potential gain (Horton, Rand and Zeckhauser, 2011). Furthermore, subjects have an incentive to complete experiments honestly because, if they are rejected, their ‘HIT acceptance score’ decreases, which could preclude them from completing HITs which require high 16This experiment was created and externally-hosted on
http://www.qualtrics.com
17This is an acronym based on the word ‘capture’ and stands for ‘Completely Automated Public
acceptance scores. Researchers also have an incentive to act honestly as fraudu-lent behaviour by researchers can be reported to Amazon.com. The requirement to place all payable funds in escrow with Amazon.com before the experiment is advertised increases subjects’ trust in receiving payment. Finally, researchers can specify a number of conditions such as a 90 or 95 percent HIT approval rating, or US residency. This allows them to recruit a subject pool with a higher likelihood of honestly completing the study, and the desired demographic characteristics. These features allow MTurk to act as a clearinghouse where both researchers and subjects have trust in each other.
4.2.3 Advantages and concerns
An online panel has several advantages over a standard laboratory study. First, there is high degree of heterogeneity in an online subject panel compared with a lab study. Online panels allow researchers studying issues of public policy, which require a more diverse population than a standard student panel, to recruit a diverse population relatively easily and at low cost. In this study, recruitment from online panels resulted in a subject sample which is also more experienced at household portfolio allocation decisions than a standard student panel. Second, the experience of an online experiment for later reviewers is exactly the same as the
subjects’.18 Third, replication is easy and nearly identical to the original study
as all that is required to set up the study is an internet connection (Garbarino and Slonim, 2009). Fourth, online experiments have been shown to be externally valid. Horton, Rand and Zeckhauser (2011) find that the results of a common loss-gains experiment, prisoners’ dilemma game and dictator game using MTurk are consistent laboratory studies. In addition, studies by Garbarino and Slonim (2006, 2009) using a Study Response panel have found results regarding gender differences in preferences which are similar to laboratory studies.
There are three concerns associated with online experiments. First, there is a 18This experiment can be accessed at
http://econusyd.qualtrics.com/SE/?SID=SV_ cD4Kd9LjaSdJbNO (Study Response group 1); http://econusyd.qualtrics.com/SE/?SID= SV_0OsFuzJ5PtPVQxe (Study Response group 2); http://econusyd.qualtrics.com/SE/ ?SID=SV_5mXophbcOhYrPfK(MTurk).
possibility of lower trust between subjects and researchers, which could poten-tially bias the results. If subjects do not trust researchers to make payments, their response to experimental payoffs may change. Steps were taken to increase trust amongst all subjects in this experiment. When the study was advertised on MTurk using the Participant Information Statement, and researchers’ contact details. In addition, MTurk’s rules regarding payment encouraged trust amongst workers. Study Response subjects were also sent the Participation Information Statement in their invitation email. The long engagement of these subjects with Study Response encouraged levels of trust amongst Study Response subjects. All subjects were encouraged to contact researchers with any questions regarding the experiment, or payment. All Participant Information Statements, and experimen-tal websites were branded with University of Sydney insignia to encourage trust amongst subjects. Moreover, a comparison of the level of trust in payments be-tween Harvard Decision Sciences Laboratory subjects (which prohibits deception) and MTurk subjects using a 7-point Likert scale found that the mean level of trust was similar amongst both groups. The difference in the mean level of trust was 0.19 standard deviations, which represents a modest difference in trust levels. In addition, the highest trust response was modal for both groups (Horton, Rand and Zeckhauser, 2011). Second, there is a loss of control relative to the lab as subjects could be distracted during the experiment, or multitasking, amongst other things. To control for this subjects were timed as they completed the experiment and asked a comprehension question. As detailed below, only nine subjects failed the comprehension question. Finally, relative to a lab study, there is a concern that subjects may not comprehend what they are doing. The experiment was designed to ensure comprehension at all stages, and all instructions were kept as brief and concise as possible and visual aids were included to enhance comprehension. These are addressed further below.
4.2.4 Differing payment procedures
The experiments for the MTurk and Study Response groups were identical – this includes all text, graphics, formatting, and decisions and parameters – except for details regarding payment. Subjects in the MTurk group completed the
experi-ment with hypothetical payoffs in exchange for a $1.50 flat fee.19 Study Response subjects, on the other hand, were faced with monetary incentives for their deci-sions. Each subject was informed that she had a one-in-ten chance of receiving payment for one randomly-selected decision she makes, and a nine-in-ten chance of receiving a flat-fee. This is an extremely common experimental payment proce-dure, utilised notably by Andersen et al. (2008). The studies by Horton, Rand and Zeckhauser (2011) for MTurk, and Garbarino and Slonim (2006, 2009) for Study Response suggest that there should be no significant difference in the results de-rived between the Study Response and MTurk groups. This hypothesis will be tested by this experiment. Thus, this thesis provides an important methodological contribution to the experimental literature by exploring the interaction between hypothetical and incentivised payoff mechanisms.
The Study Response group is further divided into $8 and $12 flat-fee subgroups. The $8 or $12 flat-fee was clearly mentioned in the invitation email sent to subjects. Subjects in either group had no knowledge of the other group and received exactly the same experiment except for details regarding the fixed-fee. The subgroups were formed to test whether there was a sample-selection bias between them, with a potential higher representation of lower-savings subjects in the $8 subgroup
compared with the $12 subgroup. If there is a sample-selection bias between
subgroups this thesis could provide an insight into the nature and extent of these biases (Slonim et al., 2011).
4.3
The experiment
The experiment was conducted online in two waves: the first wave was conducted using MTurk from 16 to 18 August 2011; the second wave was conducted us-ing Study Response from 29 August to 7 September 2011. The experiment was
identical in both waves.20
19This fee is considered high for MTurk (Horton, Rand and Zeckhauser, 2011). 20This experiment can be accessed at
http://econusyd.qualtrics.com/SE/?SID=SV_ cD4Kd9LjaSdJbNO(Study Response $8 group); http://econusyd.qualtrics.com/SE/?SID= SV_0OsFuzJ5PtPVQxe (Study Response $12 group); http://econusyd.qualtrics.com/SE/ ?SID=SV_5mXophbcOhYrPfK(MTurk).
4.3.1 Portfolio allocation in three stages
The experiment was designed to model households’ portfolio allocation problem in a simple economy where it is only possible to allocate a portfolio to current consumption, traditional savings, and lottery tickets. This is done by constructing a three-stage experiment where subjects are presented with a $100 present-value budget set to allocate to a combination of the early allocation, traditional savings, lottery tickets and the PLS. Thus, the effect the introduction of the PLS has on the level of total savings in this economy, and the sources of PLS demand can be analysed.
The first stage was designed to introduce subjects to the portfolio allocation setting by eliciting preferences over only savings or lottery. It consisted of six decisions – three decisions over current consumption and lottery tickets, and then three decisions over current consumption and savings. All three lottery decisions were presented first, and then the savings decisions were presented. The nature of both decisions was explained to subjects using text, visual aids, and examples. Each decision was made over different lottery and savings parameters. For the lottery
the parameter was theodds of winning a $1000 lottery jackpot, and the three odds
were determined with reference to early payment. Thus, the subjects were offered odds with,
• an expected valuebetter than early payment – i.e. an expected value of $1.10
for every $1 worth of lottery tickets bought,
• an expected value equal to early payment – i.e. an expected value of $1,
• an expected value worse than early payment – i.e. an expected value of
$0.90.
The odds per dollar were thus 0.11 percent (‘good’), 0.10 percent (‘fair’), and 0.09 percent (‘bad’). To communicate the odds of winning clearly, the budget set was discretised into intervals of $20, so that subjects’ allocations to each option were limited to {$0,$20,$40,$60,$80,$100} subject to the $100 budget constraint.21 21This also made equal allocation to all options impossible for subjects, thereby forcing them
The odds are summarised in Table 4.1. For savings, the parameter was the 10-week interest rate, which was used instead of the annual interest rate for simplicity. The interest rates offered were 5 percent, 10 percent, and 20 percent. Finally, it was made clear to subjects that both the lottery (and later PLS) $1000 jackpot payment and interest payment will be made on the same date, so that time preferences do not affect decisions between savings and lottery tickets. Thus, the first stage sets up subjects for complex decisions later on.
Table 4.1: Lottery odds
Allocation ($) 0 20 40 60 80 100
Good odds 0 2.2 4.4 6.6 8.8 11
Fair odds 0 2 4 6 8 10
Bad odds 0 1.8 3.6 5.4 7.2 9
Odds were presented as an “x percent chance of winning the lottery jackpot.”
In the second stage subjects were asked to make two sets of decisions – nine deci-sions over current consumption, savings and lottery tickets, and nine decideci-sions over
only later payment in the form of savings and lottery tickets. Thus, a 3×3×2
design was employed, where all savings and lottery parameters were interacted, and then interacted with the presence of the early payment option. Instructions and examples were again shown before both sets of decisions. The first set of nine decisions including the early payment option were presented first in order of in-creasing interest rate, with good lottery odds interacted first, then fair, and then bad. The purpose of these decisions was to replicate the options available to con-sumers before the introduction of the PLS, and elicit preferences for each option. The second set of decisions were shown in the same order, and the purpose of those decisions was to elicit preferences over savings and lottery to measure the ‘dream-ing premium’ paid to obtain the utility of dream‘dream-ing from lottery tickets.
The third, and last, stage introduces the PLS and involved 15 decisions over early stage subjects could not split current: later into $50 : $50. In the second stage they could not splitcurrent:savings:lotteryinto$33.33 : $33.33 : $33.33. In the third stage they could not splitcurrent:savings:lottery:P LS into$25 : $25 : $25 : $25.
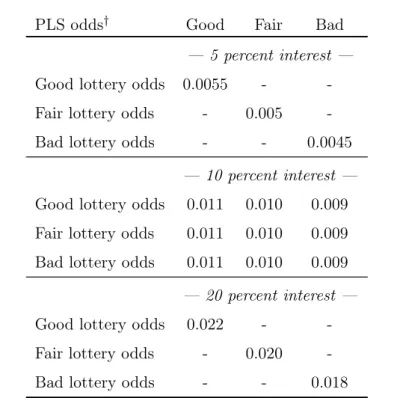
payment, savings, lottery tickets and the PLS product. The savings and lottery parameters were interacted with PLS parameters. The PLS parameter was the odds of winning the $1000 PLS jackpot, which were selected to be ‘good’, ‘fair’, ‘bad’ with reference to the savings option, since it is designed as a substitute for savings. For the fair PLS odds,
EVP LS = 1 +r, where EVP LS = 1 +J·pP LS, ∴1 +J·pP LS = 1 +r, pP LS = r J.
whereEVP LS is the expected return of investing in the PLS,ris the certain interest
return of investing in traditional savings, J is the PLS jackpot prize and pP LS is
the probability, or odds, of winning the PLS jackpot. Since the PLS guarantees principal security, for every dollar invested,EVP LS = 1 +J·pP LS. Thus,pP LS > Jr
for good PLS odds, andpP LS < Jr for the bad PLS odds. Not all interactions were
included in order to keep the experiment at a manageable length. Dominated interactions for the 5 percent and 20 percent interest rates were excluded, but all interactions were included for the 10 percent interest rate. This yielded the final set of interactions summarised in Table 4.2.
This design allows for the measurement of demand for savings, lottery, and PLS products and allows for the measurement of fixed-effects within-subjects to es-timate the effects of the introduction of PLS on portfolio allocation of current consumption, traditional savings and lottery tickets.
4.3.2 Ensuring internal validity
In order to ensure internal validity, it was important to ensure the experimental instructions were easy-to-understand. Unlike laboratory experiments, it was not possible to include long and detailed instructions as there was no guarantee that subjects would read them, and it was expected that as the length of instructions increased, the number of completed responses would decrease. Thus, simple, clear
Table 4.2: Experimental conditions after the introduction of the PLS PLS odds† Good Fair Bad
— 5 percent interest —
Good lottery odds 0.0055 - -Fair lottery odds - 0.005 -Bad lottery odds - - 0.0045
— 10 percent interest —
Good lottery odds 0.011 0.010 0.009 Fair lottery odds 0.011 0.010 0.009 Bad lottery odds 0.011 0.010 0.009
— 20 percent interest —
Good lottery odds 0.022 - -Fair lottery odds - 0.020 -Bad lottery odds - - 0.018 † Odds are expressed as percentage chance of
winning the PLS jackpot per dollar invested.
and direct instructions were required. The experimental design assisted in this respect as the complexity of decisions increased progressively, and thus, once the relatively simple early decisions were explained subjects learned to adapt to the introduction of more products. Moreover, the increasing complexity of the de-cisions was consistent with the experimental aim of considering the effect of the
introduction of the PLS into a model economy. Visual aids (.gifcomputer
anima-tions) were produced which explained the nature of the decisions using simplified representations, such as a piggy bank for savings, and a spinning prize-wheel for the lottery set along a timeline to illustrate the nature of the decision. Finally, in order to ensure that subjects seriously attempted the experiment, a question was included in the demographic survey section to filter out subjects not attempting
the experiment seriously22 –
22Haipeng “Allan” Chen (Mays Business School, Texas A&M University) provided the idea for
this question at his seminar on the use of MTurk for academic experiments delivered at the University of Sydney Business School on 27 June 2011.