The 84th Annual Conference of the Agricultural Economics Society Edinburgh
29th to 31st March 2010
Efficient nutrient management - A win for the farmer and a win for
the environment.
Dr. Cathal Buckley
Rural Economy Research Centre, Teagasc, Athenry, Co. Galway. Tel: +353(0) 91 845293, email: [email protected]
Abstract
Within the constraints of the EU Nitrates and Water Framework Directives, controlling and managing nutrient transfers to water from excessive nutrient use on agricultural land is a significant environmental policy challenge. This paper assesses whether there is room to reduce nitrogen and phosphorus applications by exploring the extent of their over application by land managers using data envelopment analysis methodology. This paper concentrates on specialist dairy and tillage farms stratified by land use potential as these agricultural systems are the most intensive and may pose the greatest risk in terms of managing nutrient transfer from agricultural land to water courses. Results demonstrate considerable inefficiency in the utilisation of nitrogen and phosphorus fertilisers across these systems. Average over application on dairy farms compared to efficient benchmark farms ranged from 25.9 to 33.3 kg Nitrogen ha-1 and 3.0 to 3.04 kg Phosphorus ha-1. Results for specialist tillage farms
indicate over application of 21.2 kg N ha-1 and 3.3 kg P ha-1in 2008. Average,
potential cost savings on chemical fertilisers across all systems on average ranged from €36 ha-1 to €50 ha-1. Additionally, potential cost savings on imported feeds of €68 to €113 per livestock units were indicated on dairy farms. Such reductions have the potential to deliver a double dividend by reducing the risk of nutrient leaching and diffuse pollution from agricultural land while improving economic margins at farm level.
Introduction
Within the constraints of the EU Nitrates and Water Framework Directives, controlling and managing nutrient transfers to water from excessive nutrient use on agricultural land is a significant environmental policy challenge (EPA, 2008). Over application of chemical nitrogen (N) and phosphorous (P) in intense agricultural regions of Europe has lead to excessive amount of these nutrients in the soils as well as in ground and surface water bodies (Volk et al., 2008). It has been estimated that as much as 55 per cent of non-point water pollution of surface waters in the EU is attributable to agriculture (Kersebaum et al., 2003). In recent times there has been much attention on nitrate pollution in waterways, especially eutrophication1. Farmers across Europe are subject to the EU Nitrates Directive which places restrictions on the quantity and application of chemical and organic fertilisers. However, even within the bounds of such restrictions a cohort of farmers have a tendency to apply nutrients excessively compared to their peers and best practice guidelines (Ryden, 1981; Ryden et al, 1984; Scholefield et al, 1993 and Brown et al, 2005). This has both economic and environmental consequences. Economic costs of eutrophication are incurred in two ways; the cost of clean up associated with this pollution and the cost of wasted nutrient inputs. While much attention has been paid to nutrient enrichment control by means of traditional command and control methods, less emphasis has been placed on measuring nutrient management efficiency from a economic loss perspective.
At the aggregate level fertiliser sales have followed a downward trend over the last decade. In aggregate terms nitrogen sales was nearly 309,000 tonnes in 2008, this represents a decline of 30 per cent from 1999 levels. Sales of phosphorous similarly declined by 48 per cent during this period to 26,350 tonnes in 2008 (DAFF, 2009). However, applications at farm level among intensive agricultural systems such as dairying and tillage have not decline to anything near this extent. It is yet to be investigated whether nutrient management inefficiencies exist among these intensive systems in the Republic of Ireland. Such inefficiency is exhibited in other countries such as Greece, UK, and Turkey as outlined by Theodoridis and Psychoudakis (2008), Barnes et al., (2009) and Uzmay et al., (2009).
Brown et al., (2005) suggest that farm efficiency can be improved by simply increasing or decreasing the amount of nitrates spread on grassland. A strong linear relationship exists between the total annual amounts of inorganic nitrogen administrated to a grassland system and the amount of nitrogen absorbed by the plants in that system. While the analysis of exact proportions of N and P required for optimal growth in grassland or a tillage system is outside the scope of this paper, productivity analysis techniques can measure farm nutrient management efficiency by examining farm inputs to output across a sample of farms.
1
Methodology
As discussed by Barnes et al., (2009) when examined farm level technical efficiency the choice is generally between stochastic frontier analysis (SFA) or data envelopment analysis (DEA). SFA is a parametric approach to measuring farm efficiency where a set of explanatory variables can be estimated in a one-stage process. However, SFA necessitates assumptions regarding functional form and the inefficiency disturbance term which may bias the results.
DEA was the approach adopted in this study. Data envelopment analysis (DEA) is a deterministic approach to efficiency measurement. It measures the relative efficiency of a decision making unit, farms in this instance, by comparing relative inputs to outputs. DEA establishes the most efficient farms and compares all others to the most efficient. The method uses linear programming to place a non-parametric frontier over the data. This frontier consists of the most efficient farms and all other farms are measured by their relative distance to this frontier as a measure of their level of efficiency (Coelli et al., 1998). DEA is a non-parametric approach which doesn’t require functional form assumptions. However, DEA does not account for any stochastic variance from the frontier and could lead an over estimate of inefficiency. On a positive note DEA is more flexible than SFA when estimating technical efficiencies using different units. Additionally, DEA offers indicators of physical input usage which can be directly used to measure levels of input excess.
Data source and derivation of DEA variables
The main data source employed in this analysis is a National Farm Survey (NFS) conducted by Teagasc2 in 2008. The NFS is collected annually as part of the Farm Accountancy Data Network requirements of the European Union (FADN, 2005). The purpose of the NFS is to collect and analyse information relating to farm activities, financial returns to agriculture and demographic characteristics. A farm accounts book is recorded on a random representative sample of farms throughout the Republic of Ireland. In the 2008 NFS 1,102 farmers were surveyed representing 104,800 farmers nationally (Connolly et al., 2009). Interviews were undertaken on site by a team of trained NFS recorders.
This paper concentrates on specialist dairy and tillage farms as these are the most specialised and intensive land based agricultural systems and pose the greatest risk in terms of managing nutrient transfer from agricultural land to water courses. The NFS collect data on an enterprise specify basis for livestock systems and an individual crops specify basis for tillage enterprises.
Specialist dairying farms were stratified into two main groups for this analysis namely; average and good land use potential using the National Soil Survey of Ireland (Gardiner and Radford, 1980). There were a limiting number of observations in a third potential category “poor land use potential” hence analysis was restricted to good (n=137) and average (n=88) land use potential categories. It should be noted the
2 Teagasc (the Agriculture and Food Development Authority) is a national semi state body providing integrated research, advisory and training services to the agriculture and food industry and rural communities. It was established in September 1988 under the Agriculture (Research, Training and Advice) Act, 1988.
analysis was also restricted to spring calving systems and excluded farms importing organic sources of N and P3. Tillage farms in this analysis were exclusively related to land of good use potential. DEA models were run for each of the aforementioned cohorts.
Output for specialist dairy farms was measured in litres of milk produced per hectare. Inputs examined were chemical nitrogen (N) and phosphate (P) fertiliser usage (kg ha
-1
) applied to forage area, N and P from imported feedstuffs (kgs per LU)4, labour
(hours per livestock unit) and other variable costs (€ ha-1, exclusive of aforementioned feed and fertilisers inputs). Descriptive statistics for each category is presented in Table 1. As might be expected a priori specialist dairy farms with good land use potential had higher output and tended to use higher level of fertiliser inputs. Dairy farm of average land use potential imported higher levels of N and P in feeds.
Output for specialist tillage farms5 was measured in the form of gross output in € ha-1.
Inputs examined were again nitrogen and phosphorous fertiliser usage (kg ha-1),
labour (hours per hectare) and other variable costs (€ ha-1 exclusive of aforementioned fertiliser input).
Table 1: Farm level descriptive statistics by enterprise type and land use potential Land Use Range Litres / Ha Other variable cost €/Ha Labour (hours / LU) N / Ha (forage Area) P / Ha (forage area) N in imported feeds (kgs / LU) P in imported feeds (kgs / LU) Specialist Dairying Good land use potential N=137 Mean S.D. 10,019 (3,042) 615.68 (223.53) 35.61 (21.05) 154.17 (65.47) 6.98 (6.23) 24.57 (13.21) 3.85 (2.08) Average land use potential N=88 Mean S.D. 8,539 (2,874) 505.93 (171.52) 36.99 (21.04) 123.37 (44.63) 6.61 (5.88) 27.25 (16.76) 4.27 (2.60)
3 No data was available on quantities of organic fertiliser imported in 2008. 4 Imported feed were equivalised into kgs of N and P (Ewing, 1998)
Specialist Tillage € / hectare (Gross output) Other variable cost €/Ha Labour (hours / Ha) N / Ha P / Ha Good land use potential N=80 Mean S.D. 954.65 (241.62) 405.13 (156.73) 37.56 (35.48) 138.63 (41.91) 20.64 (9.57) * Standard deviation in parenthesis
Results
Data envelopment analysis assigns an efficiency score from 0 to 1 for each farm in the sub-sample examined. A fully efficient farm with no scope for improvement would be allocated an efficiency score of 1. The DEA model also indicates targets for efficient input use which can be used to directly assess and measure the level of excess usage. The variable returns to scale model was adopted in this analysis as it was assumes not all farms are operating at optimal scale. This allows calculations of technical efficiencies devoid of scale efficiency effects (Coeilli et al., 1998).
Specialist dairy farms had an average technical efficiency score of 0.85 to 0.86 which suggests these farms on average could reduce inputs by approximately 14 to 15 per cent without influencing output as outlined in Table 2. Results also indicate that both specialist dairy farms cohorts on average were operating at over 90 per cent of optimal scale. Specialist tillage farms indicated an efficiency score of 0.87 suggesting that on average a 13 per cent reduction in inputs would not affect output. Results also indicate that specialist tillage farms were operating at 85 per cent of optimal scale.
Table 2: Technical and scale efficiency scores for specialist dairy farms
Farm System N Technical Efficiency Scale efficiency
Dairy – Good land use potential 137 0.86 (0.14) 0.92 (0.09)
Dairy – Average land use potential 88 0.85 (0.15) 0.91 (0.11)
Tillage – Good land use potential 80 0.87 (0.15) 0.85 (0.15)
To test robustness, technical efficiency scores were bootstrapped and the results in each case passed at 95% confidence interval test. The widths for confidence intervals were small, ranging from a mean width of 0.05 to 0.06. These results indicate a low statistical variability for the efficiency estimates across all cohorts.
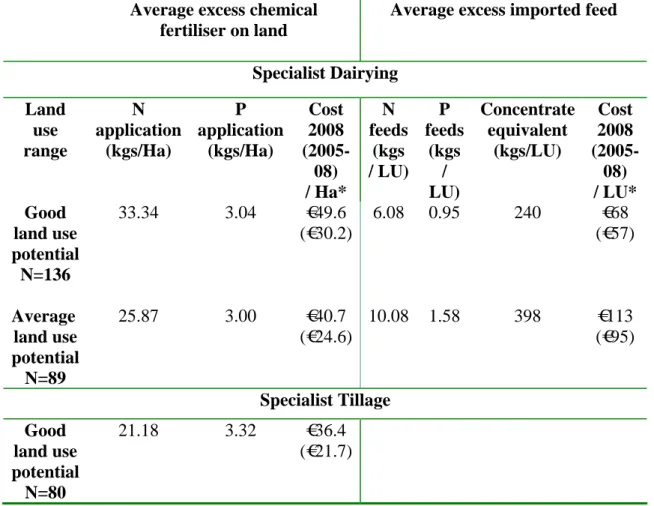
Results for input usage targets indicate that specialist dairy farmers with good land use potential tended on average to over apply chemical fertiliser on forage area to the greatest extent at 33.34 kg N ha-1 and 3.04 kg P ha-1 compared to the benchmark
cohort farms. Average cost saving on fertilisers of €49.6 ha-1 could be achieved by
operating at the benchmark standard using average 2008 fertiliser prices6 (CSO,
2009). However, the price of fertiliser spiked in 2008 and using average prices from
2005-08 this cost saving declined to €30.2 ha-1. The respective cost saving for
specialist dairy farms of average land use was €33.09 ha-1(€16.83 ha-1) as excess N was indicated at 25.87 kg ha-1 and average excess P at 3.0 kg ha-1 as outlined in Table 3.
Imported feed on dairy farms was predominantly in the form of concentrates, hence cost saving related to the average cost of dairy concentrates for 2008 (CSO, 2009). Results indicated that farmers of average land use potential tended to over utilise imported feed to the greatest extent at 10.08 kgs of N and 1.58 kgs of P per livestock unit. This was equivalent to 398 kgs of concentrates per livestock unit compared to the benchmark farms in this category and had a cost implication of €113 per livestock unit based on 2008 prices. The over utilisation of imported feeds was somewhat less among specialist dairy farms of good land use potential at 6.08 kgs of N and 0.95 kgs of P (per livestock units), equivalent to 240 kgs of concentrates per livestock unit and with a cost implication of €68 per livestock unit.
Results for tillage farms indicate over application of fertiliser compared to the cohort benchmark of 21.18 kg N ha-1 and 3.32 kg P ha-1. Average potential cost savings for specialist tillage farms was €36.4 ha-1 as illustrated by Table 3.
However, it should be noted while these potential savings seem quite significant, a caveat is that reduced usage will potentially affect equilibrium prices. Long run cost savings are much more complex to estimate.
6
Average prices of CAN and Urea were used for the average price of N per kg, average price of Glycophosphate was used for the average price of P per kg.
Table 3: DEA analysis of over application of N and P on specialist dairy farms. Average excess chemical
fertiliser on land
Average excess imported feed
Specialist Dairying Land use range N application (kgs/Ha) P application (kgs/Ha) Cost 2008 (2005-08) / Ha* N feeds (kgs / LU) P feeds (kgs / LU) Concentrate equivalent (kgs/LU) Cost 2008 (2005-08) / LU* Good land use potential N=136 33.34 3.04 €49.6 (€30.2) 6.08 0.95 240 €68 (€57) Average land use potential N=89 25.87 3.00 €40.7 (€24.6) 10.08 1.58 398 €113 (€95) Specialist Tillage Good land use potential N=80 21.18 3.32 €36.4 (€21.7)
*Average prices (CSO, 2009)
Conclusions
Results demonstrate considerable inefficiency in the utilisation of N and P across specialist dairy and tillage farms. Significant potential cost savings on fertilisers and imported feeds are also indicated across the relevant cohorts. Consequently, there is potentially an opportunity for inefficient producers to reduce fertilisers (and imported feeds) without affecting output by adopting similar practices to those of the most efficient benchmark farms. Average potential cost savings on fertilisers ranged from €40 ha-1 to €50 ha-1 for dairy farms and €36 ha-1 for tillage systems. Additionally, potential cost reductions on imported feeds of €68 to €113 per livestock were indicated for dairy farms compared to efficient cohort benchmark farms. Such reductions have the potential to deliver a double dividend win-win situation by reducing the risk of nutrient leaching and diffuse pollution from agricultural land improving economic margins at farm level.
References
Barnes, A.P, Moran D. and Topp, K. (2009) The Scope for Regulatory Incentives to Encourage Increased Efficiency of Input use by Farmers. Journal of Environmental Management, 90, 808-814.
Brown, L., Scholefield, D., Jewkes, E.C., Lockyer, D.R. and Del Prado, A. (2005)
NGAUGE: A decision support system to optimise N fertilisation of British grassland for economic and environmental goals. Agriculture, Ecosystems & Environment, 109, 20-39
Central Statistics Office, (2009). Fertiliser and feed prices. Available online at http://www.cso.ie/px/pxeirestat/Dialog/Saveshow.asp
Coelli, T.J., Prasada Rao, D.S., O’Donnell C.J. and Battese G.E., (1998). An introduction to efficiency and productivity analysis, 2nd edition, Springer.
Connolly, L., Kinsella, A., Quinlan, G. and Moran, B., (2009). National Farm Survey 2008. DAFF, 2009. Fertiliser Consumption, 1989/2005 - 2007/2008. Department of Agriculture,
Fisheries and Food, Dublin.
Environmental Protection Agency (2008) Ireland’s State of the Environment Report 2008. Ewing, W.N., 1998. The Feeds Directory: commodity products guide. Context Products
Ltd.
Farm Accountancy Data Network, 2005. Concept of FADN [online]. Available from: http://europa.eu.int/comm/agriculture/rica [Accessed 15 April 2008].
Gardiner, M.J., and Radford, T., 1980. Soil associations of Ireland and their land use potential: Exploratory bulletin to the soil map of Ireland 1980. An Foras Taluntais. Kersebaum, K.C., Steidl, J., Bauer, O. and Piorr, H.-P. (2003) Modelling scenarios to assess
the effects of different agricultural management and land use options to reduce diffuse nitrogen pollution into the river Elbe. Physics and Chemistry of the Earth 28, 537–545.
Ryden J.C., Ball, P.R. and Garwood, E.A. (1984) Nitrates Leaching from 311, 50-53
292, 235–237
Scholefield, D., Tyson, K.C., Garwood, E.A., Armstrong, A.C., Hawkins, J. and Stone, fertiliser input, field drainage, age of sward and pattern of weather, Journal of Soil Science 44, 601–613
Theodoridis A.M. and Psychoudakis, A. (2008) Efficiency Measurement in Greek Dairy Farms: Stochastic Frontier vs. Data Envelopment Analysis. International Journal of Economic Sciences and Applied Research, 2, 53-66.
Uzmay, A., Koyubenbe, N. and Armagan, G. (2009) Measurement of Efficiency Using Data Envelopment Analysis (DEA) and Social Factors Affecting the Technical Efficiency in Dairy Cattle Farms within the Province of Izmir, Turkey. Journal of Animal and Veterinary Advances, 8 (6) 1110-1115.
Volk, M., Liersch, S. and Schmidt, G., (2009) Towards the implementation of the EuropeanWater Framework Directive?Lessons learned from water quality simulations in an agricultural watershed. Land Use Policy 26, 580–588.