Volume 7
•
Issue 23
•
September 2014
THE INCENTIVE EFFECTS OF
EQUALIZATION GRANTS ON
FISCAL POLICY
†
Ergete Ferede
SUMMARY
The equalization system has long been considered a vital underpinning of the Canadian federation: a means to create some purported fairness or justice among the provinces, by redistributing the wealth of provinces with larger fiscal capacities to allow those with weaker fiscal capacities to provide roughly equivalent services to their citizens. However, the mechanics of the equalization formula have long been suspected of being flawed. Since grant-receiving provinces can adjust the way their fiscal capacities are calculated and reflected in the equalization formula — by adjusting tax rates and spending, for instance — governments are confronted with incentives to design their fiscal regimes in ways that maximize the size of the grants they receive, even if the fiscal policies are designed for less-than-optimal economic efficiency. The incentive for grant-receiving governments to “game” the formula, even unconsciously, is apparent; what has remained largely unresolved is to what extent is it actually occurring.
This analysis shows that indeed it is occurring, and to a measurable degree. It finds that equalization grants provide recipient provinces with incentive to raise their business and personal tax rates. This is because when a government raises its own tax rate, it raises the national standard average tax rate, which is used in the equalization allocation formula. That, in turn, raises the individual “have-not” province’s equalization-grant entitlement. Exacerbating the problem is that the tax-raising provincial governments tend to underestimate the deadweight cost that the tax hikes will have, potentially worsening the fiscal situation of a province that already faces difficult economic challenges.
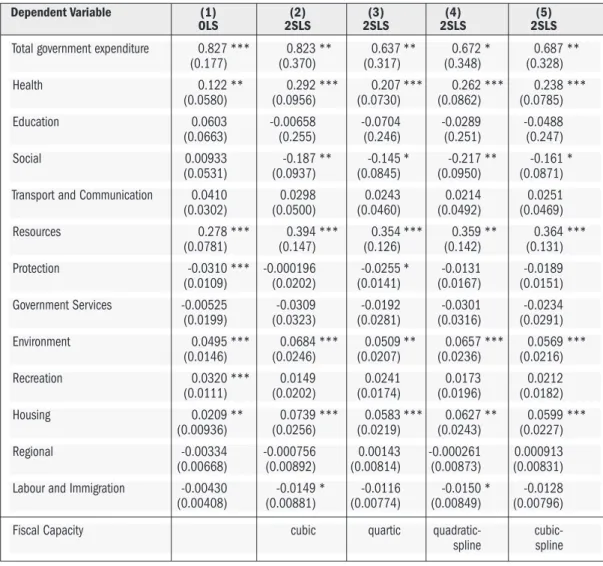
This analysis also finds that the equalization-grant allocation system encourages spending among recipient provinces, particularly on health-care services, resource conservation, industrial assistance, environment and housing. Results show that for every $1.00 increase in equalization grants, recipient provinces further increase spending by an additional $0.64 in total expenditure.
Neither effect necessarily furthers the equalization program’s idealistic intent. The promotion of higher tax rates especially would seem to work at odds with the program’s conceptualization of a federal redistribution model. By potentially further repelling business and taxpayers from “have-not” provinces, the result could be making those provinces increasingly needy while continually reducing their citizens’ wealth.
The equalization formula is not unfixable. The arrangement can be made to work even better, in a way that maintains the principle of redistributing wealth from more privileged provinces to less privileged ones, while avoiding the perverse incentives that motivate “have-not” provinces to raise taxes. If equalization grants were substituted with block grants that are unrelated to taxing capacity, taxes in grant-receiving provinces may actually decline. A $100 per capita increase in block grants is potentially associated with an up to 2.6 percentage points drop in business tax and an up to 0.26 percentage point drop in personal income tax. The result would be an equalization arrangement that could help increase, rather than decrease, competitiveness in the very “have-not” provinces that most urgently need to attract investment. Switching to block grants would not only keep the integrity of the principles behind equalization in tact, it would actually make equalization work better for all provinces.
†
I would like to thank the anonymous referee, Bev Dahlby, Thiess Buettner, and Tracy Snoddon for their valuable comments and suggestions. All remaining errors are my own.
INTRODUCTION
Equalization-grant systems have been the cornerstones of intergovernmental fiscal relationships in federations such as Australia, Canada, Germany, Switzerland and others. In the literature, fiscal equity and efficiency have been put forward as major justifications for the presence of such grants.1
In Canada, the equalization system was designed to address provincial fiscal disparities by compensating recipient provinces when their per capita tax base is below the standard per capita tax base. Theoretical analyses by both Smart and Dahlby2show that in equalization programs based on a representative tax system, such as the one used in Canada, equalization grants influence recipient provinces’ tax policy incentives. The reason is that when a recipient province raises its tax rate, it gets higher equalization entitlements by increasing the national standard tax rate. Further, the province can receive higher equalization grants due to a reduction in the province’s tax base associated with a rise in its tax rate. These tax-rate and tax-base effects of equalization grants cause a downward bias of the marginal cost of public funds (MCF) and, as a result, the grant system gives recipient provinces an incentive to raise their tax rates.
Previous empirical studies, such as those by Courchene and Beavis, Boessenkool, Esteller-Moré and Solé-Ollé, Snoddon and Smart,3also confirm that the equalization system influences tax policy incentives in Canada. For other federations, Buettner4finds that equalization grants provide German municipalities an incentive to raise their tax rates. Dahlby and Warren, on the other hand, find only weak evidence for Australian states.5
While the incentive effects of equalization grants on tax policy are well known and have been widely examined in previous studies, there is a paucity of studies on its effects on government spending. Since the Canadian equalization-grant formula compensates recipient provinces when their per capita tax base is below the standard per capita tax base, Dahlby shows that this gives the recipient provinces the incentive to under-provide tax-base-enhancing public services.6
1
See, for instance: R. Boadway and F. Flatters, “Efficiency and equalization payments in a federal system of government: a synthesis and extension of recent results,” Canadian Journal of Economics15 (1982): 613–33; P. Boothe and D. Hermanutz, “Simply Sharing: An Intergovernmental Equalization Scheme for Canada,” C.D. Howe Institute Commentary(Toronto: C.D. Howe Institute, 1999); M. Kőthenbűrger, “Tax competition and fiscal
equalization,” International Tax and Public Finance9 (2002): 391–408; and R. Boadway, “The theory and practice of equalization,” CESifo Economic Studies50 (2004), 211–254.
2
M. Smart, “Taxation and deadweight loss in a system of intergovernmental transfers,” Canadian Journal of Economics
31 (1998): 189– 206; B. Dahlby, “The Incentive Effects of Fiscal Equalization Grants”, in Equalization: Welfare Trap or Helping Hand?, ed. Paul Boothe (Halifax: Atlantic Institute for Market Studies, 2002).
3
T. Courchene, and D. Beavis, “Federal-provincial tax equalization: an evaluation,” Canadian Journal of Economics6 (1973): 483–502; K. Boessenkool, “Taxing Incentives: How Equalization Distorts Tax Policy in Recipient Provinces,”
AIMS Equalization Papers 3, ed. Brian Lee Crowley (Halifax: Atlantic Institute of Market Studies, 2002); A. Esteller-Moré and A. Solé-Ollé, “An empirical analysis of vertical tax externalities: the case of personal income taxation in Canada,” International Tax and Public Finance9 (2002): 235–57; T. Snoddon, “On Equalization and Incentives: An Empirical Assessment,” Discussion Paper (Waterloo, Ont.: Wilfrid Laurier University, 2003); and M. Smart, “Raising taxes through equalization,” Canadian Journal of Economics40 (2007): 1188–1212.
4
T. Buettner, “The Incentive Effect of Fiscal Equalization Transfers on Tax Policy,” Journal of Public Economics90 (2006): 477–497.
5
B. Dahlby and N. Warren, “The fiscal incentive effects of the Australian equalization system,” Economic Record79 (2003): 434–445.
Cyrenne and Pandey offer the first empirical analysis on the effects of equalization grants on the composition of Canadian provincial expenditure.7They find that the share of unproductive government expenditure is higher and the share of productive government expenditure is lower in the recipient provinces compared to non-receiving provinces.8Using data from German municipalities, Hauptmeier also finds that equalization transfers have a significant negative effect on local government’s share of productive expenditure.9
The main objective of this paper is to provide empirical evidence on the incentive effects of equalization grants on tax rates and government expenditure using panel data from Canadian provinces over the period 1981-2008. Regarding the incentive effects of equalization grants on tax policy, we focus on business and personal income tax rates, as these taxes account for a significant part of provincial tax revenue and have been the topic of discussion in previous studies. In addition, these revenue categories have been included in the equalization-grant allocation formula throughout the period under consideration. In our empirical analysis, following Buettner,10we differentiate the income and incentive effects of equalization grants. The incentive effects associated with the equalization system arise due to the equalization-rate and -base effects that cause a downward bias of the MCF. In this paper we investigate this issue by estimating both the equalization-rate and equalization-base effects, and controlling for possible income effects associated with equalization grants. As the equalization-grant formula shows a discontinuity in the relationship between equalization-grant entitlement and fiscal capacity, we rely on this discontinuity to identify the effects of grants on tax rates. To the best of our knowledge, this paper is the first to address this issue for Canada.
Our empirical results suggest that equalization grants provide provincial governments an incentive to raise their business and personal income tax rates. We also find that the incentive effect works mainly through the equalization-base effects. These incentive effects of
equalization grants are clearly a form of distortion to provincial tax policy as the recipient governments underestimate the true deadweight cost associated with the higher tax rates. Our results suggest that if equalization grants were substituted with block grants that are not related to taxing capacity, business and personal income tax rates would be lower in the
grant-receiving provinces.
We also investigate the effects of equalization grants on both the level and composition of provincial expenditure using the discontinuity in the equalization-grant formula as an identification strategy. Our empirical results suggest that equalization grants stimulate
provincial spending and affect the various provincial expenditure categories. Results from our preferred regression indicate that a $1.00 increase in per capita equalization grant is associated with $0.64 increase in per capita total provincial expenditure. This is broadly consistent with
7
P. Cyrenne and M. Pandey, “Fiscal equalization, government expenditure and endogenous growth,” Working Paper (Winnipeg: University of Winnipeg, 2013).
8
Cyrenne and Pandey (ibid.) use three broad expenditure categories. They classify provincial expenditures on health, education, transportation and communication, general government services, transfers to other governments, and housing as “productive.” They also categorize provincial expenditures on social services and recreation and culture as “unproductive.” Their third category, “others,” on the other hand, includes all the other remaining expenditures.
9
S. Hauptmeier, “The impact of fiscal equalization on local expenditure policies: theory and evidence from Germany”
ZEW Discussion Papers07–081 (2007).
10
the flypaper literature and the estimated results are well within the ranges of results obtained in other similar studies. Further, our results indicate that equalization grants have a significant positive effect on provincial spending on health-care services, resource conservation, industrial assistance, environment, and housing. However, we do not find a significant effect on the other expenditure categories. Overall, our results suggest that the Canadian equalization system influences recipient provinces’ tax and spending decisions.
The remainder of the paper is organized as follows. In Section 2, we provide a brief review of theoretical and empirical studies of the effects of equalization grants on fiscal policy. An empirical analysis of the effects of equalization grants on tax policy incentives for Canadian provincial governments is presented and discussed in Section 3. In Section 4, we examine how equalization grants influence the level and composition of provincial governments’
expenditure. Section 5 concludes.
LITERATURE REVIEW
Fiscal equity and efficiency have been put forward as major justifications for the presence of equalization systems in federations.11Regardless of the rationales for their existence, however, there is a great potential for equalization systems to influence fiscal policy incentives. In this section, we provide a brief review of the literature on the incentive effects of equalization programs on tax policy and government spending.
The incentive effects of equalization grants on tax policy are in fact well known and have been widely examined in previous studies. For instance, an earlier analysis of the Canadian
equalization system by Courchene and Beavis suggests that recipient provinces could manipulate the equalization allocation formula to increase their equalization entitlements.12 The reason is that, in the Canadian equalization system, the main elements of the formula can be affected by the tax policy choice of the recipient province.
Smart presents the first theoretical analysis of the effects of equalization grants on tax policy incentives using the marginal cost of public funds (MCF) framework.13He shows that representative-tax-system-based (RTS-based) equalization grants, such as the one used in Canada, partially compensate for the deadweight loss associated with higher taxes and, as a result, it gives recipient provinces the incentive to raise tax rates. Thus, subnational
governments may adopt suboptimal tax policies in order to gain more transfer payments from the equalization system. This is because if tax-base elasticities are negative, as many empirical studies show, provinces may have the incentive to raise tax rates, which will result in a reduction in their fiscal capacities and more equalization transfers.
11
See, for instance: Boadway and Flatters, “Efficiency and equalization”; Boothe and Hermanutz, “Simply Sharing”; Kőthenbűrger, “Tax competition”; and Boadway, “The theory and practice.”
12
Courchene and Beavis, “Federal-provincial.”
13
Dahlby also provides a comprehensive theoretical analysis of how equalization grants influence both the tax and expenditure decisions of recipient governments.14Regarding tax policy incentive effects of equalization systems, his analysis indicates that equalization grants reduce the perceived MCF of recipient governments and provides them an incentive to raise their tax rates. He shows that there are multiple reasons for this. When a recipient government raises its tax rate, the national standard tax rate increases and this provides the MCF of the recipient government a downward bias. Further, an increase in the tax rate reduces the tax base of the province and this also biases the MCF downward. The downward bias of the MCF caused by the tax-rate and tax-base effects associated with equalization grants ultimately leads recipient provinces to underestimate the true social cost of taxes. The implication of this is that the equalization system provides recipient provinces an incentive to raise their tax rates. While the above studies focus on the theoretical underpinning of the incentive effects of equalization systems on tax policy, others investigate the issue empirically.15
One of the earliest attempts to gauge the tax incentive effects of equalization grants in Canada is offered by Boessenkool.16He investigates how the Canadian equalization-grant system affects tax incentives by comparing the average effective tax rates of recipient provinces to those of comparable non-recipient provinces. His analysis suggests that equalization-grant receiving provinces generally levy higher tax rates than non-recipients.
Esteller-Moré and Solé-Ollé empirically estimate the effects of equalization grants on Canadian provincial personal income tax rates (PIT).17Their dependent variable is average effective tax rate, and they capture the effect of equalization grants by including the national standard average effective tax rate for PIT (interacted with the equalization-receiving dummy variable) as an explanatory variable. They also include the weighted average tax rate of contiguous neighbouring provinces as a separate co-variate in their regression model. Their results suggest that
equalization grants have a significant positive effect on provincial personal income tax rates. Over the years, the Canadian equalization system has passed through various policy changes. One such policy change occurred in 1982, when the federal government adopted the five-province standard instead of the 10-five-province standard that was in effect prior to that. Snoddon exploits this policy change and provides an in-depth examination of the effects of equalization grants on the growth rate of own-source revenue for Canadian provinces.18She uses the change in the number of standard provinces as the main identifying strategy to investigate the short-run revenue effects of equalization grants. Her main objective is to examine whether the equalization reform has an effect on own-source revenue growth in the years following the equalization-grant reform. She estimates the effect of the equalization reform on own-source revenue using dummy variables for the two years immediately following the reform. The 14
Dahlby, “The Incentive Effects.”
15
These studies include, for the Canadian federation: Boessenkool, “Taxing Incentives”; Esteller-Moré and Solé-Ollé, “An empirical analysis”; Snoddon “On Equalization”; and Smart, “Raising taxes.” For Germany: C. Baretti, B. Huber, K. Lichtblau, “A tax on tax revenue: the incentive effects of equalizing transfers: evidence from Germany,”
International Tax and Public Finance9 (2002): 631–649; and Buettner, “The Incentive Effect.” And for Australia: Dahlby and Warren, “The fiscal incentive.”
16
Boessenkool, “Taxing Incentives.”
17
Esteller-Moré and Solé-Ollé, “An empirical analysis.”
18
empirical analysis also employs various dummy variables to capture differential effects associated with equalization-grant receiving provinces and those that are included or excluded from the standard. The analysis is conducted for all provinces and for individual recipient provinces separately. Her empirical results suggest that the reform has a positive effect on the own-source revenue growth of those equalization-grant receiving provinces excluded from the new standard. This is consistent with the general belief that the equalization system influences tax policy incentives. The result, however, is negative for Quebec.
Smart investigates the effects of equalization grants on tax policy, and how the presence of such grants influence tax competition among Canadian provinces.19His theoretical framework provides two testable propositions: equalization grants increase the complementarity of competitors’ tax rates; and, that an increase in the fraction of revenues equalized through the grant allocation formula raises the tax rates of receiving provinces. Using annual Canadian provincial data over the period 1972-2002, he tests the propositions of the theoretical model empirically. In the empirical analysis, he measures the effect of equalization grants on tax policy incentive by looking at the effect of the average effective tax rate of other provinces on the effective tax rate of the province, and distinguishing the differential effects of grants between receiving and non-receiving provinces. An increase in the average effective tax rate of other provinces raises the national standard tax rate that is used in the equalization-grant allocation formula. This in turn increases the equalization grant for receiving provinces. His analysis makes use of this relationship to identify the effects of equalization grants on tax policy incentives. His results indicate that equalization-grant recipient provinces respond more positively to increases in other provinces’ average effective tax rates, suggesting that indeed the equalization system influences tax policy incentives.
Germany is one of the countries that have had a longstanding equalization-grant system. Unlike Canadian provinces, however, German states do not levy their own taxes. Instead, the federal government imposes the taxes and the states collect the tax revenue in their
jurisdictions. In this case, the amount of tax revenue collected in each state depends on the enforcement efforts of the states. Baretti, Huber and Lichtblau examine the effects of
equalizing transfers on tax policy for German states.20They look at how equalization transfers affect states’ tax enforcement, which in turn affects the amount of tax revenue the recipient governments collect. Their ordinary least squares estimation results show that equalizing grants have a negative effect on a state’s tax revenue-to-GDP ratio. They interpret this as a negative effect of equalization grants on tax-enforcement efforts of the states. However, their results become insignificant when they use fixed-effects and other methods. So they find only weak evidence that equalization grants affect tax revenue negatively.
Buettner investigates the effects of equalization transfers on business tax rates for
municipalities in a German state.21The municipal fiscal equalization system in Germany takes into account disparities in fiscal need and fiscal capacity. Buettner introduces a novel idea to distinguish the income effect and the tax-incentive effect associated with the equalization system. He shows that the equalization formula can be written as a difference of two basic components: “virtual grants” and “marginal contribution rate” (times the tax base). The “virtual grant” is the part of an equalization grant that does not depend on the tax base of the recipient 19
Smart, “Raising taxes.”
20
Baretti, Huber and Lichtblau, “A tax on tax.”
21
jurisdiction and it shows the amount of grants that municipalities would receive if their tax bases were zero. The “marginal contribution rate,” on the other hand, captures the fact that when a local government’s tax base increases, in the equalization formula its fiscal capacity rises and as a result it receives smaller grants. In the empirical analysis, he exploits the discontinuity in the equalization-grant formula and uses policy changes to identify the effects of equalization grants on business tax rates. The results indicate that while higher virtual grants are associated with lower business tax rates, a higher marginal contribution rate provides the local governments an incentive to raise their tax rates. Thus, his analysis provides empirical support for the hypothesis that equalization grants influence tax policy incentives.
As in Canada, the Australian equalization-grant allocation formula depends on the fiscal capacity of the state relative to that of the standard fiscal capacity. Dahlby and Warren employ the marginal cost of public funds (MCF) framework to analyze the incentive effects of the Australian equalization system.22They show that equalization grants can affect a state’s tax policies through the “equalization-rate effect” and the “equalization-base effect.” When a state raises its tax rate, the average standard tax rate used in the grant allocation formula increases. This equalization-rate effect results in higher equalization grants for the state, provided that the state’s relative fiscal capacity is low. The equalization-base effect, on the other hand, refers to the increase in equalization grants that results from a reduction in a state’s tax base associated with a rise in its tax rate. They derive a formula for the MCF, which depends on the standard tax rate standard tax base, and the tax base of the state. They show that equalization-rate and – base effects lead to a downward bias of the MCF and provide recipient provinces the incentive to raise their tax rates. They then use data from Australian states to examine the tax-incentive effects of equalization grants. They find somewhat weak empirical evidence that the
equalization system affects Australian states’ tax-rate choices.
While the tax-incentive problem associated with equalization grants is widely discussed in the literature, there is a paucity of studies about the potential incentive effects of such grants on government expenditures. In the literature, the effects of unconditional transfers such as equalization grants on the recipient government’s total expenditure are often discussed in
conjunction with the flypaper effect — a common empirical finding that lump-sum grants increase the recipient subnational government’s expenditure more than an equivalent increase in income. The majority of the flypaper-effect literature concludes that unconditional grants raise total expenditure, providing indirect evidence that equalization grants may also affect total
expenditure.23For the Canadian federation, Winer finds that grants raise provincial expenditure by reducing the perceived cost of provincial public services.24Similar positive effects of unconditional grants on total expenditure are also obtained for other countries by Dahlberg et al.25for Sweden, and Lundqvist26for Finland.
22
Dahlby and Warren, “The fiscal incentive.”
23
For a recent survey of the literature, see: S. Gamkhar and A. Shah, “The impact of intergovernmental transfers: a synthesis of the conceptual and empirical literature,” in Intergovernmental Fiscal Transfers: Principles and Practice
(Washington, D.C.: The World Bank, 2007).
24
S. Winer, “Some evidence on the effect of the separation of spending and taxing decisions,” Journal of Political Economy91 (1983): 126–140.
25
M. Dahlberg et al., “Using a discontinuous grant rule to identify the effect of grants on local taxes and spending,”
Journal of Public Economics92 (2008): 2320–2335.
26
Of course, in addition to their potential effects on total expenditure, equalization grants may influence the composition of government expenditure. In fact, previous studies such as Dahlby,27Hauptmeier,28and Cyrenne and Pandey29suggest that equalization grants influence the composition of government spending. Dahlby investigates this issue using the concept of MCF in the optimal public spending framework.30He uses a simple productive-enhancing public input in the production function. If the public input is labour-augmenting, Dahlby shows that the recipient government will under-provide the public input. Thus, his analysis suggests that equalization grants give recipient governments the incentive to spend relatively more on consumptive expenditures and less on those public services and expenditure that enhance the tax base of the government. The reason is that when governments spend more on tax-base-enhancing expenditures such as education and infrastructure, the tax base of the province increases and this reduces the amount of equalization grant that the province might receive. This gives the province a disincentive to spend on such services. Spending on pure
consumptive services, on the other hand, will not have an adverse effect on the amount of the equalization grant the province receives as tax bases are less likely to be affected by such spending.
Recently, using an endogenous growth model with optimal choice of government expenditure, Cyrenne and Pandey analyze the effects of equalization grants on the composition of
government expenditure.31They assume that the government provides productive public spending that enters the production function and increases economic growth, ultimately raising the fiscal capacity of the government. The government is also assumed to provide
unproductive, or consumptive public services, that enter the utility function. In this model setup, they show that along the balanced-growth path, equalization-grant receiving provinces choose a higher unproductive government-spending ratio than non-receiving provinces. They then test the implications of their theoretical model using Canadian provincial panel data for the period 1989-2009. In their empirical analysis, they first classify provincial expenditures as being “productive” or “unproductive” and use the ratios of these expenditure groups to total expenditure as their dependent variables. They capture the effect of equalization grants on productive or unproductive expenditure ratios by including a dummy variable for equalization-grant recipient provinces among the explanatory variables. Their empirical results show that, while the coefficient of the equalization dummy variable is negative and significant in the productive-expenditure ratio regression, the dummy variable is positive and significant in the unproductive-expenditure ratio equation. They interpret these results as evidence that the share of unproductive government expenditure is higher and the share of productive government expenditure is lower in the recipient provinces compared to non-receiving provinces.
27
Dahlby, “The Incentive Effects.”
28
Hauptmeier, “The impact of.”
29
Cyrenne and Pandey, “Fiscal equalization.”
30
Dahlby, “The Incentive Effects.”
31
For German municipalities, Hauptmeier investigates the effects of equalization transfers on local governments’ expenditure policies.32The author focuses on analyzing the effect of equalization grants on the share of local productive spending (which includes spending on schools and municipal roads). As in Buettner,33he exploits the discontinuity in the German municipal equalization formula and uses a regression discontinuity approach to identify the effects of grants. He finds that equalization transfers have a significant negative effect on local government’s share of productive expenditure.
Overall, the various studies surveyed above suggest that equalization-grant systems affect fiscal policy incentives in recipient subnational governments. In the next section, we explore these issues empirically using Canadian provincial data to shed some light on how the equalization system influences tax policy and government spending incentives.
EQUALIZATION GRANTS AND TAX POLICY
Theoretical framework
In this section, we discuss the theoretical framework that shows how equalization grants influence tax policy incentives of recipient provinces. Let prepresent the province and jdenote the tax category. Then, the per capita total revenue for provincial government pfor tax
category jis given as:
Rpj = τpjBpj + gpj (1)
where Rpjis per capita revenue, τpjis the province’s tax rate for tax category j, Bpjis per capita tax base for the tax category j, and gpjis per capita equalization entitlement of province pfor tax categoryj. Suppose τjdenotes the national standard average tax rate for revenue source j and Bj denotes the standard per capita tax base for revenue category j, then the per capita equalization-grant entitlement related to the jtax source for province pis simply:
gpj = τj(Bj – Bpj) (2a)
where:
τj =
∑p=1τpjBpj
is the national standard tax rate and gpjis the equalization-grant entitlement related to tax category j.
32
Hauptmeier, “The impact of.”
33
Buettner, “The Incentive Effect.”
10 ∑p=110 Bpj
Note that in Equation (2a), the receiving provinces’ tax-rate choices can influence the national standard tax rate, and hence, the amount of grant it receives. If the receiving province is also part of the standard provinces, its tax base also affects the amount of grants that it receives through the change in the standard tax base. So, the grant allocation formula can be influenced by the tax policy choice of the receiving provinces. As our primary focus is to analyze the effect of equalization grants on tax policy incentives, we decompose the equalization allocation formula into two parts: the parts of the formula that canand cannotbe influenced by the tax policy of the recipient province. In order to do that, following Buettner,34we rewrite the grant allocation formula shown in Equation (2a) as:
gpj = ypj – νpjBpj (2b)
where ypjdenotes what Buettner termed as “virtual grants” and it is the amount of equalization grant that province pwould receive if its tax base jwere actually zero. More specifically, the virtual equalization grant for any tax category is calculated as ypj = τ–pj B–pj, where τ–pjis the average effective tax rate of other provinces in the federation and B–pjis the average per capita tax base of standard provinces (excluding the province’s tax base if the province is part of the standard). If the province is not part of the “standard” provinces, then B–pj = Bpj.
Unlike the case of Germany that Buettner examined,35in the Canadian equalization-grant system, νpjis not a fixed parameter. It depends on the national standard tax rate and the relative fiscal capacity of the province — both of which can be influenced by the tax policy choice of the recipient province. We obtain νpjusing the expression
νpj = τ–pj (1 – Πs)– (τpj – τ–pj)
(
Bj– 1
)
,where Πsis the population share of a province p(that is included in the standard) from the total population of all the standard provinces, and the other variables are as defined before. If a province is not part of the standard provinces, Πsis equal to zero. As Smart explains,36the recipient provinces’ tax rates and bases affect the national standard tax rate and, as a result, provincial tax policy choices can influence equalization-grant entitlements. For grant-receiving provinces that are included in the standard, they can also influence equalization entitlements through changes in the standard tax base. Thus, as we will see later, ν captures the effects of a receiving province’s tax policy choice on the amount of equalization-grant entitlements.
34
ibid.
35
ibid.
36
Smart, “Taxation and deadweight.”
In order to discuss the incentive effects of equalization grants on tax policy, we use the marginal cost of public funds (MCF) framework. The MCF shows the cost to society when the government raises $1.00 of tax revenue. In the absence of grants, the MCF for tax categoryj can be calculated as:
MCFpj= Bpj
Bpj + τpj
(
dBpj)
(3)where Bis the tax base and τis the tax rate. In the presence of federal equalization grants to the provinces, using Equation (1), the MCF for the recipient provincial government is given as:
MCFpj= Bpj
(4) Bpj +
[
τpj – νpj]
dBpj – Bpj[
dνpj + dνpj . dBpj]
Equation (4) shows that the presence of equalization grants affect the MCF of the province, and hence, influence the tax policy incentives of the recipient provinces. Note that if νpjwas based on a fixed parameter, as is the case in other federations such as Germany, Equation (4) would be reduced to the MCF expression used in Buettner.37However, in the Canadian federation, as Smart38and Dahlby39discuss, the third expression in the denominator of
Equation (4) is non-zero and the effect of νpjon the MCF is not straightforward. To shed some light on the incentive effects of equalization grants on provincial tax policy, we further simplify the above equation. Using Equation (4) and the definitions of the various variables, following Dahlby and Dahlby and Warren,40we can rewrite the MCF equation as:
MCFpj= 1 , 1 + τpj dBpj + Θ pj + ψpj (5) where: Θpj = ωp
(
BBj – 1)
andψpj = – τj(1 – Πs)εpj. pjωpis the tax-base share of the province in the federation, εpjis the semi-elasticity of the tax base with respect to its own tax rate, and the other variables are as defined previously. Note that, as tax bases normally respond negatively to their own tax-rate changes (except of course when the province is on the downward sloping side of the Laffer curve), εpj < 0 and, as a result, ψpj> 0. When a province raises its tax rate, the tax base shrinks and this results in a fall in its relative fiscal capacity. A fall in the province’s relative fiscal capacity in turn results in an
37
Buettner, “The Incentive Effect.”
38
Smart, “Taxation and deadweight.”
39
Dahlby, “The Incentive Effects.”
40
ibid.; Dahlby and Warren, “The fiscal incentive.”
dτpj
dτpj dτpj dBpj dτpj
increase in its equalization-grant entitlement associated with the tax category. Thus, ψpj captures the increase in the province’s equalization grant caused by the fall in its relative fiscal capacity as its tax base falls (due to the increase in the tax rate). This is the equalization-base effectthat Dahlby, and Dahlby and Warren referred to.41See also Smart for an earlier
discussion of this issue.42 Equation (5) shows that the equalization-base effect, ψ
pj, gives the recipient province’s MCF a downward bias. Thus, this gives the recipient government an incentive to raise its tax rate.
For any given revenue category, when a provincial government raises its tax rate, it raises the national standard average tax rate used in the equalization allocation formula. This increases the recipient government’s equalization-grant entitlement. Dahlby and Warren termed this as the equalization-rate effect.43This equalization-rate effect is denoted by Θ
pjin Equation (5). For provinces that are relatively small and have negligible effects on the national standard tax rate, Θreduces to zero. For this reason, previous studies, such as Smart,44ignore this effect from their analysis. Note also that the effect of Θpjon the MCF depends on whether the per capita tax base of the province is higher or lower than the standard per capita tax base for the specific revenue category. If the province’s per capita tax base is less than the per capita tax base of the standard provinces (as is normally the case for equalization-grant recipients), Θpj will be positive, resulting in a downward bias of the recipient government’s MCF. This provides the recipient government an incentive to raise its tax rate.
Empirical specification and methodology
Based on the theoretical framework discussed above, our empirical analysis of the effects of equalization grants on tax rates for revenue category jcan be specified as:
τpj = f (ypj, ψpj, Θpj; Zp), (6)
where τpjis the tax rate, ypjis the virtual equalization grant associated with the tax category, ψpjis the equalization-base effect, Θpjis the equalization-rate effect, and Zpdenotes a vector of other variables that can influence the tax-rate choices of a province. We are interested in assessing the incentive effects of equalization grants on personal and business income tax rates. These two revenue categories together account for a significant source of revenue for the provincial governments and have been the focus of previous studies as well.45
41
Dahlby, “The Incentive Effects”; Dahlby and Warren, “The fiscal incentive.”
42
Smart, “Taxation and deadweight.”
43
Dahlby and Warren, “The fiscal incentive.”
44
Smart, “Taxation and deadweight.”
45
For instance, for the last year of the period under consideration (fiscal year 2008/2009), these two tax categories account for about 42 per cent of the total tax revenue for the 10 provinces.
The empirical specification can formally be expressed in the following form: τpj,t = α0+α1ypj,t + α2Θpj,t + α3ψpj,t + α4D +
α5 D.Θpj,t + α6D.ψpj,t+ α7 f (Ωpj,t) + α8Zp + εpt (7)
where τpj,tis the average effective tax rate for tax category j in province pin year t, ψpj,tis the equalization-base effectand Θpj,tis the equalization-rate effect. Previous studies, such as Boadway and Hayashi, Esteller-Moré and Solé-Ollé, and Smart,46also used average effective tax rates as dependent variables. Dis an indicator variable that is equal to one if the province is a non-receiving province in the year, or zero otherwise. We control for this indicator variable as our focus is on the incentive effects of grants on the recipient provinces’ tax policy. Zcontains all other relevant control variables.
As we have indicated previously, the Canadian federal government provides equalization grants using a formula that is based on the per capita fiscal capacity of the province and that of the standard provinces. For any revenue category, a province with a fiscal capacity that is below the standard fiscal capacity is entitled to receive equalization grants. Since the fiscal capacity of the province is basically determined by its tax base, it is directly related to the tax policy of the recipient government. This shows that the equalization-grant entitlements are endogenous. A number of previous studies also argue that empirical analysis of the effects of grants on fiscal outcomes should consider grants as endogenous. Previous studies such as Knight, Buettner, and Dahlberg et al.47explain in detail why grants in studies such as ours can be endogenous.
As the equalization-grant formula shows a discontinuity in the relationship between equalization-grant entitlement and fiscal capacity, following Buettner,48we rely on this discontinuity to identify the effects of grants on tax rates. As we discussed before, both the equalization-rate and equalization-base effects depend on the relative fiscal capacity of the province. Since the relative fiscal capacity of the province — the ratio of the per capita tax base of a province to the per capita tax base of standard provinces — can have a direct effect on tax-rate choices, we need to control for this element of the equalization-grant formula to identify the exogenous effects of our key variables of interest on tax policy. In order to achieve this, we need to control for a smooth non-linear function of relative fiscal capacity related to the tax category. In Equation (7), f(Ω)denotes this non-linear function of relative fiscal capacity, Ω. In the empirical analysis, we use various smooth polynomial and spline forms of relative fiscal capacity.
46
R. Boadway and M. Hayashi, “An Evaluation of the Stabilization Properties of Equalization in Canada,” Canadian Public Policy30 (2004): 91–109; Esteller-Moré and Solé-Ollé, “An empirical analysis”; Smart, “Raising taxes.”
47
B. Knight, “Endogenous federal grants and crowd-out of state government spending: Theory and evidence from the federal highway aid program,” American Economic Review92 (2002): 71–92; Buettner, “The Incentive Effect”; Dahlberg et al., “Using a discontinuous.”
48
Our empirical analysis is based on panel data from all the 10 provinces. We use equalization entitlements related to the two tax categories rather than actual equalization grants in our analysis of tax policy incentives. During the period under consideration, Alberta and Ontario did not receive any equalization grants. British Columbia, Saskatchewan and Newfoundland also did not receive equalization grants in some years. In order to capture the incentive effects of equalization grants only for receiving provinces, we include, D, a dummy variable that is equal to one if the province does not receive equalization grants. Then, we control for the interaction terms between this dummy variable and the equalization-rate and -base effects. In the empirical specification of Equation (7), our key coefficients of interest are α2and α3. These coefficients capture the equalization-rate and -base effects for recipient provinces, respectively. While the coefficient estimates shed light on the direction of the equalization incentive effects on tax policy, the numerical magnitude of the coefficients do not have straightforward interpretations. The theoretical model suggests that, for grant recipients, the equalization-rate effect (Θpj,t) has a positive effect on tax rates provided that the province’s fiscal capacity is lower than that of the standard provinces. Thus, we expect that α2> 0. A positive and statistically significant coefficient estimate for α2can be considered as evidence of presence of the equalization-rate effect. As we have indicated previously, this effect is
important for large equalization-grant recipient provinces such as Quebec, but less so for smaller Atlantic provinces. So, in the empirical analysis, the equalization-rate effect may be strongly influenced by Quebec.49We also anticipate the equalization-rate effect to be particularly important for business income taxes as provinces generally tend to compete to attract businesses to their jurisdictions. For non-receiving provinces, one can obtain the equalization-rate effect as (α2+ α5). According to the simple theoretical framework, we also expect that α3> 0. That is, the equalization grant provides an incentive for a recipient province to raise its tax rate through the equalization-base effect (ψpj,t). Unlike the equalization-rate effect, the equalization-base effect is important for all receiving provinces. In addition, for all provinces, the personal income tax base is larger than the business income tax base. As a result, we anticipate the equalization-base effect to be stronger for personal income tax.
As in Smart,50we include the weighted-average (weighted by population) average effective tax rate of other provinces as a control variable. This variable enters as a one-period lagged variable, as tax competition literature suggests that normally governments need some time to adjust their tax policies in response to the policy changes of their neighbours. We also control for various economic, demographic and political variables that capture the expenditure needs of the government. More specifically, as in Smart,51we control for the share of the population that is 65 years of age and above (“Old”), the share of the population that is below 20 years of age (“Young”), and the unemployment rate. We also include non-equalization grants as an additional co-variate.
49
We conduct a sensitivity analysis to check if the results are robust to the exclusion of Quebec from the analysis.
50
Smart, “Raising taxes.”
51
It is well known that a tax policy decision is often influenced by the political ideology of the governing party. Left-leaning governments generally have a tendency to raise income tax rates. Thus, we capture this ideological effect on tax policy by including a dummy variable that is equal to one if the premier of the province belongs to the Liberal party or the New Democratic Party (NDP), which are the centre-left political parties in Canada. The literature on elections and fiscal policy indicate that governments may adjust their tax policy to improve their chances of re-election. We control for this possibility by including a dummy variable that is equal to one if there is an election in the following year in our set of control variables.
Data
In our empirical analysis, we use administrative data obtained from Finance Canada. The administrative dataset includes raw data used to calculate equalization entitlements for each province and revenue category. These data are used to compute the average effective business income tax rate as the ratio of tax revenue to tax base. The average effective personal income tax rate is also calculated as the ratio of the administrative personal income tax revenue data used in the equalization allocation formula to provincial taxable income. The administrative data are also used to calculate the national standard average tax rate as the sum of provincial revenue divided by the sum of tax bases for business income tax. We also use the same dataset to compute per capita tax base of standard provinces as the sum of the tax bases in the five-standard (or 10, as the case may be) provinces by the sum of the population of the standard provinces.
The equalization-base-effect and the equalization-rate-effect variables require information on the national standard average tax rate, the population share of the standard province (relative to the total population of the standard provinces) and the own semi-elasticity estimates. For business income tax, data on the national standard average tax rates are obtained from Finance Canada as indicated above. For personal income tax, we compute the national standard average tax rate using administrative personal income tax revenue data used in the equalization
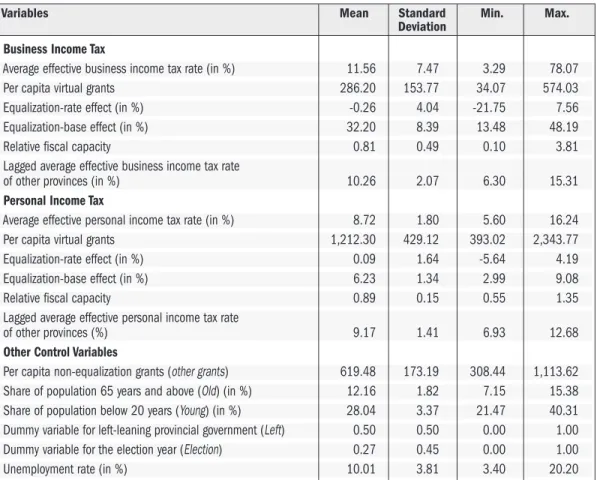
allocation formula and provincial taxable income as the tax base. The data set on provincial taxable income was obtained from various issues of Income Statistics(formerlyTax Statistics on Individuals) published by the Canada Revenue Agency. The data for the various federal grants to provincial governments and tax bases are obtained from the same dataset. Annual provincial data on personal income, GDP deflator, population, unemployment rate, and the number of new immigrants, comes from Statistics Canada database (CANSIM). The data on governing political parties and elections are from the Canadian Parliamentary Guide. The own semi-elasticity estimates are obtained from Dahlby and Ferede.52Their preferred own semi-elasticity estimates for the corporate income and personal income taxes were -3.671 and -0.762, respectively. We use these estimated semi-elasticity values to compute the equalization-base effects for business income and personal income taxes, respectively.53The equalization-rate-effect variable is also computed using the tax-base data obtained from Finance Canada. Table 1a provides summary statistics for the various variables used in our tax-rate regressions.
52
B. Dahlby and E. Ferede, “The effects of tax rate changes on tax bases and the marginal cost of public funds for provincial governments,” International Tax and Public Finance19 (2012): 844–883.
53
Notice that since the own semi-elasticity estimates are constant (and the same for all provinces), they simply scale the equalization-base effects. The underlying results would not change if one prefers not to use elasticity estimates as in Dahlby and Warren, “The fiscal incentive.”
TABLE 1A: SUMMARY STATISTICS FOR VARIABLES IN THE TAX-RATE REGRESSIONS, 1981-2008
Note: For lagged average effective tax rate of other provinces, the number of observations is 270; for all others it is 280.
Empirical results and discussions
In this section, we present the empirical analysis related to the effects of equalization grants on business income and personal income tax policy incentives. While Table 2 presents the
regression results for business income tax, the corresponding results for personal income tax are shown in Table 3. All regressions control for provincial fixed effects, province-specific time trends and non-linear form of relative fiscal capacity, as indicated, but we do not report their coefficient estimates for the sake of brevity. Note also that the result tables provide standard errors that are robust to heteroskedasticity and autocorrelation
Business Income Tax
Average effective business income tax rate (in %) 11.56 7.47 3.29 78.07 Per capita virtual grants 286.20 153.77 34.07 574.03 Equalization-rate effect (in %) -0.26 4.04 -21.75 7.56 Equalization-base effect (in %) 32.20 8.39 13.48 48.19 Relative fiscal capacity 0.81 0.49 0.10 3.81 Lagged average effective business income tax rate
of other provinces (in %) 10.26 2.07 6.30 15.31
Personal Income Tax
Average effective personal income tax rate (in %) 8.72 1.80 5.60 16.24 Per capita virtual grants 1,212.30 429.12 393.02 2,343.77 Equalization-rate effect (in %) 0.09 1.64 -5.64 4.19 Equalization-base effect (in %) 6.23 1.34 2.99 9.08 Relative fiscal capacity 0.89 0.15 0.55 1.35 Lagged average effective personal income tax rate
of other provinces (%) 9.17 1.41 6.93 12.68
Other Control Variables
Per capita non-equalization grants (other grants) 619.48 173.19 308.44 1,113.62 Share of population 65 years and above (Old) (in %) 12.16 1.82 7.15 15.38 Share of population below 20 years (Young) (in %) 28.04 3.37 21.47 40.31 Dummy variable for left-leaning provincial government (Left) 0.50 0.50 0.00 1.00 Dummy variable for the election year (Election) 0.27 0.45 0.00 1.00 Unemployment rate (in %) 10.01 3.81 3.40 20.20
Variables Mean Standard Min. Max. Deviation
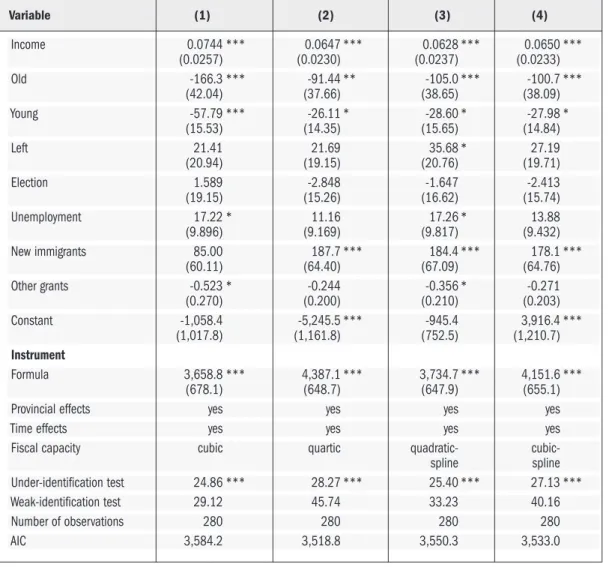
TABLE 2: BUSINESS INCOME TAX REGRESSION, 1981-2008
Notes: Dependent variable is average effective business tax rate. All regressions include provincial fixed-effects and province-specific time trends. Robust standard errors in parentheses. Significance levels are indicated by *** for one per cent, ** for five per cent, and * for 10 per cent.
a The coefficient is divided by 100.
Virtual grant -0.0218 ** -0.0201 ** -0.0242 ** -0.0260 *** -0.0199 ** -0.0260 ** (0.00995) (0.00871) (0.00982) (0.00984) (0.00930) (0.0100) Rate effect -0.248 -0.270 -0.461 -0.536 -0.236 -0.594 (0.362) (0.327) (0.451) (0.378) (0.442) (0.431) Base effect 0.247 *** 0.216 *** 0.371 ** 0.381 ** 0.347 * 0.383 ** (0.0662) (0.0685) (0.178) (0.177) (0.180) (0.177) Non-receiving (Non) -3.273 -9.394 ** -1.703 -8.597 * -0.957 -7.052 (4.844) (4.155) (5.938) (4.855) (6.248) (4.936) Non-X rate effect -0.490 0.151 -0.415 0.532 -0.885 0.341 (0.297) (0.300) (0.466) (0.433) (0.636) (0.410) Non-X base effect 0.173 * 0.317 *** 0.152 0.299 ** 0.148 0.280 **
(0.101) (0.120) (0.121) (0.124) (0.121) (0.117) Other provinces’ tax rate -0.228 -0.406 -0.0801 -0.347 (0.421) (0.370) (0.471) (0.384) Other grantsa 0.00650 0.00486 0.00667 0.00564 (0.00587) (0.00473) (0.00610) (0.00521) Old 1.334 1.681 1.331 1.630 (1.541) (1.555) (1.519) (1.581) Young 1.299 2.321 * 0.795 2.161 * (1.033) (1.211) (0.909) (1.220) Left 0.218 0.326 0.239 0.324 (1.275) (1.242) (1.299) (1.261) Election -0.345 -0.282 -0.308 -0.306 (1.022) (0.943) (1.082) (0.980) Unemployment -0.404 -0.702 -0.250 -0.660 (0.413) (0.470) (0.377) (0.465)
Relative fiscal capacity quadratic cubic quadratic cubic linear- quadratic-spline spline No. of observations 280 280 270 270 270 270 Adjusted R-squared 0.376 0.427 0.388 0.462 0.353 0.434
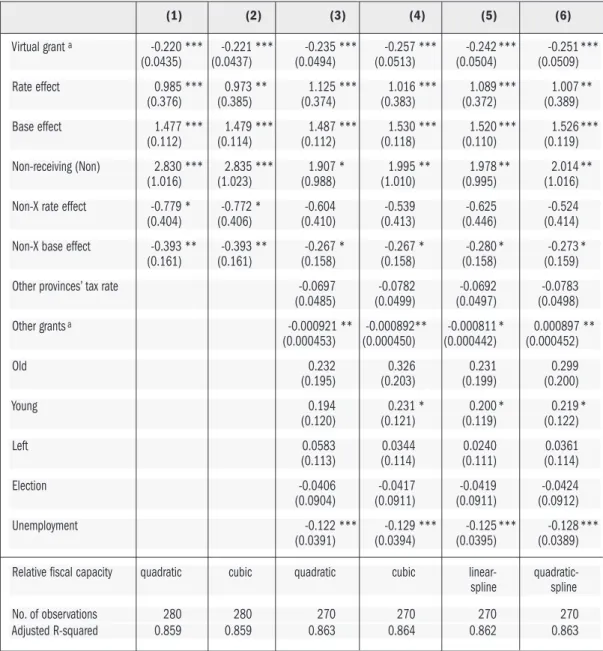
TABLE 3: PERSONAL INCOME TAX REGRESSION, 1981-2008
Notes: Dependent variable is average effective personal income tax rate. Provincial fixed-effects and province-specific time trends are included in all regressions. Robust standard errors in parentheses. Significance levels are indicated by *** for one per cent, ** for five per cent, and * for 10 per cent.
a The coefficient is divided by 100.
We begin in column (1) of Tables 2 and 3 by estimating our basic regression model with an ordinary least squares (OLS) estimation method. The dependent variables are average effective tax rates and we control for a quadratic form of relative fiscal capacity. Our results show that, as in Buettner,54the virtual grant is negative and statistically significant. This shows that virtual grants have a negative effect on tax rates. The reason is that virtual grants raise the financing capacity of provincial governments and, as a result, enable them to finance any given amount
54
Buettner, “The Incentive Effect.”
Virtual grant a -0.220 *** -0.221 *** -0.235 *** -0.257 *** -0.242 *** -0.251 *** (0.0435) (0.0437) (0.0494) (0.0513) (0.0504) (0.0509) Rate effect 0.985 *** 0.973 ** 1.125 *** 1.016 *** 1.089 *** 1.007 ** (0.376) (0.385) (0.374) (0.383) (0.372) (0.389) Base effect 1.477 *** 1.479 *** 1.487 *** 1.530 *** 1.520 *** 1.526 *** (0.112) (0.114) (0.112) (0.118) (0.110) (0.119) Non-receiving (Non) 2.830 *** 2.835 *** 1.907 * 1.995 ** 1.978 ** 2.014 ** (1.016) (1.023) (0.988) (1.010) (0.995) (1.016) Non-X rate effect -0.779 * -0.772 * -0.604 -0.539 -0.625 -0.524 (0.404) (0.406) (0.410) (0.413) (0.446) (0.414) Non-X base effect -0.393 ** -0.393 ** -0.267 * -0.267 * -0.280 * -0.273 *
(0.161) (0.161) (0.158) (0.158) (0.158) (0.159) Other provinces’ tax rate -0.0697 -0.0782 -0.0692 -0.0783 (0.0485) (0.0499) (0.0497) (0.0498) Other grantsa -0.000921 ** -0.000892** -0.000811 * 0.000897 ** (0.000453) (0.000450) (0.000442) (0.000452) Old 0.232 0.326 0.231 0.299 (0.195) (0.203) (0.199) (0.200) Young 0.194 0.231 * 0.200 * 0.219 * (0.120) (0.121) (0.119) (0.122) Left 0.0583 0.0344 0.0240 0.0361 (0.113) (0.114) (0.111) (0.114) Election -0.0406 -0.0417 -0.0419 -0.0424 (0.0904) (0.0911) (0.0911) (0.0912) Unemployment -0.122 *** -0.129 *** -0.125 *** -0.128 *** (0.0391) (0.0394) (0.0395) (0.0389) Relative fiscal capacity quadratic cubic quadratic cubic linear- quadratic-spline spline No. of observations 280 280 270 270 270 270 Adjusted R-squared 0.859 0.859 0.863 0.864 0.862 0.863
of government spending at a lower tax rate. The virtual grant coefficient estimates show the effects of equalization grants on tax rates if the grant system were actually not based on fiscal capacity. If we consider a hypothetical situation where the equalization grants are substituted with block grants that do not depend on recipient provinces’ fiscal capacity, a $100 per capita increase in such grants is associated with a fall in business and personal income tax rates by about 2.2 and 0.22 percentage points, respectively.
The results in column (1) of tables 2 and 3 also show that, as expected, the equalization-base effect is positive and statistically significant at a five per cent level or better for both regressions. However, the equalization-rate effect is statistically significant only for personal income tax. Thus, the results suggest that equalization grants provide an incentive for provinces to raise the business income tax rate only through the equalization-base effect. For personal income tax, on the other hand, our results indicate that equalization grants affect the tax policy incentives through both equalization-base and -rate effects. The results suggest that a one percentage point increase in the equalization-base effect is associated with a 0.25 and 1.5 percentage point increase in the business and personal income tax rates, respectively. Similar results are also obtained in column (2) when we control for a cubic form of relative fiscal capacity.
In column (3), we control for a quadratic form of relative fiscal capacity and include additional co-variates to capture the effects of economic, demographic, and political factors that
potentially influence tax policy. Again, the equalization-base effect continues to be positive and statistically significant for both business income and personal income taxes, while the
equalization-rate effect is statistically significant only in the latter.
In column (4), as in column (3), we include all the control variables and use a cubic form of relative fiscal capacity. Based on adjusted R-squared, the regression with cubic specification for fiscal capacity shows the best fit for the data. Our results indicate that in a hypothetical scenario where the equalization grants are substituted with block grants, a $100 per capita increase in such grants is associated with a fall in business and personal income tax rates by about 2.6 and 0.26 percentage points, respectively.
The results also show that the equalization-base effect is again positive and statistically significant at the five per cent level or better in both tax-rate regressions. However, the equalization-rate effect is again not statistically significant for business income tax, but it is statistically significant at five per cent level for personal income tax. Thus, the empirical results indicate that, for business income tax, the effects of equalization grants on business-income-tax policy incentive works through the tax-base effect. For personal income tax, however, both the equalization-base and -rate effects seem to be important in influencing the tax policy incentives.55The regression results suggest that a one percentage point increase in the equalization-base effect is associated with 0.38 percentage point increase in the business income tax rate and a 1.5 percentage point increase in the personal income tax rate. Thus, our results are consistent with the widely held view that the Canadian equalization system provides the recipient provinces the incentive to raise their tax rates.
55
Partly because of the federal government’s Quebec abatement program, personal income tax rates in Quebec are generally higher than those of other provinces. Thus, one may wonder if the statistical significance of the equalization-rate effect in only the personal income tax equalization-rate regressions is driven by Quebec. As the sensitivity analysis in the following section reveals, the statistical significance of the equalization-rate effect disappears once we exclude Quebec. Thus the equalization-rate effect in the personal income tax rate regression may indeed be driven by Quebec.
So far, we rely on using polynomial specifications for relative fiscal capacity. However, theoretically, other forms of smooth functional forms can also be employed. To check if our main result that equalization grants affect tax policy incentives is robust to other forms of specification, in columns (5) and (6), we control for linear-spline and quadratic-spline form of relative fiscal capacity, respectively. The results are qualitatively similar to what we found before, suggesting that the results are robust to the form of non-linear function of relative fiscal capacity. In general, our results suggest that equalization grants provide recipient provincial governments an incentive to raise their business income and personal income tax rates. Thus, the results provide empirical support to the hypothesis that equalization grants provide an incentive to recipient governments to raise tax rates. And we find that this incentive effect works through the equalization-base effect for business income tax and through both equalization-base and -rate effects for personal income tax. That is, when provincial
governments raise their income tax rates, their tax bases fall and this increases the amount of equalization entitlements. Dahlby and Warren56find similar results for Australia.
Robustness checks
We conduct a sensitivity analysis to check the robustness of our preferred regression results of tables 2 and 3. The results are shown in Table 4 below.
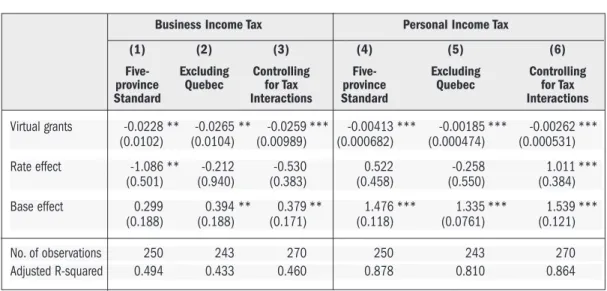
TABLE 4: SENSITIVITY ANALYSIS
Notes: Dependent variable is average effective tax rate. The robustness checks are conducted based on our preferred regression results of column (4) of Tables 3 and 4 and we use the same set of control variables used in the preferred regressions. Robust standard errors in parentheses. Significance levels are indicated by *** for one per cent, ** for five per cent, and * for 10 per cent. Provincial fixed-effects, province-specific time trends and all other control variables are included but not reported.
56
Dahlby and Warren, “The fiscal incentive.”
Virtual grants -0.0228 ** -0.0265 ** -0.0259 *** -0.00413 *** -0.00185 *** -0.00262 *** (0.0102) (0.0104) (0.00989) (0.000682) (0.000474) (0.000531) Rate effect -1.086 ** -0.212 -0.530 0.522 -0.258 1.011 *** (0.501) (0.940) (0.383) (0.458) (0.550) (0.384) Base effect 0.299 0.394 ** 0.379 ** 1.476 *** 1.335 *** 1.539 *** (0.188) (0.188) (0.171) (0.118) (0.0761) (0.121) No. of observations 250 243 270 250 243 270 Adjusted R-squared 0.494 0.433 0.460 0.878 0.810 0.864
Business Income Tax Personal Income Tax
(1) (2) (3) (4) (5) (6) Five- Excluding Controlling Five- Excluding Controlling province Quebec for Tax province Quebec for Tax Standard Interactions Standard Interactions
During the period under consideration, the number of standard provinces change from 10 provinces to five provinces, and more recently, back to 10 provinces. To check if this change in the number of standard provinces influences our results, we do the analysis only for the period where the five-province standard was in place. As results in columns (1) and (4), our results are robust to the change in the number of standard provinces.
As compared to other provinces, Quebec has various unique fiscal features. For example, it is the only province that receives the federal tax abatement. It is also the largest of all the equalization-grant recipient provinces, and as such, we expect the equalization-rate effect to be stronger and more relevant for the province. In columns (2) and (5), we exclude Quebec from our analysis. The results show that, while the virtual grants and the equalization-base effects continue to be statistically significant with their respective expected signs, the equalization-rate effect is now insignificant in the personal income tax-rate regression.This suggests that the statistical significance of the equalization-rate effect in the personal income tax regression that we find in the previous section is driven by Quebec.
As previous studies indicate, business and personal income tax rates are related in many ways and may influence each other. Thus, one may suspect that personal income tax rate may influence the incentive effects of business income tax rate and vice versa. To capture this, we include the personal income tax rate and the business income tax rate as additional control variables in columns (3) and (6), respectively. Again, our results are robust to this sensitivity check. In sum, our empirical analysis provides empirical evidence that the Canadian equalization system influences recipient provinces tax policy incentives. These incentive effects seem to work mainly through the equalization-base effect. The results also show that virtual grants have statistically significant negative effects on tax rates. The policy implication of this is that if the current equalization grants are substituted with block grants that are not related to the fiscal capacity of the provinces, provincial tax rates will be lower.
EQUALIZATION GRANTS AND GOVERNMENT EXPENDITURE
Empirical specification and methodology
We now examine the effects of equalization grants on the level and composition of provincial expenditures. In the previous section, we have seen that equalization grants provide receiving provinces an incentive to raise their tax rates, which in turn, affects their tax base and the amount of equalization-grant entitlements. Provincial expenditures may also have the power to influence the tax bases of provinces, which in turn affects their equalization grants. In fact, theoretical studies, such as Dahlby,57and Cyrenne and Pandey,58show that equalization grants can affect both the level and the composition of government expenditure. Equalization grants may influence provincial governments to spend less on tax-base-enhancing expenditures and more on consumptive expenditures. Thus, the composition of provincial expenditure can be
57
Dahlby, “The Incentive Effects.”
58
influenced by equalization grants. The literature on the flypaper effects also show that lump-sum grants, such as equalization grants, can stimulate receiving jurisdictions’ expenditure. See Gamkhar and Shah59and the references contained therein. Thus, equalization grants can influence both the level and composition of provincial spending.
In order to analyze the effect of equalization grants on the level and composition of provincial spending, we use the following basic specification:
Ep,t = β0+β1Gp,t + β2X + up,t (8)
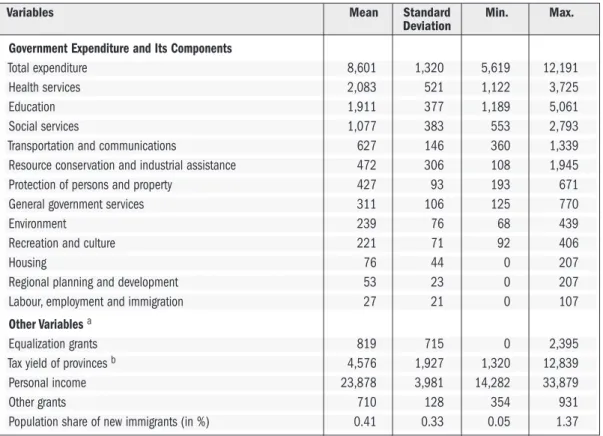
where Ep,tis the real per capita total (or category of) government expenditure in province pin year t, Gp,tis real per capita equalization grants, and Xcontains all other relevant control variables. Note that, due to the variation in local government expenditure responsibilities and the corresponding differences in provincial governments’ own expenditures, we have used consolidated provincial and local spending as the dependent variable in our regression models. Empirical specifications similar to Equation (8) are quite commonly used in the literature. Our empirical specification is very close to that of Shelton.60Mauro61also analyzed the impact of corruption on the composition of government expenditure, however he used government spending as a ratio of GDP as a dependent variable. Notice that our empirical methodology in this section is different than what we employed in the previous section, as it is not feasible to construct virtual grants for the total equalization grants and decompose the equalization-grant effects into income and incentive effects. It is also important to note that we use actual
equalization grants rather than equalization entitlements associated with a specific tax category as we did in the previous section. As a result of this, the empirical methodology employed in this section is different than what we use in the tax policy incentive analysis.
In addition to the total provincial expenditure, we examine the effects of equalization grants on 12 provincial expenditure categories.62These categories include government expenditure on: health services (“Health”), education (“Education”), social services (“Social”), transportation and communication (“TransComm”), resource conservation and industrial assistance
(“Resource”), protection of persons and property (“Protection”), general government services (“Government services”), environment (“Environment”), recreation and culture (“Recreation”), housing (“Housing”), regional planning and development (“Regional”), and labour, employment and immigration (“Labour and immigration”). Cyrenne and Pandey63also study the effect of equalization grants on expenditure compositions by dividing expenditure into two broad
categories (i.e., productive or unproductive), rather than studying each individual category as we do in this paper. Although such classification simplifies empirical analysis, it is clear that each expenditure category may include both productive and unproductive spending elements. 59
Gamkhar and Shah, “The impact.”
60
C. A. Shelton, “The Size and composition of government expenditure,” Journal of Public Economics91 (2007): 2230–2260.
61
P. Mauro, “Corruption and the composition of government expenditure,” Journal of Public Economics69 (1998): 263–279.
62
While the expenditure categories are disaggregated, it is important to note that they are sufficiently broad so that spending within a given category could include both tax-base-enhancing and consumption elements. This problem also equally applies even to those studies that arbitrarily classify spending categories as productive or non-productive.
63