Cost-Performance of
Fault Tolerance in Cloud Computing
∗Y.M. Teo1,2, B.L. Luong1, Y. Song2 and T. Nam3
1Department of Computer Science, National University of Singapore 2Shanghai Advanced Research Institute, Chinese Academy of Sciences, China
3Faculty of Computer Science & Engineering, Ho Chi Minh University of Technology, Vietnam
email: teoym@comp.nus.edu.sg
October 28, 2011
Abstract
As more computation moves into the highly dynamic and distributed cloud, applications are becoming more vulnerable to diverse failures. This paper presents a unified analytical model to study the cost-performance tradeoffs of fault tolerance in cloud applications. We compare four main checkpoint and recovery techniques, namely, coordinated checkpointing, and unco-ordinated checkpointing such as pessimistic sender-based message logging, pessimistic receiver-based message logging (PR), and optimistic receiver-receiver-based message logging (OR). We focus on howapplication size, checkpointing frequency, network latency, andmean time between failures influence the cost of fault tolerance, expressed in terms of percentage increase in application execution time. We further study the cost of fault tolerance in cloud applications with high probability of failure, network latency and message communication among executing processes (virtual machines). Our analysis shows that the cost of fault tolerance for both OR and PR is around 5% for the range of application size (32 to 4,096 processes or virtual machines), check-pointing frequency (one checkpoint per minute to one checkpoint per hour) and network latency (Myrinet to Internet) evaluated. For a cloud with high network latency, the cost of fault tol-erance is about 5% in both OR and PR, but when failure probability is low, OR is a suitable choice and when failures are more frequent, PR is a better candidate.
1
Introduction
A current trend in high performance computing (HPC) is the massive exploitation of multi-core and many-core for performance [5]. Systems with hundreds or thousands of processors are becoming a commonplace. These systems, with a larger number of components and where application execution is highly distributed, are more vulnerable to errors and failures that limits the system performance and scalability. Another development is the use of cloud computing for HPC where an application is partitioned into a pool of tasks for execution on virtualized computing resources distributed across
∗
Y.M. Teo, B.L. Luong, Y. Song, T. Nam, Cost-Performance of Fault Tolerance in Distributed Systems, Interna-tional Conference on Advanced Computing and Applications, (Special Issue of Journal of Science and Technology, Vol. 49(4A), pp. 61-73), Ho Chi Minh, Vietnam, October 19-21, 2011.
wide-area networks such as the Internet [4]. Besides the higher probability of failure, another factor that influences fault tolerance cost is high network latency in cloud systems. Many fault tolerant strategies have been proposed such as user and programmer detection and management, pseudo-automatic programmer-assisted and fully pseudo-automatic and transparent [19]. For fully pseudo-automatic and transparent methods, checkpointing and rollback recovery is a promising approach, especially for large-scale systems, because of its simplicity and lower cost. In checkpointing, the main aim is to replay the failed program from pre-saved point rather than to reexecute the program from scratch. To do so, it is necessary to save the state of each process, called a checkpoint, periodically on stable storage [6]. In message logging, messages sent between processes are saved instead and replayed when there is a failure [3].
Despite the long history of fault tolerance in distributed systems, there are very few comparison studies of the checkpointing and recovery approach, in particular, cloud computing where both the application and the virtual machine resources are highly distributed over high latency networks. In this paper, we present a unified analytical model to evaluate the cost-performance tradeoffs for four main methods, namely, coordinated checkpointing, pessimistic sender-based message logging, pessimistic receiver-based message logging, and optimistic receiver-based message logging. Firstly, we evaluate four key factors that influence the performance of fault tolerance, namely, application size, network latency, checkpointing frequency and failure probability. Secondly, we study the cost of fault tolerance in cloud computing. We investigate the fault tolerant cost for widely distributed cloud infrastructure where network latency is high among processing resources and consequently, a higher probability of failure, and cloud applications with different communication frequency among cooperating processing resources.
The paper is organized as follows. Section 2 discusses related work. Section 3 presents our pro-posed analytical cost model for comparing four main fault tolerance approaches. In section 4, we discuss the effects of varying four key parameters on the cost of fault tolerance, and we further evaluate the fault tolerant cost in cloud applications with high failure probability and high message communication among processes. Section 5 summarises our key observations and limitation of our model.
2
Related Work
Many fault tolerant methods that adopt checkpointing in message-passing systems are based on the seminal article by Chandy and Lamport [6]. Inuncoordinated checkpointing, each process takes its own independent checkpoints. A process may keep multiple checkpoints but some are useless because they do not contribute towards a global consistent state. One of the most severe drawbacks is the domino rollback effect [9] whereby all processes have to restart their computation from the beginning. This can be overcome by combining uncoordinated checkpointing with message log-ging. Message logging is divided intosender-based [14] orreceiver-based [21] depending on whether the sender or the receiver is responsible for logging. Messages can also be logged pessimistically,
optimistically, or causally [3]. However, coordinated checkpointing addresses these issues by coor-dinating all processes to form a consistent global state [6]. Communication-induced checkpointing
provides resilience to the domino effect without global coordination across all checkpoints [2]. Be-sides local checkpoints that are taken independently, forced checkpoints are introduced to prevent the creation of useless checkpoints. Other fault tolerant approaches arecooperative checkpointing -a technique for dyn-amic checkpoint scheduling [15] -andgroup-based checkpointing [12]. Despite the
advantages, these two methods are not considered in this study. Firstly, cooperative checkpointing is not user-transparent and generally does not scale well. Secondly, to the best of our knowledge, there has been no practical implementation of group-based checkpointing. In this paper, we focus on four main checkpointing techniques, namely, coordinated checkpointing, pessimistic sender-based checkpointing, pessimistic receiver-based checkpointing, and optimistic receiver-based checkpoint-ing.
Many fault tolerant studies focus on optimal checkpoint interval, scalability, failures during check-pointing and recovery among others. Young studies optimal checkpoint interval problem [24]. Daly presents a modification of Young’s model for large-scale systems to account for failures dur-ing checkpointdur-ing and recovery as well as multiple failures in a sdur-ingle computation interval [7, 8]. Tantawi and Ruschitzka develop a theoretical framework for performance analysis of checkpointing techniques [22]. They propose theequicost checkpointing strategy that varies the checkpoint inter-val based on a tradeoff between checkpointing cost and the likelihood of failure. In contrast, we propose a unified model for understanding the cost-performance tradeoffs for different approaches, and for simplicity, our study assumes that checkpoint interval is fixed and failure arrivals follow the Poisson distribution, there is no failure during checkpointing and recovery, and there is at most one failure in a checkpoint interval. Wu introduces performance models to predict the application performance of uncoordinated checkpointing [23]. Jin [13] proposes a model to predict the appli-cation completion time using coordinated checkpointing, and considers a wide range of parameters including workload, number of processes, failure arrival rate, recovery cost, checkpointing interval, and overhead. In this paper, we focus on the performance of fault tolerance by understanding the effects of application size, checkpointing frequency, network latency, and mean time between fail-ures for four main approaches. In particular, we study the relevance of these approaches in cloud computing where network latency is larger and with a higher failure probability.
Elnozahy and Plank [11] study the impact of coordinated checkpointing for peta-scale systems and discuss directions for achieving performance under failures in future high-end computing environ-ments. Their results show that the current practice of using “cheap commodity” systems to form large-scale clusters may face serious obstacles. One of the problems confirmed in our analysis is that cost of fault tolerance for coordinated checkpointing heavily depends on the number of processes. Without the knowledge of applications, checkpointing strategies usually checkpoint periodically at an interval determined primarily by the overhead and the failure rate of the system. Unfortunately,
periodic checkpointing does not scale with the growing size and complexity of systems [16]. For large-scale systems like BlueGene/L [1], their results suggest that overzealous checkpointing with high overhead can amplify the effects of failures. The analysis is confirmed in [15]. We consider periodic coordinated checkpointing and our evaluation confirms its lack of scalability.
3
Analytical Cost Model
In this section, we present a simple analytical model for evaluating the cost of fault tolerance in cloud computing. We introduce key model assumptions and parameters before the cost model for checkpointing and recovery techniques. First, assuming a cloud application, such as an MPI program, that is decomposed into nlogical processes that communicate through message-passing. Each process is executed on a virtual machine and sends a message to the remainingn−1 processes with equal probabilities. Second, time is assumed to be discrete, and message sending, checkpointing and faults are independent. Third, a process is modelled as a sequence of deterministic events
or piecewise deterministic [21]. Fourth, failures follow the fail-stop model [18] whereby a faulty process loses its volatile state and stops responding to the rest of the system. Lastly, failures occur with equal probability at any point between successive checkpoints and without failures during checkpointing or recovery. Thus, we can model the cost of fault tolerance for each process instead of the whole system. As shown in figure 1, our proposed cost model consists of three main groups of input parameters to model the cloud application, cloud execution environment and the fault-tolerant techniques respectively. Let P(m) denotes the probability that a process
Analytical Cost Model Application n, P(m) percentage increase in runtime (C) Techniques P(c), P(l), Cp, Co Cloud P(f), Cnw, Cc, Crb, Cr, Cor
Figure 1: Proposed Cost Model
generates an application message or models the degree of message-passing among processes. A cloud execution platform is characterized by six parameters. P(f) denotes the probability of failure or the inverse of MTBF (mean time between failures). Let Cnw, Cc, Crb, Cr, and Cor denote the
average network latency of an application or control message, average time to write a checkpoint to stable storage, average time to rollback a failed process, average time to restore a logged message from stable storage, and average time to rollback an orphan process respectively. When failures occur before message logs in a process are committed, processes that are dependent on these lost messages become orphan processes if they are not rolled back. Four parameters characterize the checkpointing and recovery techniques. Let P(c), P(l), Cp and Co denote the probability that a
process initiates checkpointing, probability of optimistic logging, average time to store a message to stable storage and including the process blocking time in pessimistic logging respectively. In optimistic logging, blocking of application execution is reduced by first writing the logs to volatile storage and periodically to stable storage. Thus, Cp is greater than Co. Secondly, Crb is greater
thanCorbecause the cost of rolling back a failed process includes identifying a new recovery process
and restoring the checkpoint image and logged messages. Rollback of an orphan process, however, can be done on the same process. The cost of fault tolerance per process (C) is measured in terms of percentage increase in execution time.
LetT be the execution time of a process without fault tolerance. The overhead for a process with fault tolerance includes checkpointing (CP), message logging (M L) and failure recovery (RO). Thus, the cost of fault tolerance per process is
C= CP +M L+RO
T ∗100 (1)
Characterizing the cost of fault tolerance is a complex multi-parameter problem. For simplicity, we focus on the impact of four key parameters: n, P(f), Cnw and P(c). Next, we present our
fault tolerance cost model for coordinated checkpointing, pessimistic sender-based message logging, pessimistic receiver-based message logging, and optimistic receiver-based message logging. Coor-dinated checkpointing is the most popular fault tolerance technique in the literature with many studies as well as implementations in real platforms. Three other uncoordinated schemes also have several advantages to provide resilience for high performance systems, especially large-scale ones. Moreover, we leave the remaining uncoordinated checkpointing approach, optimistic sender-based message logging, for further study.
3.1 Coordinated Checkpointing (CO)
In coordinated checkpointing, processes orchestrate checkpoints to form a consistent global state. Coordinated checkpointing simplifies recovery and is not susceptible to the domino effect because every process always restarts from its latest checkpoint. Each process maintains one permanent checkpoint on stable storage to reduce storage overhead and eliminates garbage collection. Prakash and Singhal [17] propose a non-blocking coordinated checkpointing technique that reduces the number of processes to take checkpoints. We consider the algorithm [10] where the checkpointing initiator forces all processes in the system to take checkpoints, and our model serves as an upper overhead bound for different CO schemes.
A process initiates a checkpointing or receives a checkpointing request from other processes. If a process initiates a checkpointing with probability of P(c), then the converse is 1−P(c), and the probability that all processes do not initiate a checkpointing is (1−P(c))n. Thus, the probability that at least one process initiates a checkpointing is 1−(1−P(c))n, and the expected check-point interval for a process is 1−(1−1P(c))n. The overheads include writing checkpoints to stable
storage and message communication. An initiator process generates n−1 checkpointing request messages and another n−1 acknowledgement messages. Non-initiator process generates only one acknowledgement message. For a given checkpoint, let n1 be the probability that a process is the initiator and 1−n1 otherwise. Hence, the average number of messages generated per checkpoint is 2(n−1)· 1
n+ 1·(1− 1 n) =
3(n−1)
n . So the average overhead per checkpoint isCc+ 3(n−1)
n Cnw. The
average checkpointing cost for a process is
CPCO= CP I = (1−(1−P(c)) n)(C c+ 3(n−1) n Cnw) (2)
where I is the checkpoint interval. For a process, assume recovery overhead is Crb and the mean
time between failures is P(1f), the average recovery cost is
ROCO=
Crb 1 P(f)
=P(f)Crb (3)
3.2 Pessimistic Sender-based Message Logging (PS)
In uncoordinated checkpointing, each process takes independent checkpoints with probabilityP(c), hence the checkpoint interval is P1(c). The average checkpointing cost for a process is
CPP S= CP I = Cc 1 P(c) =P(c)Cc (4)
In pessimistic sender-based message logging [14], each message is logged in volatile memory on the sender machine. This allows failure recovery without the overhead of synchronous message logging to stable storage. Messages are logged asynchronously to stable storage without blocking the process computation, and logging overhead is distributed proportionally over all processes. When a process receives a message, it returns to the sender areceive sequence number (RSN), which is then added to the message log. RSN may be merged with acknowledgement message required by the network protocol. RSN indicates the message received order relative to the other messages sent to the same process from other senders. During recovery, messages are replayed from the log in the received order.
Sender-based message logging is not atomic, since a message is logged when it has been sent but the RSN can only be logged after the destination process received the message. When a receiver process fails, some sent messages may be partially logged, and the corresponding RSNs may not be recorded at the senders. The sender-based message logging protocols are designed so that any partially logged messages that exist for a failed process can be sent to it in any order after the sequence of fully logged message have been sent to it in ascending RSN order. After returning the RSN, the receiver process continues its execution without waiting for RSN acknowledgement, but it must not send any messages until all RSNs have been acknowledged. The sender may continue its normal execution immediately after the message is sent, but it must continue to retransmit the original message until the RSN packet arrives. The cost of PS is an extra RSN acknowledgement network packet.
We ignore the overhead of a sender for copying the message and RSN to the log. We assume that the receiver experiences some delay because it needs to send messages immediately after receiving the original message. Therefore, the average message logging cost is
M LP S =P(m)Cnw (5)
A failed process is restarted on an available processor using its latest checkpoint. Similar to coor-dinated checkpointing, the average rollback cost is P(f)Crb. After that, all fully logged messages
for this process are re-sent to the recovery process in ascending order of the logged RSNs. There is a separate message log stored at each process that sent messages to the failed process since its last checkpoint. For simplicity, we ignore the overhead of the recovery process of broadcasting requests for its logged messages. Only messages for which both the message and RSN have been recorded in the log are re-sent at this time; any partially logged messages are then sent in any order after this. The overhead of senders due to re-sending logged messages, both fully logged and partially logged messages, to the recovery process is P(m)2P1(c)Cnw. Thus, the average cost of re-sending
logged messages is P(m)2P1(c)Cnw 1 P(f) = P(f)P(m)Cnw 2P(c)
We assume failures occur between checkpoints with the same probability, and the overhead of replaying a message received from surviving senders is equal to that of replaying a message from stable storage. The average number of logged messages need to be replayed is P2P(m(c)), and the average cost of replaying logged messages is
P(m) 2P(c)Cr 1 P(f) = P(f)P(m)Cr 2P(c)
Thus, the total recovery cost for a process is the sum of the cost of rolling back to its latest checkpoint and the cost of resending and replaying logged messages.
ROP S =P(f) (Crb+
P(m)Cr
2P(c) +
P(m)Cnw
2P(c) ) (6)
3.3 Pessimistic Receiver-based Message Logging (PR)
In pessimistic algorithms, a process does not send a message until it knows that all messages received and processed so far are logged [20]. This prevents the creation of orphan messages and simplifies the rollback of a failed process as compared to optimistic methods. Each sent message is synchronously logged by blocking the receiver process. During recovery, only the faulty process rolls back to its latest checkpoint. All messages received between the latest checkpoint and the failure are replayed from stable storage in the received order. Messages sent by the process during recovery are ignored since they are duplicates of messages sent before the failure.
The average checkpointing cost for a process is similar to pessimistic sender-based message logging
CPP R=P(c)Cc (7)
The average number of messages a process receives from another process per unit time is Pn(−m1). Hence, the average number of messages a process receives per unit time is (n−1)Pn(−m1) = P(m), and the average message logging cost for a process is
M LP R =P(m)Cp (8)
The recovery cost is the sum of the rollback cost and the cost of replaying logged messages from stable storage. The average rollback cost for a failed process is P(f)Crb. Since a failure occurs
between checkpoints with equal probabilities, the average number of logged messages replayed is
P(m)
2P(c). The average cost of replaying logged messages is P(m) 2P(c)Cr 1 P(f) = P(f)P(m)Cr 2P(c) Thus, the recovery cost for a process is
ROP S =P(f)Crb+
P(f)P(m)Cr
2P(c) =P(f)(Crb+
P(m)Cr
2P(c) ) (9)
3.4 Optimistic Receiver-based Message Logging (OR) Similar to PS, the average checkpointing cost for a process is
CPOR=P(c)Cc (10)
In OR, messages are logged to stable storage asynchronously to avoid blocking the application and to minimize the logging overhead [21]. This is achieved by grouping logged messages into a single
operation or performing logging when the system is idle. The average message logging cost for a process is
M LOR=P(m)Co (11)
Let the average gap between loggings be P1(l). The average rollback overhead for a failed process is (2P1(c)−2P1(l))Crb. For a given mean time between failures, the average rollback cost is
(2P1(c) −2P1(l))Crb 1 P(f) = (P(f) 2P(c) − P(f) 2P(l))Crb
For each process, the average overhead of replaying logged messages is (2P1(c)−2P1(l))P(m)Cr, and
the average message replaying cost is (2PP((fc))−2PP(f(l)))P(m)Cr. For the recovery process, the average
overhead of re-sending messages is 2P1(l)P(m)Cnw. Thus, the average cost of re-sending messages
is 2PP((fl))P(m)Cnw.
One of the main drawbacks of optimistic message logging is orphan messages. Because messages are logged asynchronously, a process can lose all received messages before the log is written. Thus, other processes that are dependent on this process must be rolled back, otherwise they become orphan processes. Before rolling back, these processes log the received messages in stable storage to avoid message loss during rollback. It is important to determine the expected number of dependent processes to derive the failure overhead.
The probability that a process Pi sends a message to process Pj, j6=i,j ∈ {0,1,2,3, ..., n−1} is P(m)
n−1 . Consider an interval of length t, the probability that a processPi sends at least one message
to process Pj is (1−(1−Pn(−m1)) t
). Thus, the average number of distinct processes that receive message(s) from process Pi during t is (n−1)(1−(1− Pn(−m1))
t
). If Pi fails at this point, these
processes become orphan ones. Therefore, the average rollback cost of orphan processes is
1 2P(c) 1 P(f) (n−1)(1−(1−P(m) n−1) 1 2P(l) )Cor = P(f) 2P(c)(n−1)(1−(1− P(m) n−1) 1 2P(l) )Cor
Thus, the total recovery cost for a process is
ROOR= P(f) 2P(c)(Crb+P(m)Cr+(n−1)(1−(1− P(m) n−1) 1 2P(l) )Cor)+ P(f) 2P(l)(P(m)Cnw−P(m)Cr−Crb) (12)
4
Analysis
Checkpointing and rollback recovery approaches offer different tradeoffs with respect to the number of faults that can be tolerated, number of checkpoints per process, simplicity of recovery, extent of rollback, domino rollbacks, orphan processes, simplicity of logging messages, storage overhead, and the ease of garbage collection among others. Table 1 compares the four approaches used in this paper qualitatively. PS avoids the overhead of accessing stable storage but tolerates only one failure because a sender keeps the determinants corresponding to the delivery of each message m
factors CO PS PR OR
checkpoints per process 1 1 1 many
rollback processes all selective local selective
rollback extend last last last many
checkpoint checkpoint checkpoint checkpoints
orphan processes no no no possible
message logging NA asynchronous synchronous asynchronous
log storage NA volatile stable stable
memory storage storage
garbage collection simple complex simple complex
Table 1: Comparison of Four Main Fault Tolerant Approaches
each process is required to maintain several checkpoints since the latest checkpoint for an orphan process does not guarantee the consistency of the whole system. The number of processes involved in recovery differs among schemes. In CO, all processes participate in every global checkpoint and a consistent global state is readily available in stable storage but only the failed process needs to roll back to the most recent checkpoint in PR. For selective rollback, only processes that are dependent on the failed process need to rollback and the rest can continue with their computation. In PS, each process that sent messages to the failed process since its last checkpoint has to re-send the corresponding logs. In OR, however, recovery involves the rollback of the failed process and the orphan processes as well. PR is the most synchronous event logging technique. It avoids the formation of orphan processes by ensuring that all received messages are logged before a process is allowed to impact the rest of the system. Asynchronous message logging in OR comes at the expense of more complicated garbage collection that must identify and free storage of checkpoints that are no longer required. Next, we present a quantitative analysis using the proposed analytical cost model.
The objectives of our quantitative cost evaluation are twofold, namely, comparison of key fault tolerance approaches and its impact on application size, checkpoint frequency, network latency and mean time between failures, and understand the tradeoff between higher network latency in cloud computing and fault tolerant cost. Using our analytical model, we carried out over 200 experiments with a wide range of parameter values. We present in this paper the key observations. Unless otherwise stated, the default parameters are n= 128 processes (virtual machines), P(m) = 1/2 or one message per two seconds,P(f) = 1/168 or one failure per 168 hours (one week),Cnw = 20ms,
Cc = 1 second, Crb = 2 second, Cr = 0.01 second, Cor = 0.5 second, P(c) = 1/15 or one
checkpoint per 15 minutes, P(l) = 1/200 or one optimistic log per 200 seconds, Cp = 0.1 second
and Co= 0.06 second.
4.1 Effects of Varying Key Parameters 4.1.1 Application Size
A cloud application is partitioned intonprocesses and each process is executed on a virtual machine. Figure 2 shows the cost of fault tolerance for 32 to 4096 processes (virtual machines). As expected, the cost of CO increases sharply with cost more than double with 2048 processes because all processes have to coordinate to form a consistent global state. The cost of PS and PR is about 5% and is independent of the application size since the coordination is eliminated. In addition, the cost of OR is slightly lower than PR for smallern. One of the main reasons is that the cost of PR
Figure 2: Varying Size of Application
involves the application blocking time which is absent in OR.
4.1.2 Checkpointing Frequency
Figure 3 shows the fault tolerant cost when checkpoint frequency increases from one checkpoint
Figure 3: Varying Frequency of Checkpointing
per hour (1/60) to one checkpoint per minute. The cost of coordinated checkpointing increases from 5% to about 150%, and is generally higher than uncoordinated checkpointing approaches. We assume in the model the extreme case when all processes make checkpointing, thus, CO provides an upper cost bound.
Uncoordinated checkpointing roughly follows a convex cost function with increasing checkpoint frequency. We note that checkpointing cost is directly proportional but recovery cost is inversely proportional to checkpoint probability. Increasing checkpoint frequency in OR reduces the proba-bility of orphan processes and reduces fault tolerant cost. Cost in OR is minimum at checkpoint interval of 1/4 (one checkpoint per four minutes). PR and OR have the lowest cost of about 5% for the range of checkpoint frequency experimented.
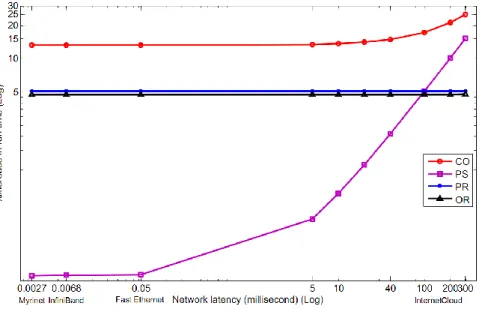
4.1.3 Network Latency
Network latency of cloud resources varies widely from tightly-coupled private clouds to highly distributed federated clouds. Figure 4 shows the cost for a spectrum of interconnection network
Figure 4: Varying Network Latency
technologies ranging from low latency Myrinet to higher latency public and federated clouds over the internet. CO provides the upper cost bound where accessing stable storage dominates over lower network latency. The cost of PR and OR is about 5% and is independent of network latency, and thus are good candidates for federated clouds. The cost of PS is lower but exceeds that of PR and CO when network latency is over 100ms. In this case, the overhead of returning RSNs during failure-free time and re-sending logged messages during recovery time over the network becomes the dominant component of the fault tolerance cost.
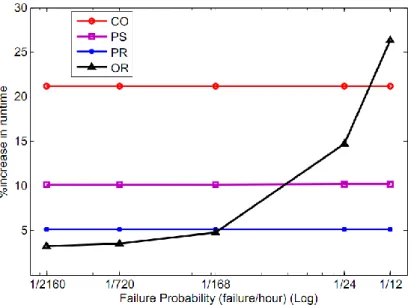
4.1.4 Probability of Failure
Figure 5 shows the impact of increasing failure probability on fault tolerant cost. We vary the mean time between failures from one failure in three months (1/2,160) to two failures per day (1/12). Fault tolerant costs are 20%, 10% and 5% for CO, PS and PR, respectively. For OR, higher failures increase the number of orphan processes and the cost increases from 5% for P(f) of 1/2160 to over 25% with two failures per day. As OR tradeoffs lower failure-free checkpointing cost for higher recovery overhead, it is less efficient for systems with high failure probability. To
Figure 5: Varying Probability of Failure
evaluate the breakdown between checkpointing and recovery cost, we set P(f) to be equal to P(c) that models the best case of one checkpoint per failure recovery. Table 2 shows that the proportion of checkpointing and recovery costs are closed for both low and high probability of failures of 1/720 and 1/12, respectively. Checkpoint cost constitues over 90% of total fault tolerance cost in CO and PR, and 65% in PR. As expected, OR trade-offs low checkpointing for high recovery cost, and in
method cost in %
CO 99.8
PS 65.6
PR 95.2
OR 0.3
Table 2: Proportion of Checkpointing Cost
our experiments recovery cost accounts for almost the total cost of fault tolerance.
4.2 Cloud Computing
To further study the cost of fault tolerance of cloud applications, we evaluate the scenarios where an application has a higher failure probability and message communication among processes. Figure 6 shows the cost for failure probability of one failure per day to four failures per hour. In addition, we vary the average network latency to 10ms, 100ms and 300msto model different types of cloud interconnection network technologies. The graphs show that the cost of OR increases from 7% to over 300% when failure probability increases from 1/24 to 4 failures per hour, respectively. Furthermore, there is no significant difference in fault tolerance cost of OR for various values of network latency. Thus, failure probability is more sensitive than network latency in OR. The cost of PR, however, is independent of failure probability as well as network latency which reinforces our observations in section 4.1.3 and 4.1.4.
Figure 6: High Probability of Failure and Network Latency
To evaluate cloud applications with different degrees of message-passing among processes, we vary
P(m) from one message in 32 seconds to eight messages per second. Average network latency is set to 200ms to model a public cloud. As shown in Figure 7, the cost of fault tolerance increases withP(m) for both low (1/(720 hours)) and high (1/(12 hours)) failure probability. For P(m) of up to one message per second, PR has a lower cost of less than 10% than OR but cost increases sharply when message-passing increases further. This limits the cloud as a platform for applications that require a high degree of message communication among processes. The result also reveals the dependence of OR on failure probability.
5
Summary
Increasing adoption of multi-core and many-core systems and recently cloud computing for high performance computing warrant a relook of the impact and cost of fault tolerance on these new platforms. This paper presents a simple unified analytical model to advanced our understanding of the cost-performance tradeoffs for four commonly-used fault tolerant techniques. Our quantitative analysis confirms and reveals a number of insights. First, coordinated checkpointing is not scalable and its cost is significantly higher for larger number of processes and with increased checkpointing frequency. For example, when the number of processes extends from 32 to 4096, its cost increases from 6% to 160%. Second, network latency has a significant influence on the application run time under pessimistic sender-based message logging. For instance, when network latency increases from 0.05ms to 300ms, its cost grows rapidly from less than 1% to 15%. Failure probability, on the other hand, is the most sensitive to optimistic receiver-based message logging. When failure probability increases from 1/(2160 hours) to 1/(12 hours), the percentage increase in run time grows from 3% to 26%. In summary, our analysis shows that for distributed-memory systems such as clouds with high network latency, when failure probability is low, optimistic receiver-based message logging is a suitable and when failures are more frequent, pessimistic receiver-based message logging is a
Figure 7: Varying Process Message Communication
candidate choice. The proposed simplified model for distributed-memory systems reveals a number of insights and serves as an upper performance bound in some cases but it has a number of limi-tations. However, model assumptions including fixed periodic checkpoint intervals, Poisson failure arrivals and no failure between checkpoints among others can easily be relaxed to improve model accuracy.
Acknowledgements
This work is supported in part by the Singapore Ministry of Education under AcRF grant number R-252-000-405-112, and the Chinese Academy of Sciences Visiting Professorship for Senior International Scientists under grant number 2010T2G42.
References
[1] N. Adiga, T. B. Team,An Overview of the BlueGene/L Supercomputer, Proc. of ACM/IEEE Conference on Supercomputing, November 2002.
[2] L. Alvisi, E. N. Elnozahy, S. Rao, S. A. Husain, A. D. Mel, An Analysis of Communica-tion Induced Checkpointing, Proc. 29th Annual International Symposium on Fault-Tolerant Computing, pp 242-249, 1999.
[3] L. Alvisi, K. Marzullo, Message Logging: Pessimistic, Optimistic and Causal, Proc. of 15th IEEE International Conference on Distributed Computing Systems, pp 229-236, 1995.
[4] M. Armbrust, et al., Above the Clouds: A Berkeley View of Cloud Computing, University of California, Berkeley, Technical Report No. UCB/EECS-2009-28, February 2009.
[5] K. Asanovic, et al., The Landscape of Parallel Computing Research: A View from Berke-ley, University of California, Berkeley, Technical Report No. UCB/EECS-2006-183, December 2006.
[6] K. M. Chandy, L. Lamport, Distributed Snapshots: Determining Global States of Distributed Systems, ACM Transaction on Computing Systems, Vol. 3, No. 1, pp 63-75, February 1985. [7] J. T. Daly,A Model for Predicting the Optimum Checkpoint Interval for Restart Dumps, Proc.
of the International Conference on Computational Science, 2003.
[8] J. T. Daly,A Higher Order Estimate of The Optimum Checkpoint Interval for Restart Dumps, Future Generation Computer Systems, Vol. 22, No. 3, pp 303-312, February 2006.
[9] E. N. Elnozahy, L. Alvisi, Y. Wang, D. B. Johnson, A Survey of Rollback-recovery Protocols in Message-passing Systems, ACM Computing Surveys, Vol. 34, No. 3, pp 375-408, 2002. [10] E. N. Elnozahy, D. B. Johnson, W. Zwaenepoel,The Performance of Consistent Checkpointing,
Proc. of 11th Symposium on Reliable Distributed Systems, pp 39-47, October 1992.
[11] E. Elnozahy, J. Plank,Checkpointing for peta-scale systems: A look into the future of practical rollback-recovery, Proc. of the IEEE Transactions on Dependable and Secure Computing, pp 97-108, 2004.
[12] Q. Gao, W. Huang, M. Koop, D. K. Panda,Group-based Coordinated Checkpointing for MPI: A Case Study on InfiniBand, Proc. of IEEE International Conference on Parallel Processing, pp 47-56, 2007.
[13] H. Jin, Y. Chen, H. Zhu, X. Sun,Optimizing HPC Fault-Tolerant Environment: An Analytical Approach, Proc. of the 39th International Conference on Parallel Processing, Vol. 0, pp 525-534, 2010.
[14] D. B. Johnson, W. Zwaenepoel, Sender-based Message Logging, Proc. of 17th Annual Interna-tional Symposium on Fault-Tolerant Computing, pp 14-19, 1987.
[15] A. Oliner, L. Rudolph, R. Sahoo,Cooperative-checkpointing: A Robust Approach to Large-scale Systems Reliability, Proc. of 20th International Conference on Supercomputing, pp 14-23, 2006. [16] A. J. Oliner, R. K. Sahoo, J. E. Moreira,M. Gupta, Performance Implications of Periodic Checkpointing on Large-scale Cluster Systems, Proc. of 19th IEEE International Symposium on Parallel and Distributed Processing, April 2005.
[17] R. Prakash, M. Singhal, Low-cost Checkpointing and Failure Recovery in Mobile Computing systems, IEEE Transactions on Parallel and Distributed Systems, Vol. 7, No. 10, pp 1035-1048, December 1996.
[18] D. S. Richard, B. S. Fred, Fail-Stop Processors: An Approach to Designing Fault-Tolerant Computing Systems, ACM Transactions on Computing Systems, Vol. 1, No. 3, pp 222-238, 1983.
[19] J. C. Sancho, et al., Current Practice and a Direction Forward in Checkpoint/Restart Imple-mentations for Fault Tolerance, Proc. of 19th IEEE International Parallel and Distributed Processing Symposium, 2005.
[20] R. E. Strom, D. F. Bacon, S. Yemini,Volatile Logging in n-fault-tolerant Distributed Systems, Proc. of 18th Annual International Symposium on Fault-Tolerant Computing, pp 44-49, 1988. [21] R. E. Strom, S. Yemini, Optimistic Recovery in Distributed Systems, ACM Transactions on
Computer System, Vol. 3, No. 3, pp 204-226, 1985.
[22] A. N. Tantawi, M. Ruschitzka,Performance Analysis of Checkpointing Strategies, ACM Trans-actions on Computer Systems, Vol. 2, No. 2, pp 123-144, May 1984.
[23] M. Wu, X. H. Sun, H. Jin, Performance under Failure of High-End Computing, Proc. of the 2007 ACM/IEEE Conference on SuperComputing, November 2007.
[24] J. W. Young, A First Order Approximation to the Optimum Checkpoint Interval, Communi-cations of the ACM, Vol. 17, No. 9, pp 530-531, 1974.