Cornell University ILR School
Cornell University ILR School
DigitalCommons@ILR
DigitalCommons@ILR
Federal Publications
Key Workplace Documents
Summer 2010
Pension Insurance Data Book 2009
Pension Insurance Data Book 2009
Pension Benefit Guaranty Corporation
Follow this and additional works at:
https://digitalcommons.ilr.cornell.edu/key_workplace
Thank you for downloading an article from DigitalCommons@ILR.
Thank you for downloading an article from DigitalCommons@ILR.
Support this valuable resource today!
Support this valuable resource today!
This Article is brought to you for free and open access by the Key Workplace Documents at DigitalCommons@ILR. It has been accepted for inclusion in Federal Publications by an authorized administrator of DigitalCommons@ILR. For more information, please contact [email protected].
Pension Insurance Data Book 2009
Pension Insurance Data Book 2009
Abstract
Abstract
[Excerpt] The Pension Benefit Guaranty Corporation (PBGC) was established by the Employee Retirement
Income Security Act of 1974 (ERISA) to ensure that participants in defined benefit pension plans receive
their pensions if their plans terminate without sufficient assets to pay promised benefits. The PBGC
administers separate insurance programs to protect participants in single-employer and multiemployer
plans.
The PBGC has published the Pension Insurance Data Book annually since 1996 to present detailed
statistics on PBGC program operations and benefit protections.
This edition of the Pension Insurance Data Book contains one short article describing the characteristics
of PBGC’s Multiemployer Insurance Program. The tables in this Data Book have been updated to reflect
the most recent data available.
Keywords
Keywords
pension, insurance, data, retirement, benefit
Comments
Comments
Suggested Citation
Suggested Citation
Pension Benefit Guaranty Corporation. (2010). Pension insurance data book 2009. Washington, DC:
Author.
Pension Insurance
Data Book 2009
º
Page
Contents
OveRview
...1PBGC DAtA BOOk At A GlAnCe
...2PBGC’s Multiemployer Insurance Program
...3PBGC DAtA AnD tRenDs
Single-emPloyer Program:
Figure.1.. Net.Position.of.PBGC’s.Single-Employer.Program.(1980-2009)...18.. Figure.2.. Concentration.of.PBGC.Claims.(1975-2009)...19.. Figure.3.. PBGC.Claims.by.Industry.(1975-2009)...20.. Figure.4.. PBGC.Claims.by.Funded.Ratio.(1975-2009)...21.. Figure.5.. Participants.and.Beneficiaries.Receiving.PBGC.Payments.(1980-2009)...22 Figure.6.. Participants.and.Beneficiaries.Receiving.PBGC.Payments. . ...by.Gender.and.Age.(2009)...23. Figure.7.. PBGC.Benefit.Payments.(1980-2009)...24.. Figure.8.. PBGC-Insured.Plans.(1980-2009)...25. Figure.9.. Participants.in.PBGC-Insured.Plans.(1980-2009)...26 Figure.10.. PBGC-Insured.Participants.by.Participant.Status.(1980-2007)...27 Figure.11.. PBGC-Insured.Participants.by.Industry.(2008)...28.. Figure.12.. PBGC.Premium.Revenue.(1980-2009)...29. Figure.13.. PBGC-Insured.Participants.and.Premiums.by.Premiums.Paid.(2008)...30.multiemPloyer Program:
Figure.14.. Net.Position.of.PBGC’s.Multiemployer.Program.(1980-2009)...32. Figure.15. PBGC-Insured.Plans.(1980-2009)...33. Figure.16.. Participants.in.PBGC-Insured.Plans.(1980-2009)...34.. Figure.17.. PBGC-Insured.Participants.by.Participant.Status.(1980-2007)...35. Figure.18.. PBGC-Insured.Participants.by.Industry.(2008)...36..APPenDiX s: sinGle-eMPlOYeR DAtA tABles
. PBGC’s sinGle-emPloyer ProGram...
38..S-1. Net.Financial.Position.of.PBGC’s.Single-Employer.Program.(1980-2009)... 40 S-2. PBGC.Premium.Revenue,.Benefit.Payments,.and.Expenses.(1980-2009)... 41.
Claims
S-3. PBGC.Terminations.and.Claims.(1975-2009)... 42 S-4. PBGC.Claims.(1975-2009)... 43. S-5. Top.10.Firms.Presenting.Claims.(1975-2009)... 44 S-6. PBGC.Trusteed.Terminations.by.Fiscal.Year.and.Size.of.Claim.(1975-2009)... 45.Page
S-8. PBGC.Trusteed.Plans.by.Fiscal.Year.and.Funded.Ratio.(1975-2009)... .47 S-9. PBGC.Claims.by.Fiscal.Year.and.Funded.Ratio.(1975-2009)... .48 S-10.. PBGC.Trusteed.Plans.by.Size.of.Claim.and.Funded.Ratio.(1975-2009)... .49 S-11. PBGC.Claims.by.Size.of.Claim.and.Funded.Ratio.(1975-2009)... .50 S-12. Average.Claim.per.Vested.Participant.by.Plan.Size.(1975-2009)... .51 S-13. PBGC.Trusteed.Plans.by.Fiscal.Year.and.Plan.Size.(1975-2009)... .52 S-14. PBGC.Claims.by.Fiscal.Year.and.Plan.Size.(1975-2009)... .53 S-15. PBGC.Trusteed.Plans.by.Size.of.Claim.and.Plan.Size.(1975-2009)... .54 S-16. PBGC.Claims.by.Size.of.Claim.and.Plan.Size.(1975-2009)... .55 S-17.. PBGC.Trusteed.Plans.by.Funded.Ratio.and.Plan.Size.(1975-2009)... .56 S-18. PBGC.Claims.by.Funded.Ratio.and.Plan.Size.(1975-2009)... .57 S-19. PBGC.Claims.by.Industry.(1975-2009)... .58Benefit Payments
S-20. PBGC.Benefit.Payments,.Payees.and.Deferred.Payees.(1980-2009)... .59 S-21. PBGC.Payees.and.Benefit.Payments.by.Date.of.Plan.Termination.(2009)... .60 S-22. PBGC.Payees.and.Benefit.Payments.by.Size.of.Trusteed.Plan.(2009)... .61 S-23. Total.PBGC.Payees.and.Average.Benefit.Payments.. . ...by.Gender.and.Age.(2009)... .62 S-24. PBGC.Retired.Payees.and.Average.Benefit.Payments.. . ...by.Gender.and.Age.(2009)... .63 S-25. PBGC.Beneficiary.Payees.and.Average.Benefit.Payments. . ...by.Gender.and.Age.(2009)... .64 S-26. Total.PBGC.Payees.and.Benefit.Payments.. . ...by.Size.of.Monthly.Payment.(2009)... .65 S-27. PBGC.Retired.Payees.and.Benefit.Payments.. . ...by.Size.of.Monthly.Payment.(2009)... .66 S-28. PBGC.Beneficiary.Payees.and.Benefit.Payments. . ...by.Size.of.Monthly.Payment.(2009)... .67 S-29. PBGC.Payees.and.Benefit.Payments.by.Industry.(2009)... .68Coverage
S-30. PBGC-Insured.Plan.Participants.(1980-2009)... .69 S-31. PBGC-Insured.Plans.(1980-2009)... .70 S-32. PBGC-Insured.Plan.Participants.by.Participant.Status.(1980-2007)... .71 S-33. PBGC-Insured.Active.Participants.as.a.Percent.of. . ...Private-Sector.Wage.and.Salary.Workers.(1980-2007)... .72 S-34. PBGC-Insured.Hybrid.Plans.by.Plan.Size.(2001-2008)... .73 S-35. PBGC-Insured.Hybrid.Plan.Participants.by.Plan.Size.(2001-2008)... .74 S-36. PBGC.Insured.Hard-Frozen.Plans.by.Plan.Size.(2003-2007)... .75 S-37. PBGC-Insured.Hard-Frozen.Plan.Participants.by.Plan.Size.(2003-2007)... .76 S-38. PBGC-Insured.Plans,.Participants,.and.Premiums.by.Industry.(2008)... .77PBGC Premiums
S-41. PBGC.Premium.Revenue.by.Size.of.Plan.and.Type.of.Premium.(2008)... ..80.
S-42. PBGC-Insured.Plans.and.Participants.by.Total.Premium.Paid.(2008)... ..81
S-43. PBGC-Insured.Plans.and.Participants.. . ...by.Variable-Rate.Premium.Status.(1992-2008)... ..82
Funding Levels of Insured Plans
S-44. Funding.of.PBGC-Insured.Plans.(1980-2007)... ..83 S-45. Funding.of.Underfunded.PBGC-Insured.Plans.(1980-2007)... ..84 S-46. Funding.of.Overfunded.PBGC-Insured.Plans.(1980-2007)... ..85 S-47. Concentration.of.Underfunding.in.PBGC-Insured.Plans.(1990-2007)... ..86 S-48. Plans,.Participants,.and.Funding.of.PBGC-Insured.Plans.. . ...by.Funding.Ratio.(2007)... ..87 S-49. Various.Measures.of.Underfunding.in.PBGC-Insured.Plans.(1992-2009)... ..88 S-50. Funding.of.PBGC-Insured.Plans.by.Industry.(2007)... ..89State Data
S-51. Pension.Funding.Data.for.PBGC-Insured.Plans.by.Region.and.State.(2007)... ..90 S-52. PBGC.Pension.Data.by.Region.and.State... ..92 S-53. PBGC.Maximum.Guaranteed.Benefits.(1990-2010)... ..94APPenDiX M: MUltieMPlOYeR DAtA tABles
.
PBGC’s multiemPloyer ProGram... ..96M-1. Net.Financial.Position.of.PBGC’s.Multiemployer.Program.(1980-2009)... ..97
M-2. PBGC.Premium.Revenue,.Benefit.Payments,.and.Expenses.(1980-2009)... ..98
Benefit Payments and Financial Assistance
M-3. PBGC.Payees.and.Benefit.Payments.(1980-2009)... ..99 M-4. PBGC.Financial.Assistance.to.Insolvent.Plans.(1981-2009)... 100Coverage
M-5. PBGC-Insured.Plan.Participants.(1980-2009)... 101. M-6. PBGC-Insured.Plans.(1980-2009)... 102 M-7. PBGC-Insured.Plan.Participants.by.Participant.Status.(1980-2007)... 103. M-8. PBGC-Insured.Plans.and.Participants.by.Industry.(2008)... 104Funding Levels of Insured Plans
M-9. Funding.of.PBGC-Insured.Plans.(1980-2007)... 105. M-10. Funding.of.Underfunded.PBGC-Insured.Plans.(1980-2007)... 106 M-11. Funding.of.Overfunded.PBGC-Insured.Plans.(1980-2007)... 107. M-12. Concentration.of.Underfunding.in.PBGC-Insured.Plans.(1990-2007)... 108 M-13. Plans,.Participants,.and.Funding.of.PBGC-Insured.Plans.. . ...by.Funding.Ratio.(2007)... 109. M-14. Funding.of.PBGC-Insured.Plans.by.Industry.(2007)... 110 M-15.. PBGC.Maximum.Guaranteed.Benefits.(1980-2010)... 111. M-16. PBGC’s.Historic.Premium.Rates... 112Page
Overview
The Pension Benefit guaranty Corporation (PBgC) was established by the employee
retirement income Security act of 1974 (eriSa) to ensure that participants in defined
benefit pension plans receive their pensions if their plans terminate without sufficient
assets to pay promised benefits. The PBgC administers separate insurance programs to
protect participants in single-employer and multiemployer plans.
The PBgC has published the
Pension Insurance Data Book
annually since 1996 to
present detailed statistics on PBgC program operations and benefit protections.
This edition of the
Pension Insurance Data Book
contains one short article describing
the characteristics of PBgC’s multiemployer insurance Program. The tables in this
Data
Book
have been updated to reflect the most recent data available.
The Data Book is available on the PBgC’s website at www.pbgc.gov/publications/
PBGC Data BOOk at a GlanCe
Single-Employer Program (Dollars in millions) Multiemployer Program (Dollars in millions) Combined Programs (Dollars in millions)Fiscal Year 2009:
Net Financial Position -$21,077 -$869 -$21,946
Total Assets $68,736 $1,459 $70,195
Total Liabilities $89,813 $2,328 $92,141
Premium Revenue* $1,822 $95 $1,917
Number of Insured Plans 27,647 1,495 29,142
Number of Insured Participants 33.6 million 10.4 million 44.0 million
New Plans Trusteed or
Pending Trusteeship 144 n/a 144
Change in Gross Claims $8,066 n/a $8,066
Number of Payees** 753,861 134 753,995
Total Benefits Paid $4,478 *** $4,478
Number of Plans Receiving
Financial Assistance n/a 43 43
Amount of Financial Assistance Granted n/a $86 $86
Fiscal Years 1975-2009:
Plans Trusteed or Pending Trusteeship 3,993 10 4,003
Amount of Claims $42,918 $31 $42,949
Number of Plans Receiving
Financial Assistance n/a 62 62
Total Amount of Financial
PBGC’s Multiemployer Insurance Program
Introduction
under title iV of the employee retirement income Security act of 1974 (eriSa),
the Pension Benefit guaranty Corporation (PBgC) administers two very different
pen-sion insurance programs—one covers single-employer plans and the other covers
mul-tiemployer plans. These programs are separately funded and maintained. This chapter
describes the history and operation of PBgC’s multiemployer insurance program.
in the single-employer program, the trigger for a claim is the termination of a covered
plan with insufficient assets to pay all the benefits that participants have accrued under
the plan. When this happens, PBgC trustees the plan—it takes over the plan’s assets,
determines the benefit to which each participant is entitled from PBgC under eriSa’s
provisions, and becomes responsible for paying benefits to retired plan participants and
beneficiaries. most participants receive all benefits they accrued under their plan, but
some experience benefit reductions.
1guaranteed benefits not covered by plan assets are
paid for from other PBgC assets.
in the multiemployer program, the triggering event is plan insolvency—the inability
to pay benefits when due. insolvency usually occurs after all contributing employers have
withdrawn from the plan, leaving the plan without a source of income.
PBgC provides insolvent multiemployer plans with financial assistance sufficient to
pay guaranteed benefits and administrative expenses. The plans retain the responsibility
for paying benefits to retired plan participants and beneficiaries. PBgC does not pay
benefits directly to participants of insolvent multiemployer plans. Should a plan recover
financially, it is required to repay the financial assistance with interest. to date, only one
multiemployer plan has repaid PBgC for the financial assistance it received.
What Is a Multiemployer Plan?
a multiemployer plan is a plan maintained pursuant to collective bargaining
agree-ments between one or more unions that represent the plan’s active participants and two
or more unrelated employers that are required to contribute to the plan.
2multiemployer
plans are common in industries such as construction, trucking, textiles, and coal
min-ing. Benefit eligibility under a multiemployer plan is usually based on employment with
any employer contributing to that plan. Workers accrue pension credits in the plan even
when they change employment from one contributing employer to another.
3a multiemployer plan is governed by a Board of trustees that has equal voting
representation from labor and business. The Board operates the plan within the
constraints imposed by eriSa. under eriSa, the trustees have a fiduciary duty to act
in the best interest of participants. multiemployer plans are subject to the minimum
funding requirements of eriSa. While bargaining parties will negotiate over plan
contributions, they usually delegate the design of the plan to the plan’s Board of trustees.
most collective bargaining agreements that cover multiemployer plans provide for
contributions based on hours worked in a covered job. Some plans base contributions
on a “units of production” basis, such as number of items produced, tons of coal mined,
or gross sales achieved. Contributions are held in a trust fund that is managed and
invested by the Board in accordance with eriSa’s fiduciary standards. all plan assets
in the trust are available to pay all benefit claims. assets in the plan do not revert to
contributing employers.
Benefits in most plans are based on a “unit Benefit” formula that establishes a
monthly benefit as a dollar amount times years of service. in some plans, benefits are
a function of contributions made to the plan on the participant’s behalf. There are
two primary models for how benefits are set. in the first model, employers and unions
bargain for benefits as a part of the bargaining over wages and working conditions. in
these plans benefits are fixed as part of the labor contract. This model occurs most often
in “national” plans. in the second model, benefits are set by the plan’s trustees.
2
PBGC’s single-employer program covers all plans that are not multiemployer plans. Single-employer plans
employers in multiemployer plans are required to remain in the plan unless they go
out of business, “go non-union,” or move their business out of the plan coverage area.
if an employer withdraws from the plan, it may be assessed withdrawal liability. any
withdrawal liability that is assessed will be based on the plan’s unfunded vested benefits
and the employer’s share of contributions to the plan made by all contributing employers.
in some instances, the employer may be assessed a partial withdrawal liability.
4Multiemployer Insurance Program – legislative Background
The language in eriSa as enacted in 1974 reflected Congressional uncertainty about
the appropriate design of termination insurance for multiemployer plans and the impact
termination rules might have on multiemployer plans. as a result, Congress provided
that PBgC’s coverage of multiemployer plans would not become mandatory until
January 1, 1978. This mandatory coverage date was later extended to July 1, 1978, and
then to august 1, 1980. in the interim, PBgC was authorized to guarantee benefits for
terminated multiemployer plans on a discretionary basis, provided the terminating plans
met certain conditions. PBgC subsequently trusteed 10 multiemployer plans.
in the late 1970s, PBgC studied the situation of multiemployer plans and advised
Congress that potential liabilities from the termination of multiemployer plans could
reach more than $4 billion within 10 years. it also reported that the size of premiums
needed to fund the program would be unacceptably high and could encourage
additional multiemployer plan terminations. in 1979, PBgC submitted a number of
recommendations to Congress for revising the program. These recommendations were
designed to afford substantial benefit protection at reasonable premium levels. Congress
acted on these recommendations and, on September 26, 1980, the multiemployer
Pension Plan amendments act of 1980 (mPPaa) became law. The mPPaa provisions
were intended to financially strengthen multiemployer plans and changed the way
PBgC’s multiemployer insurance program worked.
4
The plan can assess a partial withdrawal liability against an employer if: (1) the employer experienced a 70
The act’s major provisions included:
•
Withdrawal Liability
—mPPaa obligated an employer withdrawing from
an underfunded multiemployer plan to pay its share of the plan’s unfunded
vested liabilities. The act contained specific rules and alternative methods for
computing and allocating the plan’s unfunded vested benefits. Special withdrawal
liability rules were established for multiemployer plans in the construction,
entertainment, and trucking industries. Withdrawal liability is intended to
discourage employers from leaving multiemployer plans and to protect the plan
and remaining employers from the impact of the withdrawals that do occur.
•
Plan Funding and Reorganization
—mPPaa shortened amortization periods for
funding benefit increases and for amortizing experience gains and losses. The
new law established a reorganization process to allow plans in financial difficulty
to achieve a better balance between benefits on the one hand and plan assets and
employer contributions on the other. The reorganization process allowed some
flexibility for reducing or eliminating recent benefit increases and for tightening
funding requirements.
•
Insolvency Insurance
—mPPaa changed the insurable event for PBgC’s insurance
protection from plan termination to plan insolvency. a plan is insolvent when
it is unable to pay guaranteed benefits plus expenses. PBgC provides financial
assistance to insolvent multiemployer plans through one or more loans that allow
the plan to pay statutorily guaranteed benefits and reasonable administrative
expenses. This requirement assures that PBgC provides funds only when there
have been long-term financial declines among all the employers sponsoring the
plan, and not when only one or two contributing employers are in financial
distress. The requirement also means that a multiemployer plan does not need to
terminate in order to qualify for financial assistance from PBgC.
5•
Benefit Guarantees
—mPPaa limited the level of guaranteed benefits for
participants in multiemployer plans. a plan in reorganization may eliminate
benefit increases made during the previous five years. Benefits may be further
reduced if the plan continues in financial difficulty. However, in no case may
benefits be reduced below the statutory guarantee. as originally enacted in
mPPaa, the statutory maximum monthly benefit guarantee equaled “years of
covered service under the plan, multiplied by the sum of 100 percent of the first
$5.00 in monthly accrual rate
6plus 75 percent of the next $15.00 in monthly
accrual rate.”
For a participant with 30 years of covered service, the maximum statutory
guarantee under mPPaa was $487.50 per month ($5,850.00 per year), even
if their monthly accrual rate was greater than $20. if a participant’s monthly
accrual rate was less than $20, his statutory guarantee would be lower. For
example, a participant with 30 years of covered service but a monthly accrual rate
of $17 would have a statutory guarantee of $420 per month.
The benefit guarantee limit was not indexed in mPPaa and remained unchanged
until it was increased by the Consolidated appropriations act of 2001 (Caa) to
“years of covered service under the plan, multiplied by the sum of 100 percent
of the first $11.00 in monthly accrual rate plus 75 percent of the next $33.00 in
monthly accrual rate.”
This change increased the maximum guaranteed benefit for a participant with 30
years of covered service to $1,072.50 per month ($12,870.00 per year). Caa
also did not index this benefit guarantee limit, and it remains the current limit.
This increased maximum guarantee limit only applies to multiemployer plans
that did not receive PBgC financial assistance between December 22, 1999, and
December 21, 2000.
•
Premiums
—Congress initially set the multiemployer plan premium rate at $0.50
per participant per year. in 1979, the rate was increased to $1.00 per participant
per year. mPPaa increased the rate to $2.60 per participant over a period of
eight years. The rate remained at $2.60 per participant until 2006, when the
Deficit reduction act of 2005 (Dra) increased it to $8.00 per participant and
indexed the premium to the increase in the national average wage rate. For 2010,
the premium rate is $9.00 per participant. unlike the single-employer program,
the multiemployer program does not have a variable-rate premium or a plan
termination premium.
The mPPaa provisions, and the subsequent relatively minor changes in the Caa
and Dra discussed above, continue to define PBgC’s multiemployer insurance
pro-gram. The Pension Protection act of 2006 (PPa) contained several provisions intended
to improve the funding of underfunded multiemployer plans, provide more flexibility in
the methods used to determine withdrawal liability, and expand the reporting obligations
of multiemployer plans. However, PPa did not substantively modify the multiemployer
insurance program itself.
among other actions, PPa’s multiemployer-related provisions:
•
Defined the characteristics of those multiemployer plans whose funding is in
endangered, seriously endangered, or critical status as opposed to a better
funded status;
•
Provided guidelines for elements (i.e., certain benefit reductions, contribution
increases, etc.) that should be included in funding improvement plans
(for endangered or seriously endangered plans) and rehabilitation plans
(for critical plans);
•
established tighter time frames for improving plan funding; and
•
expanded the amount of information multiemployer plans must disclose to
participants, contributing employers, and federal agencies.
PBGC’s Multiemployer Insurance Program
PBgC’s multiemployer program is the smaller of its two insurance programs.
Because of its relatively small size, and the much larger deficit in the single-employer
program, PBgC’s multiemployer program often gets overlooked when PBgC is
discussed. This small size has two aspects.
First, the multiemployer program has a smaller scope. it insures only 1,500 plans,
about one-twentieth as many as the 27,600-plan single-employer program. it covers
only about one-third as many participants (10.4 million versus 33.6 million). However,
insured multiemployer plans are about six times as large, on average, as insured
single-employer plans.
The number of plans insured by each program has been declining for decades but
has fallen much faster in the single-employer program—a more than 70 percent decline
since 1980 versus only a 33 percent decline in the multiemployer program. Plans that
leave the multiemployer program are more likely to merge into another multiemployer
plan than to close out. Single-employer plans, on the other hand, are much more likely
to terminate than to merge into another plan. merging helps maintain the number of
Second, it is a fiscally smaller program. Program assets and booked liabilities
are significantly smaller than those of the single-employer program. This reflects
several design features of multiemployer plans and the multiemployer program. most
importantly, multiemployer plans have multiple contributing employers. Should one
employer withdraw from the plan, the others continue to support the plan through their
contributions. PBgC’s multiemployer insurance program is the second line of support
for these plans. This lowers the program’s exposure to loss and allows lower premiums
than under the single-employer program.
7moreover, since PBgC does not trustee multiemployer plans, it does not acquire the
plans’ assets. all multiemployer program assets come solely from premiums. For these
reasons, the multiemployer program’s assets are only a fraction of those in the
single-employer program ($1.5 billion compared with $68.7 billion, at the end of Fy 2009).
as noted above, booked liabilities also are constrained relative to those for the
single-employer program. one reason is that, because PBgC does not trustee multisingle-employer
plans, it does not count as liabilities participant benefits that will be paid out of existing
plan assets. a second reason is that the future financial assistance, which does count as
a liability, is based on the much lower statutory benefit guarantee in the multiemployer
program. liabilities in the multiemployer program are $2.3 billion compared with
$89.8 billion in the single-employer program.
Operation of the Multiemployer Insurance Program
Beyond financially assisting insolvent plans, the multiemployer program (in
conjunc-tion with other PBgC offices) provides a number of services to the multiemployer plan
community. it approves or disapproves certain transactions such as mergers and other
transfers of assets and liabilities between multiemployer plans. it works with
finan-cially distressed multiemployer plans to help them merge with finanfinan-cially stronger ones.
PBgC issues opinion letters and regulations affecting multiemployer plans. among these
regulations are those that govern withdrawal liability. However, it is the plans’ trustees,
not the PBgC, who determine whether a withdrawal has occurred and the amount of
any withdrawal liability, and who are responsible for collecting the withdrawal liability.
as part of its regular activities, the multiemployer program identifies multiemployer
plans that pose a potential loss to the program. Some of these plans self-identify when
they notify PBgC that they are: in endangered, seriously endangered, or critical status;
terminating; insolvent; or requesting financial assistance. in addition, the program
con-ducts annual reviews of the financial condition of all 1,500 covered multiemployer plans
to identify additional individual plans that pose a potential loss to the program.
Poten-tial loss candidates are further analyzed to determine if they might become insolvent.
This analysis involves projecting future cash flows and assessing the overall stability of the
plans. it projects the date of insolvency, the future stream of required financial
assis-tance, the stream of recoveries PBgC might obtain after financial assistance begins, and
the present value of non-recoverable financial assistance, among other outputs. if this
analysis determines that a plan is likely to become insolvent and require non-recoverable
PBgC financial assistance, it will be classified as either a
Probable
plan or a
Reasonably
Possible
plan.
There are three categories of
Probable
plans:
•
Current probables
– those plans that are known to be insolvent as of the valuation
date and either have been receiving, or are about to begin receiving, financial
assistance payments from PBgC that the plans are not expected to repay. most
of these plans are terminated plans whose contributing employers have all
withdrawn from the plan. Some of these terminated plans may be receiving
withdrawal liability payments but not enough to pay all benefits when due. a
few current probable plans are ongoing plans that are still receiving contributions
and may be owed withdrawal liability payments. However, these contributions,
withdrawal liability payments, and any other plan income or assets the plan
may have are neither sufficient to pay the plans’ current liability obligations
(statutorily guaranteed benefit payments and administrative expenses) nor
projected to be sufficient to repay PBgC’s past and future financial assistance.
•
Terminated future probables
– those terminated plans that may still have assets
as of the valuation date but whose assets plus collectible withdrawal liability
payments are expected to be insufficient to cover all future liability obligations.
These plans operate as wasting trusts projected to run out of assets before all
statutorily guaranteed benefits are paid.
•
Ongoing future probables
– those ongoing plans with an estimated date of
insolvency within ten years of the valuation date. These plans have assets and
receive employer contributions and perhaps withdrawal liability payments, but
the financial resources of the plans are expected to be insufficient to meet their
benefit payment obligations within the next ten years.
Reasonably Possible
plans are those ongoing multiemployer plans with an estimated
date of insolvency lying between ten and twenty years from the valuation date.
PBGC’s Financial assistance Program
under the multiemployer insurance program, PBgC generally provides financial
assistance to an insolvent plan in the form of a loan or loans, although it occasionally
provides lump-sum settlements in lieu of future financial assistance. loans are usually
made quarterly but sometimes monthly in an amount which, when combined with the
plan’s other income, covers both the plan’s reasonable administrative expenses and its
statutorily guaranteed benefits payments. if it recovers financially, the plan is obligated
to repay this financial assistance in accordance with the terms and conditions specified
by PBgC. insolvent multiemployer plans seldom recover, and repayment of PBgC’s
financial assistance is rare.
8Therefore, PBgC has established an allowance on its books
to cover the expected present value of non-recoverable future financial assistance.
Before 1999, PBgC did not make lump-sum payments to insolvent multiemployer
plans or those expected to become insolvent in the future. it now does so in select
cases to close out a plan or to facilitate a merger with another, financially stronger
multiemployer plan. in a closeout, the plan either purchases annuities from the private
insurance market to satisfy its obligations or pays participants lump sums in lieu of
annuities. PBgC generally makes a lump-sum payment to allow a closeout when
administrative expenses would otherwise absorb an unacceptably high proportion of
future financial assistance. PBgC provides a lump-sum payment to facilitate a merger
when it determines that the cost of merging the plan into a financially healthier one
will be lower than paying periodic financial assistance over the expected lives of its
participants
and
it can find a plan willing to complete the merger.
PBgC’s financial assistance is not automatic. a plan must follow certain procedures
to obtain financial assistance. First, it must notify PBgC and the plan’s participants that
it is insolvent. Second, it must inform participants of their statutorily guaranteed benefit
levels. next, it must apply for financial assistance with the PBgC. PBgC must then
verify the insolvency and determine the level of financial assistance it will provide. This
level depends on the amount of contributions and withdrawal liability payments the plan
is receiving, if any. PBgC also reviews the plan’s administrative costs to ensure they are
reasonable. if the plan is demonstrably insolvent, PBgC prepares a promissory note for
the plan’s trustees to sign and arranges for the payment of financial assistance. if the plan
is not demonstrably insolvent, PBgC does not grant the requested financial assistance
payment and may seek to recover financial assistance already granted. each payment
requires a separate financial assistance request and review.
PBgC reviews the plan assets and plan funding for those plans that received financial
assistance in the past but are neither currently receiving financial assistance nor
repay-ing past financial assistance. if the review shows that the value of a terminated plan’s
assets exceeds the present value of the plan’s liabilities (not including the amount owed
PBgC) or that the value of an ongoing plan’s assets plus anticipated plan income exceeds
its anticipated liabilities by more than 20 percent for each of the next three years, then
PBgC may seek repayment of all or part of the financial assistance previously provided,
plus interest. generally, the few plans that received financial assistance in the past but are
no longer receiving it either received large withdrawal liability payments or settlements in
court cases. The income from the withdrawal liability payment or settlement is sufficient
for the plan to pay benefits for a short period of time, but not sufficient to pay all future
guaranteed benefits. Financial assistance is suspended for these plans until they are again
insolvent, and then it resumes.
PBGC’s History of Providing Financial assistance
Prior to the mPPaa changes of September 1980, PBgC trusteed 10 terminated
multiemployer plans with more than 5,700 vested participants. These plans were only 22
percent funded for guaranteed benefits with $8.9 million in assets to cover $39.9 million
in benefit liabilities. as it does under the single-employer program, PBgC took over the
plans’ assets and became responsible for paying benefits directly to the plans’ participants
and beneficiaries. as table m-3 of this
Pension Insurance Data Book
shows, the number
of PBgC payees from multiemployer plans has declined steadily; PBgC has not trusteed
any multiemployer plans since 1980. at the end of Fy 2009, PBgC was paying a total
of about $20,000 in monthly benefits to about 135 participants and beneficiaries from
these 10 plans.
table m-4 of this book shows PBgC’s history of providing financial assistance to
insolvent multiemployer plans. From Fy 1981 through Fy 2009, PBgC provided
just over $500 million in financial assistance to 62 insolvent multiemployer plans. The
number of insolvent plans receiving financial assistance on a year-by-year basis has grown
steadily from one plan receiving about $300,000 in Fy 1981 to 43 plans receiving nearly
$86 million in Fy 2009.
of the 62 plans that PBgC has assisted, 20 received lump-sum payments that
al-lowed them to either merge with healthier multiemployer plans or close out the plan.
Thirteen of these 20 plans also received periodic financial assistance payments. The
other 42 plans that received financial assistance from PBgC received
only
periodic
pay-ments. Thirty-seven of these 42 plans received periodic payments during Fy 2009. of
looking forward, at the end of Fy 2009, PBgC had identified 104
probable
multi-employer plans that either currently receive financial assistance or are expected to receive
it in the future. These plans cover about 136,000 participants. The non-recoverable
future financial assistance to these plans is estimated to be nearly $2.3 billion.
•
Thirty-nine of these 104 plans are
current probables
—currently insolvent plans
that receive or are about to receive financial assistance payments from PBgC.
The present value of non-recoverable future financial assistance payments for
these 39 insolvent plans is estimated to be $890 million.
•
Fifty-two of these plans are
terminated future probables
that have not yet begun
receiving financial assistance. These plans no longer have employers making
con-tributions for covered work, although some plans continue to receive withdrawal
liability payments from employers that withdrew from the plan. These plans
are wasting trusts that currently have enough assets to pay benefits to retirees
and beneficiaries of deceased plan participants. However, PBgC estimates that
these plans will run out of assets before all benefits have been paid and will need
financial assistance at some point in the future. The estimated present value of
the non-recoverable future financial assistance to these plans is $1.037 billion.
•
The remaining 13 plans are
ongoing future probables
. These plans have not
termi-nated and employers continue to make contributions for their active employees’
covered work. However, PBgC estimates that the level of current assets,
con-tributions, and other plan income (e.g., withdrawal liability payments) will be
insufficient to pay all future statutorily guaranteed benefits and that the plans will
need financial assistance within 10 years. The estimated present value of the
non-recoverable future financial assistance to these 13 ongoing plans is $369 million.
in addition, PBgC estimates that another 8 ongoing multiemployer plans may
require an additional $326 million in future financial assistance. These
reasonably
pos-sible
plans are expected to remain solvent for at least the next ten years, so this estimated
future financial assistance is reported in the footnotes of PBgC’s financial statements but
not included as a current liability.
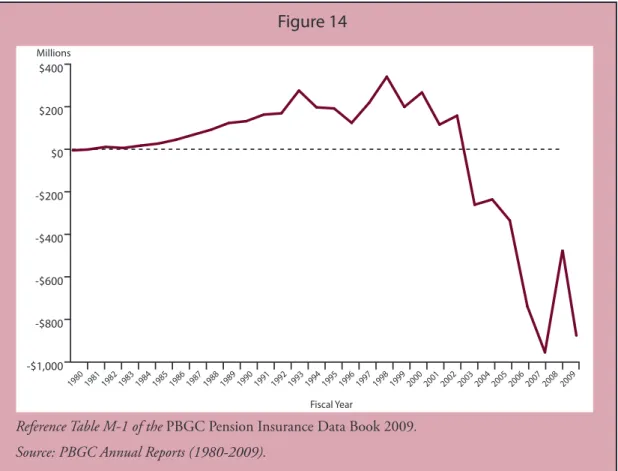
net Financial Position of the
Multiemployer Insurance Program
table m-1 and Figure 14 in this book show the net financial position of the
mul-tiemployer program from Fy 1980 through Fy 2009. That position was positive from
Fy 1982 through Fy 2002. in Fy 2003, the program added five new
probable
plans,
substantially increasing the estimated present value of non-recoverable future financial
assistance and moving the program’s financial position from positive to negative. Several
more plans with large expected assistance needs have been classified as
probable
since
then, especially during Fy 2006. at the end of Fy 2009, PBgC’s multiemployer
insur-ance program had a negative net financial position of $869 million with $1.459 billion
in assets and $2.328 billion in liabilities.
in addition to its regular analysis of multiemployer plans that are potential loss
can-didates, PBgC has recently developed a stochastic simulation model of its multiemployer
program (me-PimS). This model closely parallels the Pension insurance modeling
System that has been used to model exposure in the single-employer insurance program
(Se-PimS). me-PimS was developed to model the different funding rules, nature of
exposure, and possible future outcomes that distinguish the multiemployer program from
the single-employer program. it uses information from a sample of multiemployer plans,
weighted to represent the universe of such plans, to model the effect on the program of a
wide range of scenarios. However, me-PimS does not model the financial condition of
individual contributing employers or of industries that sponsor multiemployer plans.
me-PimS calculates a baseline scenario of future underfunding using current
funding rules and a variety of economic parameters. The baseline underfunding
is based on data from the Forms 5500 of the plans in the sample, the reports these
plans file regarding their status under the funding rules (healthy, endangered, severely
endangered, or critical), and the associated filings that detail how they intend to return
to a “healthy” status. The model simulates the flows of claims (non-recoverable future
financial assistance to plans assumed to move to one of the three probable categories and
program expenses related to providing the financial assistance) that could develop over
a limited time horizon (10-12 years) under 500 combinations of economic situations
and anticipated responses by the plans. me-PimS uses this information along with
simulated premiums and investment returns on program assets to project PBgC’s net
financial position over this time horizon.
me-PimS is not a predictive model. it produces outcomes under 500 different
scenarios, and the probability of any particular outcome is determined by dividing the
number of simulations with that outcome by 500. The model is also used to measure the
impact of proposed legislative changes affecting multiemployer plans and the
multiem-ployer program by adjusting the model’s parameters and comparing the model’s results
with the output from the baseline simulation.
This model estimates dates of insolvency and the present value of non-recoverable
future financial assistance for the sample of plans insured by the multiemployer
insur-ance program. it is designed to estimate the most likely net financial position of the
program ten years in the future given alternative legislative and economic scenarios. The
output from the baseline simulation indicates that there is about a 65 percent chance that
PBgC’s net financial position deficit will get worse over the next 10 years if there are no
changes to plan funding rules or to PBgC’s multiemployer program. The median result
of the baseline scenario is a $2.4 billion deficit in 2019. That is, half the 500 simulations
result in a program deficit of $2.4 billion or less and half the simulations result in a larger
deficit. The mean outcome is higher, a deficit of $4.0 billion. The mean is higher than
the median because there is a chance under some simulations that the deficit could reach
very large levels. For example, the model indicates there is a five percent chance that the
deficit could be greater than $14.5 billion in 10 years.
Conclusions
PBgC’s multiemployer insurance program is the smaller of PBgC’s two insurance
programs. its operations and manner of providing benefits are separate and distinct
from the agency’s larger single-employer program. Whereas the single-employer program
settles claims by taking over a plan’s assets and paying guaranteed benefits directly to
the plan’s participants, the multiemployer program provides financial assistance to the
insolvent plans themselves. The plans, not PBgC, pay guaranteed benefits to
plan participants.
The two programs also provide quite different benefit guarantees. Three guarantee
limitations affect benefits in the single-employer program
9, among them a maximum
insurance limitation. This maximum limitation restricts the benefits PBgC can
guarantee for a 65-year-old in 2010 to $4,500 per month, or $54,000 per year.
10it is
actuarially adjusted if benefits begin at an age other than age 65.
9
See “PBGC’s Guarantee Limits—An Update,” September 30, 2008, at
www.pbgc.gov/docs/guaranteelimits.pdf
.
By contrast, the benefit guarantee under the multiemployer program is based not on
age but on years of covered service in the plan. a participant with 30 years of covered
service, for example, is eligible for a maximum guaranteed benefit of $1,072.50 a month,
or $12,870 per year, regardless of age. in the single-employer program, the maximum
insurance limitation amounts are indexed to changes in Social Security’s old-law
Contribution and Benefit Base. The multiemployer program guarantee is not indexed
and can be changed only by an act of Congress.
in the thirty years the multiemployer program has been providing financial assistance
to insolvent plans, it has helped 62 plans and paid out $500 million in financial
assis-tance. Thirty-nine plans are currently receiving or are about to receive financial assistance
and are classified as
current probable plans
. another 65 plans have been designated as
terminated future probable plans
or ongoing future probable plans and are expected to
need financial assistance in the future. The estimated present value of non-recoverable
future financial assistance to these 104
probable plans
is $2.3 billion. This $2.3 billion
was the major component of the program’s liabilities at the end of Fy 2009. at the same
time, the program had less than $1.5 billion in assets and a deficit of $869 million.
PBgC’s new me-PimS simulation model indicates that, under current rules, there is
about a 65 percent probability that the program’s deficit will grow over the next 10 years.
The model’s mean estimated deficit at that time is $4 billion, nearly five times the current
level. The model estimates there is only an 11 percent probability that the program will
be in surplus in 2019.
PbGC D
ata
aND
t
reNDS
net Position of PBGC’s
Single-employer Program (1980-2009)
•
PBgC’s single-employer program was in deficit from its inception
until 1996.
•
it then had a growing surplus that reached a historic high of $9.7 billion
in 2000.
•
PBgC’s financial position then fell to a deficit of $23.3 billion in 2004 as
the result of several very large losses (primarily from steel and airline industry
plans), lower interest rates, and declining stock prices.
•
rising interest rates and improving financial markets reduced the deficit to
$10.7 billion at the end of Fy 2008, but lower interest rates and new claims
increased the deficit to $21.1 billion at the end of Fy 2009.
Figure 1
Reference Table S-1 of the
PBgC Pension insurance Data Book
2009
.
Source: PBGC Annual Reports (1980-2009).
PBGC’s Net Position is the difference (with some adjustments) between the insurance program’s total
assets and total liabilities.
$-24 $-18 $-12 $-6 $0 $6 $12 2008 2006 2004 2002 2000 1998 1996 1994 1992 1990 1988 1986 1984 1982 1980 1981 1983 1985 1987 1989 1991 1993 1995 1997 1999 2001 2003 2005 2007 2009 (Restored LTV Plans) Billions Fiscal Year
Concentration of PBGC Claims (1975-2009)
Single-employer Program
•
Since 1975, 3,993 terminations of underfunded single-employer plans have
resulted in total claims of $42.9 billion.
•
total annual claims have varied widely, ranging from a low of $28.6 million
in 1984 to a high of more than $11.2 billion in 2005.
•
The firms presenting the ten largest claims have accounted for more than
63 percent of all claims against PBgC from 1975 to 2009.
$0 $1,000 $2,000 $3,000 $4,000 $5,000 $6,000 $7,000 $8,000 $9,000 $10,000 $11,000 $12,000 Top 10 Claims All Other Claims
2008 2009 2007 2006 2005 2004 2003 2002 2001 2000 1999 1998 1997 1996 1995 1990-1994 1985-1989 Pre-1985 Millions Total Claims 1975 - 2009 63.3% 36.7%
Date of Plan Termination (Fiscal Year)
Figure 2
Reference Table S-4 of the
PBgC Pension insurance Data Book 2009
.
Sources: PBGC Fiscal Year Closing File (9/30/2009) and PBGC Case Management System.
Note: Claims are termination liabilities minus plan assets. They do not include recoveries.
PBGC Claims by Industry (1975-2009)
Single-employer Program
•
Plans terminated by firms in the Primary metals and air transportation
industries have accounted for 60 percent of PBgC’s claims.
•
Those sponsored by motor Vehicle equipment manufacturers are responsible
for another 15 percent of claims.
•
an additional six percent of claims have come from plans sponsored by the
Fabricated metals and machinery industries.
Figure 3
Primary Metals
27.2%
Motor Vehicle
Equipment
15.3%
Air Transportation
32.9%
Other Non-Manufacturing 8.9% Other Manufacturing 9.6% Fabricated Metal Products 3.4% Machinery 2.7%Reference Table S-19 of the
PBgC Pension insurance Data Book 2009
.
PBGC Claims by Funded Ratio (1975-2009)
Single-employer Program
•
Sixty percent of pension claims came from plans that were less than
50 percent funded (using PBgC assumptions).
•
only $678 million of the $42.9 billion in total claims came from plans
terminating with funded ratios of 75 percent or higher.
Figure 4
25% to 49% Funded Ratio 52.3% 50% to 74% Funded Ratio 36.6% Less than 25% Funded Ratio 9.5% 75% or Higher Funded Ratio 1.6%Reference Table S-11 of the
PBgC
Pension insurance Data Book 2009
.
Participants and Beneficiaries Receiving
PBGC Payments (1980-2009)
Single-employer Program
•
PBgC’s responsibility for paying pension benefits has increased substantially
since 1980.
•
in 2009, PBgC made periodic payments to nearly 750,000 payees and
lump-sum payments to 12,000 participants.
•
an additional 565,000 individuals are eligible for future PBgC
benefit payments.
•
The large increase since 2001 reflects PBgC’s trusteeship of several large plans
with large numbers of participants.
0 250 500 750 1,000 1,250 1,500 Deferred Status In Pay Status 2008 2007 2009 2006 2005 2004 2003 2002 2001 2000 1999 1998 1997 1996 1995 1994 1993 1992 1991 1990 1989 1988 1987 1986 1985 1984 1983 1982 1981 1980 Thousands Fiscal Year
Figure 5
Reference Table S-20 of the
PBgC Pension insurance Data Book 2009
.
Sources: PBGC Participant System (PRISM), fiscal year calculations, PBGC Management
Reports, and PBGC Benefit Payment Reports.
Participants and Beneficiaries Receiving
PBGC Payments by Gender and age (2009)
Single-employer Program
•
Payees receiving PBgC payments are distributed across all retiree age groups.
•
in all age groups except the oldest, male payees outnumber female payees.
Figure 6
0 25 50 75 100 125 150 Females Males 85 or Older 80-84 75-79 70-74 65-69 60-64 Younger Than 60 ThousandsReference Table S-23 of the
PBgC
Pension insurance Data Book 2009
.
Sources: PBGC Participant System (PRISM), fiscal year calculations, PBGC Management Reports, and
PBGC Benefit Payment Reports.
PBGC Benefit Payments (1980-2009)
Single-employer Program
•
PBgC’s important role in the private pension system is
illustrated by the continuing increase in payments over its history.
•
in 2009, PBgC disbursed nearly $4.5 billion in monthly pension and
lump-sum benefit payments to retired plan participants or their beneficiaries.
Figure 7
$0 $1,000 $2,000 $3,000 $4,000 $5,000 $500 $4,500 $3,500 $2,500 $1,500 2008 2009 2007 2006 2005 2004 2003 2002 2001 2000 1999 1998 1997 1996 1995 1994 1993 1992 1991 1990 1989 1988 1987 1986 1985 1984 1983 1982 1981 1980 Millions Fiscal YearReference Table S-20 of the
PBgC
Pension insurance Data Book 2009
.
Sources: PBGC Participant System (PRISM), fiscal year calculations, PBGC Management Reports, and
PBGC Benefit Payment Reports.
PBGC-Insured Plans (1980-2009)
Single-employer Program
•
The total number of single-employer plans insured by PBgC has
declined substantially in the past 24 years.
•
in 2009, PBgC insured about 27,650 single-employer defined benefit
plans, down from an all-time high of 112,000 plans in 1985.
•
This decline primarily reflects a large number of terminations among
small plans.
Figure 8
0 20,000 40,000 60,000 80,000 100,000 120,000 5,000 or more participants 1,000-4,999 participants 100-999 participants Fewer than 100 participants2008 2009 2007 2006 2005 2004 2003 2002 2001 2000 1999 1998 1997 1996 1995 1994 1993 1992 1991 1990 1989 1988 1987 1986 1985 1984 1983 1982 1981 1980 Size of Plan Fiscal Year
Reference Table S-31 of the
PBgC
Pension insurance Data Book 2009
.
Source: PBGC Premium Filings, various years.
Participants in PBGC-Insured Plans (1980-2009)
Single-employer Program
•
in 2009, PBgC provided pension insurance protection to about
33.6 million participants in single-employer plans.
•
The total number of participants has been declining slowly since 2004.
Figure 9
0 10 20 30
40 Fewer than 100 participants 100-999 participants 1,000-4,999 participants 5,000 or more participants 2008 2009 2007 2006 2005 2004 2003 2002 2001 2000 1999 1998 1997 1996 1995 1994 1993 1992 1991 1990 1989 1988 1987 1986 1985 1984 1983 1982 1981 1980 Size of Plan Millions Fiscal Year
Reference Table S-30 of the
PBgC
Pension insurance Data Book 2009
.
Source: PBGC Premium Filings, various years.
PBGC-Insured Participants by Participant Status (1980-2007)
Single-employer Program
•
The percentage of participants in insured single-employer plans who are
active workers has declined from 78 percent in 1980 to 41 percent in 2007.
•
The greatest participant growth since 1980 has occurred among separated
vested participants.
Figure 10
0% 20% 40% 60% 80% Separated Vested Retired Active 2006 2007 2005 2004 2003 2002 2001 2000 1999 1998 1997 1996 1995 1994 1993 1992 1991 1990 1989 1988 1987 1986 1985 1984 1983 1982 1981 1980 100%Percent of Total Participants
Year
Reference Table S-32 of the
PBgC
Pension insurance Data Book 2009
.
Source: Internal Revenue Service Form 5500 Series filings for single-employer plans.
Data for plan years prior to 1999 include only plans with 100 or more participants.
PBGC-Insured Participants by Industry (2008)
Single-employer Program
•
While PBgC covers workers in all major industrial sectors, nearly
half of all covered single-employer participants are in plans sponsored
by manufacturing firms.
•
Substantial numbers of participants can also be found in plans
sponsored by firms in the Services sector and the Finance, insurance, and
real estate sector.
Figure 11
Manufacturing
45.2% Finance, Insurance & Real Estate 12.8% Information 7.1%Services
18.1%
Other
Industries
16.8%
Major Manufacturing Groups:Motor Vehicles 6.3%
Chemical and Allied
Products 5.2%
Food and Tobacco 3.9%
Machinery 3.3%
Primary Metals 1.6%
Reference Table S-38 of the
PBgC
Pension insurance Data Book 2009
.
Source: PBGC Premium Filings.
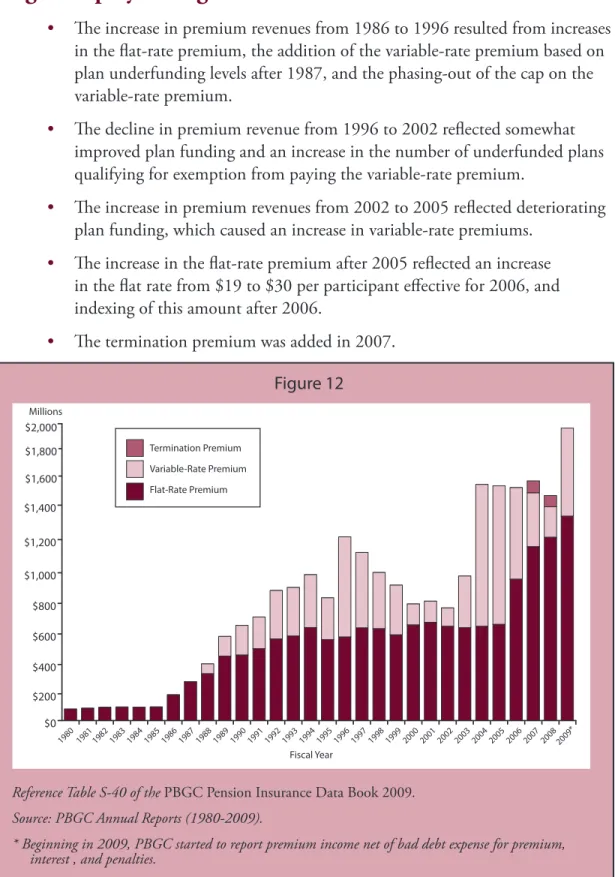
PBGC Premium Revenue (1980-2009)
Single-employer Program
•
The increase in premium revenues from 1986 to 1996 resulted from increases
in the flat-rate premium, the addition of the variable-rate premium based on
plan underfunding levels after 1987, and the phasing-out of the cap on the
variable-rate premium.
•
The decline in premium revenue from 1996 to 2002 reflected somewhat
improved plan funding and an increase in the number of underfunded plans
qualifying for exemption from paying the variable-rate premium.
•
The increase in premium revenues from 2002 to 2005 reflected deteriorating
plan funding, which caused an increase in variable-rate premiums.
•
The increase in the flat-rate premium after 2005 reflected an increase
in the flat rate from $19 to $30 per participant effective for 2006, and
indexing of this amount after 2006.
•
The termination premium was added in 2007.
Figure 12
$0 $200 $400 $600 $800 $1,000 $1,200 $1,400 $1,600 $1,800 $2,000 Termination Premium Variable-Rate Premium Flat-Rate Premium 2008 2009* 2007 2006 2005 2004 2003 2002 2001 2000 1999 1998 1997 1996 1995 1994 1993 1992 1991 1990 1989 1988 1987 1986 1985 1984 1983 1982 1981 1980 Millions Fiscal YearPBGC-Insured Participants and Premiums
by Premiums Paid (2008)
Single-employer Program
•
The PBgC variable-rate premium is based on the level of a
plan’s unfunded liabilities.
•
about one in four participants were in plans paying the
variable-rate premium in 2008.
Flat-Rate
82.1%
Flat-Rate
Only
76.3%
Variable-Rate 23.7% Variable-Rate 17.9%Insured Participants
Total Premiums*
Figure 13
Reference Tables S-41 and S-42 of the
PBgC Pension insurance Data Book 2009
.
Source: PBGC Premium Filings.
PbGC D
ata
aND
t
reNDS
net Position of PBGC’s
Multiemployer Program (1980-2009
)
•
PBgC’s multiemployer program was in surplus from 1982 to 2002.
•
The program reported a deficit of $869 million in 2009.
Figure 14
-$1,000 -$800 -$600 -$400 -$200 $0 $200 $400 2008 2007 2006 2005 2004 2003 2002 2001 2000 1999 1998 1997 1996 1995 1994 1993 1992 1991 1990 1989 1988 1987 1986 1985 1984 1983 1982 1981 1980 2009 Millions Fiscal YearReference Table M-1 of the
PBgC
Pension insurance Data Book 2009
.
Source: PBGC Annual Reports (1980-2009).
PBGC’s net position is the difference (with some adjustments) between the insurance program’s total assets
and total liabilities.
PBGC-Insured Plans (1980-2009)
Multiemployer Program
•
The total number of multiemployer plans insured by PBgC has
declined slowly in the past 27 years.
•
This decline primarily reflects the loss of plans with fewer than
1,000 participants.
•
This decline is primarily due to plan mergers.
Figure 15
0 750 1,500 2,250 3,000Fewer than 1,000 participants 1,000-4,999 participants 5,000 or more participants 2008 2009 2007 2006 2005 2004 2003 2002 2001 2000 1999 1998 1997 1996 1995 1994 1993 1992 1991 1990 1989 1988 1987 1986 1985 1984 1983 1982 1981 1980 Size of Plan Fiscal Year
Reference Table M-6 of the
PBgC
Pension insurance Data Book 2009
.
Source: PBGC Premium Filings, various years.
Participants in PBGC-Insured Plans (1980-2009)
Multiemployer Program
•
in 2009, PBgC provided pension insurance protection to more
than 10.4 million participants in multiemployer plans.
•
This represents a 30 percent increase over the total number of
participants covered in 1980.
•
This increase occurred primarily in plans with 5,000 or more participants.
Figure 16
0 2 4 6 8 10 12Fewer than 1,000 participants 1,000-4,999 participants 5,000 or more participants 2008 2009 2007 2006 2005 2004 2003 2002 2001 2000 1999 1998 1997 1996 1995 1994 1993 1992 1991 1990 1989 1988 1987 1986 1985 1984 1983 1982 1981 1980 Size of Plan Millions Fiscal Year
Reference Table M-5 of the
PBgC
Pension insurance Data Book 2009
.
Source: PBGC Premium Filings, various years.
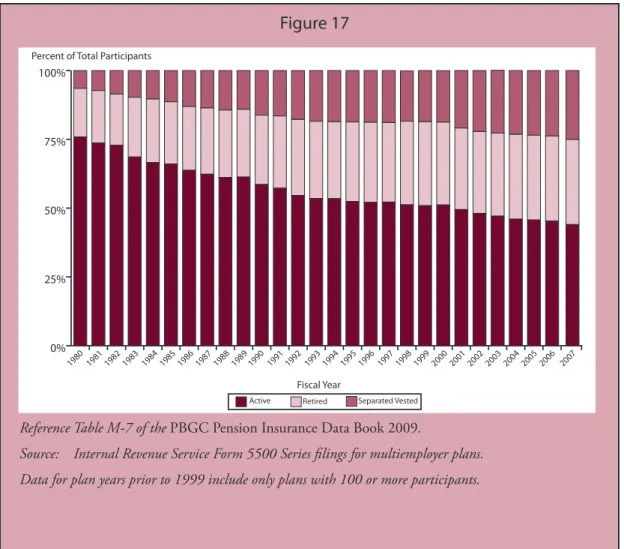
PBGC-Insured Participants by Participant Status (1980-2007)
Multiemployer Program
•
although the total number of multiemployer plan participants that
PBgC covers has grown, the percentage of these participants that
are active workers fell from 76 percent in 1980 to 45 percent in 2007.
Figure 17
0% 25% 50% 75% 100% Separated Vested Retired Active 2006 2007 2005 2004 2003 2002 2001 2000 1999 1998 1997 1996 1995 1994 1993 1992 1991 1990 1989 1988 1987 1986 1985 1984 1983 1982 1981 1980Percent of Total Participants
Fiscal Year
Reference Table M-7 of the
PBgC
Pension insurance Data Book 2009
.
Source: Internal Revenue Service Form 5500 Series filings for multiemployer plans.
Data for plan years prior to 1999 include only plans with 100 or more participants.
PBGC-Insured Participants by Industry (2008)
Multiemployer Program
•
While PBgC covers workers in all major industrial sectors, the
construction trades account for more than one-third of all covered
multiemployer plan participants.
Figure 18
Construction 36.4% Other 6.6% Services 17.6% Retail Trade 13.8% Manufacturing 11.6% Truck Transportation 13.9%Major Construction Groups:
Electrical Work 7.6%
Building Construction 7.0% Foundation, Structure, and Exterior Work 5.0%
Heavy Construction 4.3%
Plumbing, Heating,
and Air Conditioning 4.1%