The Effect of Service Quality and Customer Satisfaction on
Customer Loyalty of Small Scale Indonesian
Food Enterprises in Surabaya
Herry Christian Palit
1, Monika Kristanti
2, Debora Anne Yang Aysia
1and Apfia Priskila
1 1Industrial Engineering Department, Petra Christian University, Surabaya, Indonesia
2
Hotel Management Program, Petra Christian University, Surabaya, Indonesia
Abstract
:
This research aims to improve the customer loyalty of small scale Indonesian food enterprises (SIFE) in Surabaya from service quality and customer satisfaction perspectives. The respondents of this research came from 50 small scale Indonesian food enterprises in Surabaya. There are two methods to analyze the data, factor analysis and structural equation model analysis using GeSCA. The results shows that service quality influences significantly to customer satisfaction. Service quality also has a significant effect to customer loyalty. Customer satisfaction influences significantly to customer loyalty and acts as a perfect mediator variable that connects between service quality and customer loyalty of SIFE.Keywords:
service quality, customer satisfaction, customer loyalty, factor analysis, GeSCA1.
Introduction
Food businesses are still have a big prospect in Surabaya. The number of food businesses increase every year. As stated by Tjahjono Haryono, Chairman of Indonesian Café & Restaurant Business Association in East Java, the number of food and beverage businesses in East Java grow almost 20% per year (3) and they prefer to serve Indonesian food than foreign food. However, Indonesian food businesses should realize that they have to compete with foreign food businesses which is managed well and professionally. The lack of good promotion and publicity become the main problem of Indonesian food business as stated by Rahayu Setyowati, Chairman of Indonesian Catering Business Association (16). Therefore, the Indonesian food businesses should improve their performance to survive in this competition. Our study focuses on one of Indonesian food businesses which is called small scale Indonesian food enterprises (SIFE), and the research objects are SIFE in all areas of Surabaya (called as depot in Surabaya). Usually SIFE only have a small number of employees, minimum decoration and simple menu appearance.
Several preliminary researches showed that customer satisfaction and customer loyalty were used to measure the performance from customer perspective. Angelova & Zekiri (2), Mahfooz (9), El-Said & Fathy (6) and Al-Tit (1) found that customer satisfaction was influenced by the service quality. Other studies showed that customer satisfaction was a perfect mediator variable between service quality and customer loyalty ([4]; [13]). Based on these several studies, this research is conducted to know whether service quality is directly affect to customer satisfaction and customer loyalty or not. Also, this study would like to know whether customer satisfaction acts as a perfect mediator variable between service quality and customer loyalty or not. By this investigation, the owners of SIFE could know what they should do with their customers.
2.
Literature review
2.1.
Service quality
Service quality is defined as an extent to which a service meets customer needs and can be measured by comparing the customer expectations with the customer perceptions to the service that is received (10). Parasuraman et al. (11) developed an instrument to measure service quality from customer perspective that was called SERVQUAL. This instrument is divided into two parts, namely customer expectations and perceptions where each part consists of 22 items and five dimensions, namely tangible, reliability, responsiveness, assurance, and empathy (12). Stevens, Knutson and Patton (14) made a measurement instrument for the service quality of
restaurants which was the development of SERVQUAL, and was called DINESERV. DINESERV consists of 29 items that using a seven-point scale and five dimensions of SERVQUAL:
Tangible : physical design restaurant, employee appearance and cleanliness.
Reliability : freshness and temperature of the food, bill accuracy and presentation of the food and in which order.
Responsiveness : the willingness of staffs to help consumers with the choice of menu or wine and responses of the needs and demands of customers.
Assurance : the customers can trust the staff recommendations, be sure that the food are served free of contamination and can give feedback without fear.
Empathy : staffs provide individual attention to the customers.
Sukmono and Sudarso (15) said that service quality is one of two important variables that influences customer loyalty, beside marketing mix. Other studies proved that service quality has a positive impact to customer satisfaction ([6]; [9]; [1]; [2]). Therefore, we propose the following hypothesis:
H1.a : Service quality has a positive effect on customer loyalty of SIFE H1.b : Service quality has a positive effect on customer satisfaction.
2.2.
Customer satisfaction
Hansemark and Albinson (8) said that satisfaction is the overall customer attitudes toward the service provider, or emotional reaction to the difference between their expectations and what they are accepted. Satisfaction is happy or disappointed feeling from customers by comparing the performance of the product and what they are expected. There are three attributes to measure the customer satisfaction (5), namely:
Attribute related to product.
Attribute related to service, likely guarantee or warranty, delivery, complaint handling, resolution of problem.
Attributes related to purchase, likely courtesy, communication, easy or convenience, acquisition, company reputation, and company competence.
Caruana (4) and Quddus and Hudrasyah (13) found that customer satisfaction was a perfect mediator between service quality and customer loyalty. Therefore, we propose the following hypothesis:
H2 : Customer satisfaction has a positive effect on customer loyalty of SIFE
2.3.
Customer loyalty
Loyalty is related to customers who want to repeat their purchasing about the products or services that are offered by the company if the company is able to meet their needs and wants for products or services. Bowen and Chen said that the customer loyalty is not only the desire to buy more than once, but the willingness to communicate word-of-mouth positively (13).
3.
Research method
Population of this research is customers of SIFE in Surabaya who had been 17 years old or more and had eaten at least twice. The SIFE are located in 4 regions of Surabaya, 10 SIFE in center of Surabaya, 9 SIFE in west of Surabaya, 13 SIFE in east of Surabaya and 15 SIFE in south of Surabaya. The criteria of SIFE are:
Selling minimum one of 10 favorite Indonesian foods
i.e. pecel, rujak cingur, gado-gado, chicken
soto, rawon, javanese fried rice, padang rice, gudeg, meatball, and mixed tofu,
Should be clean enough and use ceramic for flooring
Having minimum decoration
Having maximum only one branch
Having own permanent building, not in the food court
The concept is not café
Almost 80% of the menu are Indonesian food
The price range is 8,000 – 25,000 rupiahs
A seven-point Likert scale questionnaire is used and divided into two sections: demographic characteristics and the main body of questionnaire (service quality variable, customer satisfaction variable and customer loyalty variable). Service quality is measured by 5 dimensions. They are tangible, reliability, responsiveness, empathy, and assurance. Customer satisfaction is measured by 3 dimensions, namely satisfaction of product, service, and purchasing. Each dimensions of service quality and customer satisfaction have their own indicators. Customer loyalty is measured by 2 indicators, namely repeating purchasing and positive word-of-mouth. The main body of questionnaire consists of 25 items (indicators). Validity and reliability test of all items were conducted toward 30 respondents from three SIFE. The results showed that all items was valid and reliable. After the questionnaire valid and reliable, the questionnaire was distributed to 500 respondents from 50 SIFE.
Because of singularity or multicollinearity problem which the determinant value of the matrix is zero, then the data analysis should be conducted in two stages. First stage is confirmatory factor analysis for each dimension of all latent variables using SPSS and the second one is structural model analysis of all latent variables using GeSCA. GeSCA is a component based Structural Equation Modeling (SEM) which the latent variable can be defined as the weighted component of manifest variable (7). GeSCA is used in order to confirm the theory and explain the relationship between latent variables. Also, this method is so powerful since the data should not have normal distribution and could be used for small sample sizes.
4.
Discussion
The majority of the customers are dominated by young people, 17-25 years old (40%). Most of them had eaten in SIFE more than five times (52%) and had known the SIFE when they were passing through the SIFE (57%). Most respondents had attained their highest education level minimum at high school degree level (45%) and most of them worked as private employees (30%) which their incomes were less than 4 million rupiahs (64%).
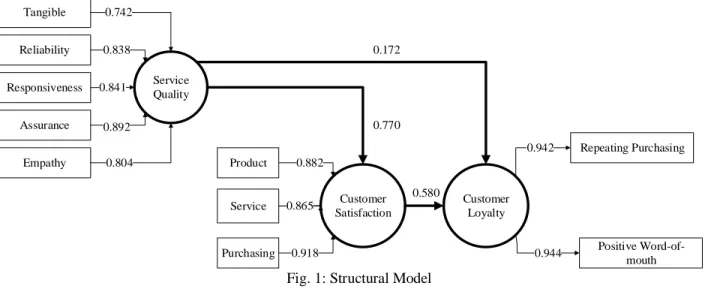
The reliability of the model could be measured by AVE value and Cronbach Alpha. As seen in Table 1, Reliability of four latent variables could be considered well because all latent variables had AVE ≥ 0.5 and Cronbach Alpha ≥ 0.7. Figure 1 shows that five dimensions of service quality which are tangible, reliability, responsiveness, assurance, and empathy, could explain the service quality well (loading factor ≥ 0.5), and the assurance (loading factor = 0.892) becomes the dimension that could explain most of service quality. Assurance is an ability of small scale Indonesian food enterprises to build the customer’s trust, knowledge and courtesy of employees. The strongest indicator in explaining the assurance is the employees can answer the customer questions well and exactly (81%).
TABLE 1. Reliability of latent variable
Variable AVE Cronbach Alpha
Service Quality 0.681 0.882
Customer Satisfaction 0.787 0.865
Fig. 1: Structural Model
The three dimensions of customer satisfaction, such as product, service, and purchasing are valid (loading factor ≥ 0.5) and the dimension that could explain most the customer satisfaction is satisfaction to the purchasing (loading factor = 0.914). The strongest indicator of purchasing is courtesy and communication (90.5%). The customers is satisfied to the courtesy and attention that is shown by employees and the information that had been given to the customers.
Two indicators of loyalty customer could be the strongest indicators that explain the loyalty customer which are repeating purchasing (loading factor = 0.942) and positive word-of-mouth (loading factor = 0.944). It had been proved from the demographic characteristic of respondents that has been eaten more than five times in the same SIFE (52%) and suggested to others, such as friends and family for visiting the enterprises (41%).
Based on Table 2, it can be seen that service quality influences directly to customer loyalty (see hypothesis H1.a) and also to customer satisfaction (see hypothesis H1.b). Customer satisfaction has a positive effect to customer loyalty of SIFE (see hypothesis H2). Hence, service quality has an effect on whether to customer satisfaction or could be directly to customer loyalty. However, it could be seen from path coefficient in Table 2 that coefficient score of service quality and customer satisfaction (0.770) is higher than coefficient score of service quality and customer loyalty (0.172). Therefore, the best path of structural model is service quality to customer satisfaction and then to customer loyalty. It means customer satisfaction become a perfect mediator to connect the service quality to customer loyalty. This is similar to previous research that was done by ([4], [13]) who stated that customer satisfaction acts as a mediator variable between service quality and customer loyalty. In another way, it could be stated that the customers of SIFE will be loyal if they have satisfied before.
TABLE 2. Path coefficient structural model
Hypothesis Path Coefficient CR Result
H1.a Service quality → Customer loyalty 0.172 2.56* Accepted
H1.b Service quality → Customer satisfaction 0.770 29.43* Accepted
H2 Customer satisfaction → Customer loyalty 0.580 8.91* Accepted CR* = significant at .05 level or CR ≥ 2
5.
Recommendations
This section will explain some recommendations based on the research finding. It is important for the owner of SIFE to increase their performance by improving and maintaining some important indicators from service quality and customer satisfaction perspective. The important things to do from the service quality are:
Comfortable dining area, such as the arrangement of chairs, tables, and other furniture, so customers can be comfortable when they are eating
Taste of the food is consistent (not too salty or sweet).
Service Quality Customer Satisfaction Customer Loyalty Responsiveness Tangible Reliability Assurance Empathy Service Product
Purchasing Positive
Word-of-mouth Repeating Purchasing 0.942 0.944 0.580 0.770 0.172 0.841 0.892 0.804 0.858 0.918 0.882 0.838 0.742 0.865
The bill should be accurate
Serving the food exactly as the customers ordered it
Provides of prompt and quick service
SIFE has a good service even though the SIFE is busy
Employees can answer customer’s questions well and completely
The good interaction between employees and customers, both verbal and non-verbal so that customers can feel comfortable and confident
Employees have a good knowledge about the food
Employees know their customer and habits well, like remembering names and menus are often ordered so that customers will feel special
Employees should be friendly
Also, the owners of SIFE should aware about some important things that make customers feel satisfied, such as:
The variation of menu.
The display of food that is served.
The service of them which will change the food and drinks with the new one when it is not good, such as stale, dirty, there is flies in food, etc.
The services of them on complaint handling.
The politeness, attention and friendliness of employees.
The information that is communicated to customers by employees, such as the availability of menus, facilities, etc.
Afterward, if customers are satisfied, they will become the loyal customers of SIFE and they are willing to repeat their purchasing and say the good things to the other people, such as the good taste of the food, the cheaper prices, big portion and etc.
6.
Conclusion
This study concludes that service quality affects significantly to customer satisfaction and customer loyalty. Nevertheless, service quality has stronger relationship to customer satisfaction than customer loyalty. Customer satisfaction significantly influences customer loyalty and acts as mediator variable between service quality and customer loyalty. Customer satisfaction could be explained by service quality about 59.3% and customer loyalty could be explained by customer satisfaction about 52.1%.
The best dimension could describes service quality is assurance which the strongest indicator of assurance is employees can make customers feel comfortable and confident. The best dimension of customer satisfaction is attribute related to purchase which the strongest indicator is courtesy and communication. Customer loyalty does not have dimensions, but both indicators, repeating purchasing and positive word-of-mouth are very strong for explaining it.
7.
Acknowledgements
This research was funded through generous grants by Ministry of Research, Technology, and Higher Education of the Republic of Indonesia in 2016.
8.
References
[1] A. A. Al-Tit, “The Effect of Service and Food Quality on Customer Satisfaction and Hence Customer Retention,”
Asian Social Science, vol. 11 (23), pp. 129-139, 2015.
[2] B. Angelova and J. Zekiri, “Measuring Customer Satisfaction with Service Quality Using American Customer Satisfaction Model (ACSI Model),” International Journal of Academic Research in Business and Social Sciences, vol. 1 (3), pp. 232-258, 2011.
[3] Angga. (2014). Pembangunan Infrastruktur Pacu Industri Mamin. Available at http://umkmnews.com/news/ pembangunan-infrastruktur-pacu-industri-mamin.html (accessed 21 December 2015)
[4] A. Caruana, (2002). “Service Loyalty: The Effects of Service Quality and the Mediating Role of Customer Satisfaction,” European Journal of Marketing, vol. 36 (7/8), pp. 811-828, 2002.
[5] A. Dutka, AMA Hand Book of Customer Satisfaction: A Complete Guidance to Research Planning and Implementation, 2nd edition, Illinois, USA: NTC Bussiness Book, 1995.
[6] O. A. El-Said and E. A. Fathy, “Assessing University Students' Satisfaction with on-Campus Cafeteria Services,”
Tourism Management Perspectives, vol. 16, pp. 318-324, 2015
[7] I. Ghozali and K. A. Kusumadewi, Generalized Structural Component Analysis (GeSCA): Model Persamaan Struktural Berbasis Komponen, Semarang: Badan Penerbit Universitas Diponegoro, 2013
[8] O. C. Hansemark and M. Albinson, “Customer Satisfaction and Retention: The Experiences of Individual with Employees,” Managing Service Quality, vol. 14 (1), pp. 40-57, 2004
[9] Y. Mahfooz, “Relationship between Service Quality and Customer Satisfaction in Hypermarkets of Saudi Arabia,”
International Journal of Marketing Studies, vol. 6 (4), pp. 10-22, 2014
[10] S. Markovic, S. Raspor and K. Segaric, “Does Restaurant Performance Meet Customers’ Expectations? An Assessment of Restaurant Service Quality Using a Modified Dineserv Approach,” Tourism and Hospitality Management, vol. 16 (2), pp. 181-195, 2010
[11] A. Parasuraman, L. L. Berry and V. A. Zeithaml, “A Conceptual Model of Service Quality and its Implications for Future Research,” Journal of Marketing, vol. 49, pp. 41-50, 1985
[12] A. Parasuraman, V. A. Zeithaml and L. L. Berry, “SERVQUAL: A Multiple-item Scale for Measuring Consumer Perceptions of Service Quality,” Journal of Retailing, vol. 64 (1), pp. 14-40, 1988
[13] F. S. A. Quddus and H. Hudrasyah, “The Influence of Service Quality Dimensions on Customer Satisfaction and Customer Loyalty in PT. JNE North Bandung Area,” Journal of Business and Management, vol. 3 (5), pp. 546-556, 2014
[14] P. Stevens, B. Knutson and M. Patton, “DINESERV: A Tool for Measuring Service Quality in Restaurants,” The Cornell Hotel and Restaurant Administration Quarterly, vol. 36 (2), pp. 56-60, 1995
[15] R. A. Sukmono and I. Sudarso, “Analisa Pengaruh Bauran Pemasaran dan Kualitas Layanan terhadap Loyalitas Pelanggan dengan Metode Structural Equation Modelling (Studi Kasus: BNI Cabang Tanjung Perak Surabaya),” in
Prosiding Seminar Nasional Manajemen Teknologi XIII, 2011, pp. 1-10
[16] I. Susanti. (2015). Kuliner Indonesia Kurang Promosi. Available at http://nasional.sindonews.com/ read/987575/149/kuliner-indonesia-kurang-promosi-1428634042 (accessed 13 December 2015)