Framework for Business Process
Redesign
W.M.P. van der Aalst
K.M. van Hee
Department of Mathematics and Computing Science, Eindhoven University of Technology, P.O. Box 513, 5600 MB, Eindhoven, The Netherlands, telephone: -31 40 474295, e-mail: [email protected]
A framework based on high-level Petri nets is used to model and analyse business processes. This framework is a powerful tool to support business process reengineering efforts. The ‘’What, how and by whom?” approach is introduced to guide the application of this Petri net based framework.
Keywords: business process (re)design; high-level Petri nets; simulation; ‘what if’-analysis.
1
Introduction
An increasing number of firms are marching to the drumbeat of business process
redesign (BPR), alternatively called reengineering. The term reengineering may be new,
but the idea of process redesign is familiar to most engineers involved in logistics and production control. Just-in-time (JIT), Total Quality Management (TQM), Flexible Manufacturing Systems (FMS), Computer Integrated Manufacturing (CIM) and Computer Integrated Logistics (CIL) are some of the buzz words used to signify process redesign trends in logistics and manufacturing control. However, business process redesign is not restricted to logistics and manufacturing, it also applies to administrative, commercial and managerial processes. Nevertheless, we think that many of the techniques, tools and methods developed for logistics and production control can be used in the context of business process redesign.
Business process redesign focusses on the fundamental rethinking of business processes, ignoring organisational boundaries. However, before implementing new business processes, we want to compare the existing situation with the new (redesigned) situation. Therefore, we need a tool to quickly capture and model existing processes but also new processes. This tool should support rigorous changes and catalyze creative thinking. Moreover, we would like to use this tool to analyse and compare alternative business processes.
In this paper high-level Petri nets are proposed as a tool for the modelling and analysis of business processes. Petri nets have proved to be useful in the context of logistics and production control (cf. [2, 4, 5, 19, 24]). However, the application of these Petri nets is
not restricted to logistics and manufacturing, they can also be used to support business process reengineering efforts.
High-level Petri nets are based on the classical Petri net model introduced by Carl Adam Petri ([23]). The high-level Petri net model used in this paper is extended with ‘colour’, ‘time’ and ‘hierarchy’. These extensions allow for the representation and study of complex business processes. The high-level Petri net inherits all the advantages of the classical Petri net, such as the graphical and precise nature, the firm mathematical foundation and the abundance of analysis methods. The graphical nature of Petri net is a very important feature in the context of business process redesign. However, the practical use of high-level Petri nets and related analysis methods highly depend upon the availability of adequate computer tools. Fortunately, some tools, based on high-level Petri nets, have been put on the market. These tools support the modelling and analysis business process. Thanks to these tools high-level Petri nets have been put into practice successfully.
To support the use of high-level Petri net for reengineering purposes, we have developed the ‘’What, how and by whom?” approach. This approach identifies three consecutive phases in the application of high-level Petri nets to business process redesign. In the
what phase the primary objectives of a company or business unit are investigated. In the
second phase, it is determined how these objectives can be reached. This phase is used to identify the required activities and the ordering of these activities. In the by whom phase, the allocation of resources (e.g. manpower and machines) to these activities is
determined.
The remainder of this paper is organised as follows. We start with a short introduction to business process redesign, followed by an introduction to high-level Petri nets. Then we show how the ‘’What, how and by whom?” approach can be used to map business processes onto a high-level Petri net. This is illustrated by an example.
2
Business process (re)design
Reengineering business processes means tossing aside existing processes and starting over. In Hammer and Champy [13] business process redesign (reengineering) is defined as “the fundamental rethinking and radical redesign of business processes to achieve
dramatic improvements in critical contemporary measures of performance such as costs,
quality and speed”. This definition contains four key words:
fundamental
Reevaluate the primary goals of the company, ignoring rules and assumptions formulated in the past.
radical
Do not try to improve the existing situation, invent completely new ways of accomplishing work.
dramatic
Do not use business process redesign to obtain marginal improvements, aim at order-of-magnitude improvements.
process
Focus on the business processes instead of organisational structures. So, in a nutshell, business process redesign (BPR) is an ambitious and rule-breaking approach focussing on business processes instead of organisational boundaries. In this paper we will concentrate on rethinking business processes. We will not discuss the organisational aspects of BPR, the role of information technology nor management and training issues. For discussions on these other important subjects, the reader is referred to Hammer and Champy [13] and Morris and Brandon [21]. By narrowing BPR down like this, three important themes emerge: what, how and by whom?
What?
How?
By whom?
Figure 1: What, how and by whom?
2.1
What?
What are the prime objectives of a company or business unit? An attempt to reengineer a business process should always start with this question.
Consider for example an automobile insurance company having problems with the processing of claims because of the control step to avoid overbilling. Is it really necessary to check every claim? The objective of the insurance company is to reduce costs while keeping the customers happy. Therefore, it is not necessary to approve every claim before the repair to take place. Select a number of garages that are checked periodically. This way costs can be reduced while keeping the customers happy (damage is repaired instantly).
Another example is a truck company having problems with the distribution of spare parts because regional distribution centres are running out of stock frequently. By increasing the inventory levels in the regional distribution centres, we can improve the customers service but the costs of stock keeping will rise. However, do we really need these regional distribution centres? By investing in rapid transport, it may suffice to have only one central distribution centre.
These examples show that we should always ask the basic question: “Why do we do what we do?”.
2.2
How?
When we have determined what a company should do, we have to determine how to do it. Again we should not be hampered by existing rules and assumptions. Processes, not organisations, are the object of BPR. Processes in a company correspond to natural business activities, but they are often fragmented and obscured by organisational structures. If we have found a process to be redesigned, we should give this process a name and determine the input and output of the process. Then we determine the work that has to be done between the start and finish of the process, i.e. all the required steps are identified. We can think of a such step as a task or an activity. Then we determine the ordering of these steps, e.g. taskahas to be executed before taskb, butacan be executed
in parallel with taskc. In Hammer and Champy [13] a number of guidelines are given to
support this activity:
The steps in a process should be performed in a natural order. Avoid fragmentation of related activities.
If possible, several steps are combined into one. If possible, tasks are allowed to be executed in parallel. Avoid complex processes to cope with complex activities. Reduce checks and controls as much as possible.
Make processes generic, i.e. use multiple versions of the same procedure. Check whether modern information technology allows you to omit steps.
The result of applying these guidelines will be a partially ordered set of tasks of steps. We will use the term procedure to refer to this result. Note that a procedure does not determine who is doing the work, i.e. a procedure is just a recipe.
2.3
By whom?
Finally, we have to decide who is going to do the work and in what order. By allocating resources (often employees) to tasks, we are scheduling the business process. We can use advanced scheduling techniques to optimize this allocation. However, in practice simple and robust heuristics are more appropriate. Therefore, we list a number of guidelines to support the construction of these heuristics.
Reduce the number of people involved in the execution of tasks related to one job.
Thus avoiding communication and set-ups.
Tasks are performed where they make the most sense.
There should be a balance between specialisation and generalisation. There should be a balance between centralisation and decentralisation.
Since Adam Smith’s “The Wealth of Nations” ([25]), people have been attempting to break work into its simplest and most basic tasks. Due to this specialisation, the processes have become very complex. As a result the business processes have become hard to manage, thus causing long processing times and a lot of work-in-progress. Replacing a specialist by generalists allows for a simplification of the business processes. Modern information technology allows companies to balance between centralisation and decentralisation. This way business units can be autonomous while still enjoying the benefits of centralised control (e.g. economies of scale).
What?
How?
By whom?
objectives tasks and
procedures
resources and scheduling
Figure 2: What, how and by whom?
This concludes our discussion on business process redesign. We have seen that the rethinking of business processes boils down to answering the “What, how and by whom?” question. In the remainder we will concentrate on a formalism to support this task.
3
High-level Petri nets
As indicated by Hammer and Champy [13], BPR is characterized by four keywords: fundamental, radical, dramatic and process. Therefore we need a framework for modelling processes which forces the user to examine the core of the business process, thus supporting radical and dramatic changes.
In this paper we use a framework based on high-level Petri nets. We will show that this framework can be used to model and analyse business processes.
A high-level Petri net is a Petri net extended with ‘colour’, ‘time’ and ‘hierarchy’. We start with an informal introduction to the classical Petri net, followed by a short description of each of the extensions.
3.1
The classical Petri net model
Historically speaking, Petri nets originate from the early work of Carl Adam Petri ([23]). Since then the use and study of Petri nets has increased considerably. For a review of the history of Petri nets and an extensive bibliography the reader is referred to Murata [22]. The classical Petri net is a directed bipartite graph with two node types called places and
transitions. The nodes are connected via directed arcs. Connections between two nodes
cin busy free cout finish start
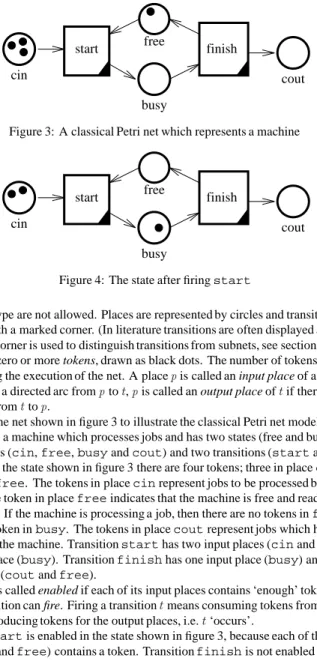
Figure 3: A classical Petri net which represents a machine
cin busy free cout finish start
Figure 4: The state after firingstart
of the same type are not allowed. Places are represented by circles and transitions by rectangles with a marked corner. (In literature transitions are often displayed as bars.) The marked corner is used to distinguish transitions from subnets, see section 3.4. Places may contain zero or more tokens, drawn as black dots. The number of tokens may change during the execution of the net. A placepis called an input place of a transitiont
if there exists a directed arc fromptot,pis called an output place oftif there exists a
directed arc fromttop.
We will use the net shown in figure 3 to illustrate the classical Petri net model. This figure models a machine which processes jobs and has two states (free and busy). There are four places (cin,free,busyandcout) and two transitions (startand
finish). In the state shown in figure 3 there are four tokens; three in placecinand one in placefree. The tokens in placecinrepresent jobs to be processed by the machine. The token in placefreeindicates that the machine is free and ready to process a job. If the machine is processing a job, then there are no tokens infreeand there is one token inbusy. The tokens in placecoutrepresent jobs which have been processed by the machine. Transitionstarthas two input places (cinandfree) and one output place (busy). Transitionfinishhas one input place (busy) and two output places (coutandfree).
A transition is called enabled if each of its input places contains ‘enough’ tokens. An enabled transition can fire. Firing a transitiontmeans consuming tokens from the input
places and producing tokens for the output places, i.e.t‘occurs’.
Transitionstartis enabled in the state shown in figure 3, because each of the input places (cinandfree) contains a token. Transitionfinishis not enabled because there are no tokens in placebusy. Therefore, transitionstartis the only transition that can fire. Firing transitionstartmeans consuming two tokens, one fromcinand
rb
rr bb
red black
Figure 5: A Petri net which represents a ball-game
one fromfree, and producing one token forbusy. The resulting state is shown in figure 4. In this state only transitionfinishis enabled. Hence, transitionfinishfires and the token in placebusyis consumed and two tokens are produced, one forcout
and one forfree. Now transitionstartis enabled, etc. Note that as long as there are jobs waiting to be processed, the two transitions fire alternately, i.e. the machine modelled by this net can only process one job at a time.
Sometimes there are multiple arcs between a place and a transition indicating that multiple tokens need to be consumed/produced. Consider for example the net shown in figure 5. There are two arcs connecting transitionrrand input placered, this means thatrris enabled if and only if there are at least two tokens inred. Ifrrfires, then two tokens are consumed fromredand one token is produced forblack.
The Petri net shown in figure 5 models the following game. The tokens in the places
redandblackrepresent red and black balls in an urn respectively. As long as there are at least two balls in the urn, a person takes two balls from the urn. If the balls are of the same colour, then a black ball is returned, otherwise a red ball is returned. Transitionrb
fires if the person takes two balls having different colours. Transitionrrfires if two red balls are taken, transitionbbfires if two black balls are taken. It can be verified that given an initial state there is precisely one terminal state, i.e. eventually a state is reached where no transitions are enabled.
The classical Petri net model has been used in many application areas, e.g.
communication protocols, flexible manufacturing systems and distributed information systems (see Murata [22]). However, Petri nets describing real systems tend to be complex and extremely large. To solve these problems, many authors propose extensions of the basic Petri net model. We will discuss three of these extensions; ‘colour’, ‘time’ and ‘hierarchy’. Such extensions are a necessity for the successful application of Petri nets to the modelling of large and complex systems.
3.2
Adding colour
Tokens often represent objects (e.g. resources, goods, humans) in the modelled system. Therefore, we often want to represent attributes of these objects. If a truck is modelled by a token in the Petri net, then we may want to represent the capacity, registration number, location, etc. of the truck. Since these attributes are not easily represented by a token in a classical Petri net, we extend the Petri net model with coloured or typed
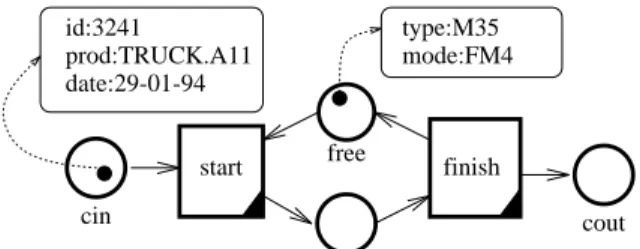
cin busy free cout finish start prod:TRUCK.A11 id:3241 date:29-01-94 type:M35 mode:FM4
Figure 6: Adding colour
tokens. In a coloured Petri net each token has a value often referred to as ‘colour’. Many
coloured Petri net models have been proposed in literature (cf. [2, 15, 17, 18]). One of the main reasons for such an extension is the fact that uncoloured nets tend to become too large to handle.
We will use the machine modelled in figure 3 to clarify this concept. Tokens in the places
cinandcoutrepresent jobs. These jobs may have attributes like an identification number, a description and a due-date. We can model this by giving the tokens incin
andcouta value (colour) which corresponds to these attributes. In figure 6 we see that the job incinrefers to a productTRUCK.A11and has an identification number3241
and a due-date29-01-94. The token in placefreerepresents a machine and its value contains information about this machine (type and mode).
Transitions determine the values of the produced tokens on the basis of the values of the consumed tokens, i.e. a transition describes the relation between the values of the ‘input tokens’ and the values of the ‘output tokens’. It is also possible to specify
‘preconditions’, e.g. transitionstartmay have a precondition which specifies that jobs require a machine of a specific type.
3.3
Adding time
For real systems it is often important to describe the temporal behaviour of the system, i.e. we need to model durations and delays. Since the classical Petri net is not capable of handling quantitative time, we add a timing concept. There are many ways to introduce time into the classical Petri net ([2]). We use a timing mechanism where time is associated with tokens and transition determine delays.
Consider the net shown in figure 7. Each token has a timestamp which models the time the token becomes available for consumption. The token infreehas timestamp 0, the tokens incinhave timestamps ranging from 1 to 9. Since these timestamps indicate when tokens become available, transitionstartbecomes enabled at time 1. (Time 1 is the earliest moment for which each of the input places contains a token which is available.) Therefore, transitionstartfires at time 1, thereby producing a token for
busywith delay 3. The timestamp of this token is equal to 1+3=4. Transitionfinish
will be the next to fire (at time 4), etc. The delay of a produced token can be described by a fixed value, an interval or a probability distribution (cf. [2, 9, 20, 22]).
cin busy free cout finish start 0 1 2 9 "d=3"
Figure 7: Adding time
cin busy free cout finish start
i
o
Figure 8: The definition of themachinesystem
3.4
Adding hierarchy
Although timed coloured Petri nets allow for a succinct description of many business processes, precise specifications for real systems have a tendency to become large and complex. This is the reason we provide a hierarchy construct, called system. A system is an aggregate of places, transitions and (possibly) subsystems.
Figure 8 shows the definition of themachinesystem. This system is composed of two places (freeandbusy) and two transitions (startandfinish) and two connectors (cinandcout). These connectors provide an interface with the environment of the
machinesystem. Thecinconnector is an input connector (i.e. tokens may enter the system via this connector),coutis an output connector (i.e. tokens may leave the system via this connector). If a system is used then the connectors are connected to places at a ‘higher level’. Consider for example the net shown in figure 9. In this net the
arrive leave
machine
machine
machine
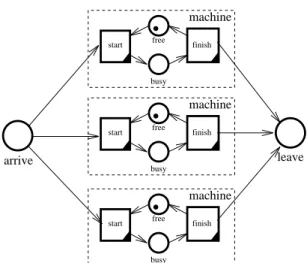
Figure 9: Three parallel machines modelled in terms of themachinesystem
busy free finish start machine busy free finish start machine busy free finish start machine arrive leave
Figure 10: The corresponding ‘flat net’
same definition is ‘installed’ three times. In this case, for each of these ‘installations’ the
cinconnector is connected to the placearriveand thecoutconnector is connected to the placeleave, i.e. the connectors of themachinesystem are ‘glued’ on top of places at a higher level. If we replace each system by it definition we obtain a ‘flat net’, i.e. a net without hierarchy. In fact, the semantics of a net with hierarchy are given by the corresponding flat net. Figure 10 shows the flat net which corresponds to the net shown in figure 9.
Both transitions and systems are able to consume and produce tokens. In a sense, transitions are atomic systems, i.e. systems without an internal state. In other words, a transition is a memoryless system. Therefore, we use similar symbols for transitions and systems. Both transitions and systems are modelled by rectangles and transitions have a marked corner to indicate the fact that they are atomic.
The system concept allows for hierarchical modelling, i.e. it is possible to decompose complex systems into smaller subsystems. (Note that it is possible to have an arbitrary number of levels.) For practical applications of Petri nets, the system concept is of the utmost importance. The system concept can be used to structure large specifications. At one level we want to give a simple description of the system (without having to consider all the details). At another level we want to specify a more detailed behaviour.
For a more elaborate discussion on hierarchy constructs, the reader is referred to Jensen [17], van der Aalst [2, 7] and van Hee [15].
3.5
Language and tools
In the remainder of this paper we will refer to Petri nets extended with ‘colour’, ‘time’ and ‘hierarchy’ as high-level Petri nets.
Only a few high-level Petri net models (i.e. hierarchical timed coloured Petri net models) have been proposed in literature. Even fewer high-level Petri net models are supported by software tools. Nevertheless, there are at least two software products, ExSpect ([2, 7, 16]) and Design/CPN ([17]), that are being distributed on a commercial basis. Both software products provide a graphical interface to create, modify and simulate high-level Petri nets. Moreover, they provide analysis tools and reporting facilities. To specify the behaviour of each transition (i.e. the number of tokens produced and the value and delay of each produced token), Design/CPN provides an ‘inscription language’ (expressions on the input and output arcs of a transition). ExSpect (Executable
Specification Tool) uses a ‘Z-like’ specification language (Spivey [26]) to describe the behaviour of a transition. Both languages originate from ‘pure’ functional languages. The approach described in this paper is based on the software package ExSpect. ExSpect has been developed by the information systems department of Eindhoven University of Technology. Since 1992, ExSpect is being distributed by Bakkenist 1.
3.6
Analysis of Petri nets
The complexity of the design and control problems encountered in modern business processes is increasing. Therefore, we need methods and techniques to support both the modelling and analysis of these systems. High-level Petri nets often allow for a representation which is close to the problem situation, i.e. it is possible to model the system in a natural manner. This representation can be used as a starting point for various kinds of analysis. In a sense, the Petri net representation serves as an interface between the problem situation and the method(s) of analysis. In fact, high-level Petri nets provide a ‘solver-independent’ medium that can be used to make a concise ‘blue-print’ of the business process we want to analyse. This blue-print may be used at different levels of decision making and can be used as a starting point for various means of analysis. Compared to the usual algorithmic approaches (where the emphasis is on the analysis process rather than the modelling process), our approach is characterized by the fact that during the modelling process the user is not shackled by the techniques which are going to be used to analyse the model.
For an overview of the many analysis methods developed for Petri nets the reader is referred to Jensen [18], Murata [22], Silva and Vallette [24] and [2, 3]. These methods can be used to prove properties (safety properties, invariance properties, deadlock, etc.) and to calculate performance measures (response times, waiting times, occupation rates, etc.). In this way it is possible to evaluate alternative designs.
4
Mapping business processes onto high-level Petri nets
High-level Petri nets are suitable for the modelling and analysis of business processes. By using a Petri net based framework, we are able to abstract from organisational aspects. To illustrate the application of Petri-net to BPR, we will show how these nets can be used to answer the “What, how and by whom?” question formulated in section 2.
1Bakkenist Management Consultants, Wisselwerking 46, 1112 XR, Diemen, The Netherlands.
4.1
What?
After selecting a business process to be redesigned, we determine the boundaries of this process. The input and output which pass this boundary signify the meaning of this process for the company. By focussing on the input and output of a business process, we should be able to destill the prime objectives of this process.
Business processes are mapped onto systems. The business process to be reengineered is modelled by an open system, i.e. a net exchanging tokens with some environment. Figure 11 shows a business process modelled by a system with one input place and one output place. We can determine what a business process should do by observing the
output business
process input
Figure 11: A business process is modelled by a system
relevant interactions with the environment, i.e. input and output are investigated to determine the prime objectives. Modelling a business process by a system forces us to reconsider the prime objectives of a business process.
To illustrate the mapping of business processes onto high-level Petri nets, we use a business process in an automobile insurance company having problems with the processing of claims. The processcheck claimhandles claims related to car damage. If a claimant reports car damage, this process checks whether the claim is justified. The input of this business process is the inflow of claims of people having car damage, the output is the outflow of claims that have been screened. The processcheck claimis modelled by a system with the same name. Figure 12 shows that this system has one input place (claim) and two output places (accepted claimand
rejected claim). The tokens in these places represent claims. Placeclaim
contains claims that have to be checked. Claims in placeaccepted claimhave been checked and turned out to be justified. Claims in placerejected claimhave not been accepted for some reason.
4.2
How?
If we have determined the input and output of a business process, we focus on the work that has to be done between the start and finish of the process. First, we identify the steps that are required to do the work. Then we consider the ordering of these steps. We will
accepted_claim rejected_claim claim
claim check_
Figure 12: The processcheck claim
use the term task instead of the term step. A task is atomic which means that it is considered as an indivisible amount of work. Examples of tasks are: typing a letter, making a telephone call, signing a document and making an invoice. A business process is composed of a number of tasks, these tasks have to be executed in a particular order. Tasks are mapped onto transitions. Each task corresponds to a transition in the system which represents the business process to be reengineered. These transitions are linked together by places and other transitions, thus defining a partial ordering of tasks. This way, we define how the business process should work. At this moment we do not bother about who is going to process these tasks, we only determine the tasks required and the ordering of these tasks.
The processcheck claimrequires three tasks:check insurance,
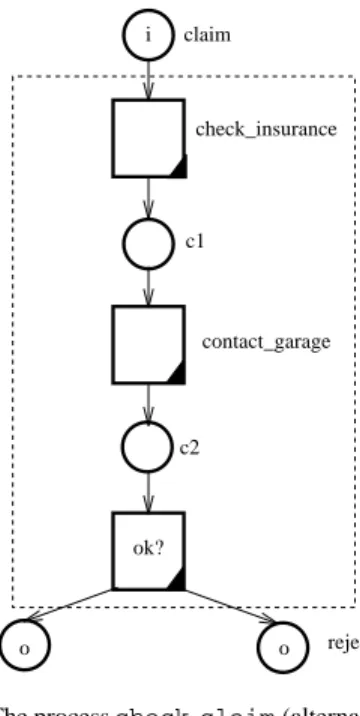
contact garageandok?. The taskcheck insuranceis executed to check whether the claimant is insured for the damage reported. The taskcontact garageis performed to inquire about the damage. If these two tasks have been performed, a decision has to be made (taskok?); the claim is accepted or not. If transitionok?fires, it produces one token. This token is placed in output placeaccepted claimor in output placerejected claim, depending on the results of the two checks. Figure 13 shows a possible business process composed of these three tasks. The tasks are executed sequentially; firstcheck insurance, thencontact garageand finallyok?. The tasks are represented by transitions and are linked together by the placesc1andc2. Tokens in these two places correspond to claims being processed. The value of such a token contains information about the claim, e.g. claim number, name and address of claimant, license number, etc.
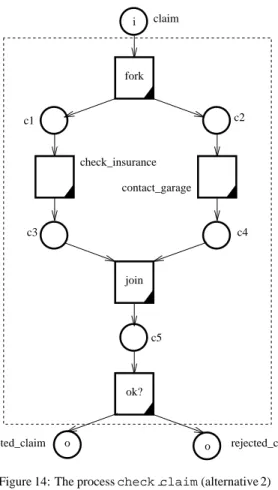
It is not a requirement that the three tasks are executed sequentially. The tasks
check insuranceandcontact garagemay be executed in parallel. Figure 14 shows an alternative business process where these two tasks are executed in parallel. The transitionsforkandjoindo not represent tasks; they have been added to allow the taskscheck insuranceandcontact garageto be executed in parallel.
rejected_claim accepted_claim ok? contact_garage claim check_insurance c2 c1 i o o
Figure 13: The processcheck claim(alternative 1)
Transitions such asforkandjoinrepresent control activities. Control activities are used for the routing of work, synchronisation, etc.
The places in a system which represents a business process are used to model the flow of work. Tokens in these places represent documents, signals, goods, forms, etc. The value of such a token contains information about the object represented by the token. Most tokens have some unique identity, e.g. a document number or a case number. Procedures are represented by systems. Systems may be composed of subsystems (see section 3.4). Therefore, it is possible to nest procedures, i.e. a complex procedure may be composed of less complex procedures.
The result of the ‘how’-phase is a partially ordered set of tasks, represented in terms of a Petri net. In this phase we do not bother about who is going to execute these tasks. Therefore, we will use the term procedure instead of process. The figures 13 and 14 show two alternative procedures for the processcheck claim.
Petri nets allow for many analysis techniques, see section 3.6. We can use these techniques to analyse business procedures modelled in terms of a Petri net. We can use Petri net theory to verify the correctness of a procedure, e.g. absence of deadlock, invariance properties, termination, etc. In fact, we can prove that, for an external observer, the two procedures shown in figure 13 and in figure 14 behave (logically) the same!
claim rejected_claim accepted_claim check_insurance contact_garage c1 c2 c3 c4 c5 join ok? fork i o o
Figure 14: The processcheck claim(alternative 2)
4.3
By whom?
A procedure does not determine who is doing the work, e.g. figure 14 does not specify which employee will check the insurance of the claimant. In the ‘by whom’-phase we decide who is going to do the work and in what order. By allocating resources to tasks, we are scheduling the business process. We use the term resource to denote some entity capable of processing certain tasks, e.g. a person or a machine.
Resources are able to perform a limited set of tasks. A resource class is a set of similar resources. Each task requires resources from a given resource class. A group of telephone operators, a group of office employees and a group of claim appraisers are examples of resource classes.
In the ‘by whom’-phase we have specify the link between tasks and resources, i.e. we have to describe a resource manager which assigns resources to tasks. The resource manager controls the allocation of resources. A resource manager can be a person, a computer system or a combination of the two.
In figure 14 we have abstracted from the fact that there are resources. When we define a procedure, we assume that the tasks are executed instantly. In reality this is not the case, some time passes between the moment a task emerges and the moment it is executed. Therefore, we have to model tasks by systems instead of transitions. In figure 14, we have to replace the transitionscheck insurance,contact garageandok?by three systems. Each of these systems is composed of two transitions and one place, see figure 15. Transitionexecutefires when the task is activated by a token in the place
et execute execute_task task_completed complete i o o i cin cout
Figure 15: A task is a system composed to two transitions
connected to output connectorcin. Transitioncompletefires when the task has been completed and produces a token for the place connected to output connectorcout. The output connectorexecute taskand the input connectortask completedare connected to a resource manager. If transitionexecutefires, a token is sent to the resource manager via output connectorexecute task. The value of this token contains information about the task2to be executed (e.g. identification, workload and
resource class). When this task has been executed, the resource manager sends a token to the task via input connectortask completed. The tokens in placeetrepresent tasks that have not been completed yet. Transitioncompletehas a precondition which makes sure that the proper task is removed from placeetwhen a token arrives via input connectortask completed.
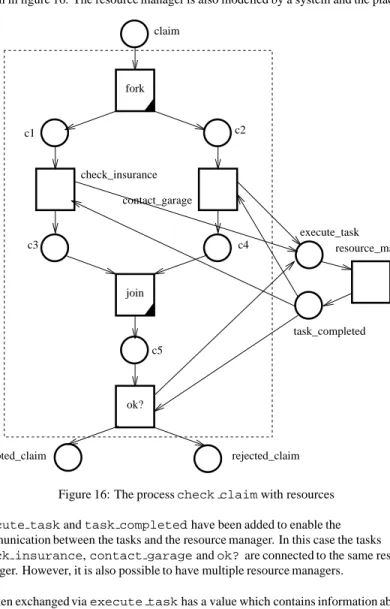
If we replace each transition which represents a task by a system, we obtain the Petri-net shown in figure 16. The resource manager is also modelled by a system and the places
claim rejected_claim accepted_claim check_insurance contact_garage c1 c2 c3 c4 c5 join ok? fork task_completed execute_task resource_manager
Figure 16: The processcheck claimwith resources
execute taskandtask completedhave been added to enable the communication between the tasks and the resource manager. In this case the tasks
check insurance,contact garageandok?are connected to the same resource manager. However, it is also possible to have multiple resource managers.
A token exchanged viaexecute taskhas a value which contains information about the task to be executed. The value of such a token is typically composed of:
(i) a job identification, tasks are executed on behalf of a specific case (e.g. a claim, an article, an order),
(ii) a task identification, the name or the code of a task,
(iii) a resource class, a task requires a resource from a specific resource class, (iv) and some additional information about the task to be executed (e.g. priorities, due
dates).
The resource manager uses this information to schedule the tasks to be executed. A resource manager is a scheduler which allocates resources to tasks, i.e. it decides who is going to do the work and in what order. We can use advanced scheduling techniques to optimize this allocation. However, in practice simple and robust heuristics are more appropriate. Figure 17 shows a system which models a very simple resource manager. In
begin end free busy o i execute_task task_completed
Figure 17: A very simple resource manager
this case, each resource is modelled by a token infreeorbusy. A token in place
freecorresponds to a resource which is ready to execute a task. A token inbusy
corresponds to a resource which is busy executing a task. The tokens in the input place
execute taskrepresent tasks waiting to be executed. Transitionbeginfires when a resource starts processing a task. Transitionbeginhas a precondition which makes sure that a resource from the proper resource class is allocated to the task to be executed. The tasks are executed in first-in-first-out (FIFO) order. If transitionbeginfires, then it produces a token for place busy with a delay. This delay corresponds to the time required to execute the task. Transitionendfires when a task has been executed.
We can also model a resource manager which uses advanced scheduling techniques. In this case, the resource manager uses more information about the task to be scheduled. By assigning a priority to each task, we can favour an important task above less important tasks. We can use most of the priority rules for rule based scheduling (cf. Haupt [14]). Typical priority rules are: SPT (shortest processing time), MWKR (most work remaining), LWKR (least work remaining), DD (earliest due-date), etc.
Figure 16 looks rather complicated because of the connections between the tasks and the resource manager. However, we can automate the construction of this part of the figure. We only have to describe the procedure (see figure 14) and the scheduling rules used by the resource manager to specify the business process completely.
4.4
Example
By modelling a procedure and a resource manager we are able to analyse the resulting business process. Petri net based analysis techniques can be used to evaluate the
performance of the modelled business process. We can use these techniques to calculate
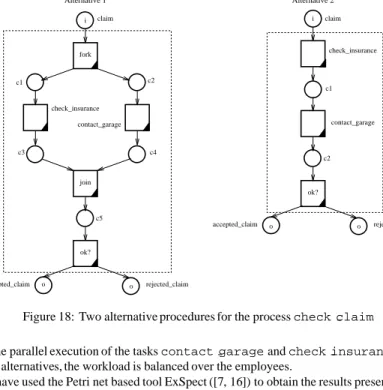
the estimated throughput of a process, the average throughput time of a job, the estimated occupation rate, etc. For example, we are able to compare the performance of the two procedures shown in figure 13 and 14 (given a workload and a scheduling discipline). Assume that the arrival of claims that have to be checked by the processcheckclaim can be described by a Poisson arrival process (i.e. the time between two arrivals is negative exponentially distributed). The average time between two arrivals is 10 minutes. Moreover, there are three office employees; Cindy, John and Laura. Cindy is qualified to contact the garage (taskcontact garage), John can do two types of tasks;check insuranceandok?. Laura is the only one qualified to do all three types of tasks. We assume that the time required to execute a task is independent of the person executing the task. Taskcontact garagetakes between 5 and 7 minutes (uniformly distributed). The other two tasks take between 2 and 4 minutes (uniformly distributed). We use simulation to compare the two procedures described in section 4.2, see figure 18. During the simulation of these two alternatives, we measured the average throughputtime of claims and the occupation rate of each office employee. Table 1 reports the average throughputtime of claims and the occupation rate for the two alternatives. This table
subrun average throughputtime occupationrate
alternative 1 alternative 2 alternative 1 alternative 2
Cindy John Laura Cindy John Laura
1 13.34 10.76 41.6 35.6 40.4 37.3 41.1 41.0 2 13.19 11.33 41.3 35.2 40.2 37.2 40.7 40.8 3 13.42 10.97 41.5 35.7 40.3 37.2 40.9 40.9 4 12.96 10.48 41.6 35.2 39.8 36.9 41.0 41.2 5 13.44 10.52 40.8 35.3 39.9 37.1 41.3 41.2 6 13.31 10.61 41.1 35.6 40.1 36.9 41.4 41.1 7 13.27 10.50 41.2 35.7 40.2 37.3 41.0 41.3 8 13.25 10.75 41.3 35.3 40.4 37.0 41.2 41.4 9 13.27 10.98 41.7 35.2 40.6 37.6 41.1 41.0 10 13.50 10.97 41.6 35.8 40.5 37.3 41.2 40.9
Table 1: Some simulation results
shows that alternative 2 is preferable. The average throughputtime of claims is reduced
claim rejected_claim accepted_claim check_insurance contact_garage c1 c2 c3 c4 c5 join ok? fork i o o rejected_claim accepted_claim ok? contact_garage claim check_insurance c2 c1 i o o Alternative 1 Alternative 2
Figure 18: Two alternative procedures for the processcheck claim
by the parallel execution of the taskscontact garageandcheck insurance. In both alternatives, the workload is balanced over the employees.
We have used the Petri net based tool ExSpect ([7, 16]) to obtain the results presented in table 1. By using this tool we can model both alternatives in half an hour. Simulating one alternative for 70 days takes about 5 minutes on a SUN/SPARC workstation.
4.5
Summary of the “What, how and by whom” approach
In this section we showed that it is possible to model business processes in terms of high-level Petri nets. We identified three phases; (1) the ‘What?’ phase, (2) the ‘How?’ phase and (3) the ‘By whom?’ phase.In the ‘What?’ phase we identify the process to be reengineered. This process is mapped onto a system.
In the ‘How?’ phase we identify the required tasks and the ordering of these tasks, i.e. we define a procedure. Such a procedure is mapped onto a system composed of transitions and places. The tasks in this procedure are mapped onto transitions. Control activities for synchronisation and the routing of work are also modelled by transitions. The flow of work is modelled by places.
The ‘By whom?’ phase is the final phase. In this phase we allocate resources to tasks. In this phase we model tasks by systems instead of transitions. Moreover, we add a system for each resource manager.
5
Conclusion
Several other techniques have been proposed to support business process reengineering efforts. Diagramming techniques such as flowcharts, decision trees, Warnier-Orr diagrams, state transition diagrams, fishbone diagrams, hierarchy charts, dataflow diagrams and business activity maps (cf. Morris and Brandon [21]) have been used to represent business processes. Most of these techniques suffer from two important drawbacks: (1) the lack of formal semantics and (2) the absence of powerful analysis methods and tools.
High-level Petri nets have a formal semantics. A Petri net model of a business process is a precise and unambiguous description of the behaviour of the modelled process. The precise nature and the firm mathematical foundation of Petri nets have resulted in an abundance of analysis methods and tools.
Despite of the formal background, Petri nets are easy to understand. The graphical nature can be used to visualise business processes in a natural manner and supports the communication between people involved in a BPR project.
The ‘’What, how and by whom?” approach presented in this paper can be used to model business processes in a step by step manner. Improving an existing business process requires a thorough understanding of this process. This can be achieved by modelling the “as is” process. The model of the “as is” process can be used as a stepping stone for models of “to be” alternatives. Analysis techniques, such as simulation, can be used to compare the “as is” model with the “to be” models.
The buzzwords business process reengineering and workflow management are often bracketed together. Workflow management is concerned with the control of business processes. Workflow management software allows for new business processes, i.e. recent developments in information technology enable companies to reengineer business processes. The approach presented in this paper can also be used to reengineer workflow processes and to (re)configure workflow management systems (cf. Van der Aalst, van Hee and Houben [6] and Ellis and Nutt [11]). Practical experiences show that the ‘’What, how and by whom?” approach is especially useful for the modelling and analysis of office logistics.
References
[1] W.M.P. van der Aalst. Modelling and Analysis of Complex Logistic Systems. In H.J. Pels and J.C. Wortmann, editors, Integration in Production Management
Systems, volume B-7 of IFIP Transactions, pages 277–292. Elsevier Science
Publishers, Amsterdam, 1992.
[2] W.M.P. van der Aalst. Timed coloured Petri nets and their application to logistics. PhD thesis, Eindhoven University of Technology, Eindhoven, 1992.
[3] W.M.P. van der Aalst. Interval Timed Coloured Petri Nets and their Analysis. In M. Ajmone Marsan, editor, Application and Theory of Petri Nets 1993, volume 691 of Lecture Notes in Computer Science, pages 453–472. Springer-Verlag, New York, 1993.
[4] W.M.P. van der Aalst. Modelling and analysis of production systems using a Petri net based approach. In T.O. Boucher, M.A. Jafari, and E.A. Elsayed, editors,
Proceedings of the conference on Computer Integrated Manufacturing in the Process Industries, pages 179–193, East Brunswick, USA, 1994.
[5] W.M.P. van der Aalst. Putting Petri nets to work in industry. Computers in
Industry, 25(1):45–54, 1994.
[6] W.M.P. van der Aalst, K.M. van Hee, and G.J. Houben. Modelling workflow management systems with high-level Petri nets. In Proceedings of the second
Workshop on Computer-Supported Cooperative Work, Petri nets and related formalisms, 1994.
[7] W.M.P. van der Aalst and A.W. Waltmans. Modelling logistic systems with EXSPECT. In H.G. Sol and K.M. van Hee, editors, Dynamic Modelling of
Information Systems, pages 269–288. Elsevier Science Publishers, Amsterdam,
1991.
[8] R. Ardhaldjian and M. Fahner. Using simulation in the business process reengineering effort. Industrial engineering, pages 60–61, July 1994.
[9] B. Berthomieu and M. Diaz. Modelling and verification of time dependent systems using Time Petri Nets. IEEE Transactions on Software Engineering,
17(3):259–273, March 1991.
[10] T.H. Davenport. Process innovation : reengineering work through information
technology. Harvard Business School Press, Boston, 1993.
[11] C.A. Ellis and G.J. Nutt. Modelling and Enactment of Workflow Systems. In M. Ajmone Marsan, editor, Application and Theory of Petri Nets 1993, volume 691 of Lecture Notes in Computer Science, pages 1–16. Springer-Verlag, New York, 1993.
[12] M. Hammer. Reengineering work: Don’t automate, Obliterate. Harvard Business
review, pages 104–112, July/August 1990.
[13] M. Hammer and J. Champy. Reengineering the corporation. Nicolas Brealey Publishing, London, 1993.
[14] R. Haupt. A survey of priority rule-based scheduling. OR Spectrum, 11:3–16, 1989. [15] K.M. van Hee. Information System Engineering: a Formal Approach. Cambridge
[16] K.M. van Hee, L.J. Somers, and M. Voorhoeve. Executable specifications for distributed information systems. In E.D. Falkenberg and P. Lindgreen, editors,
Proceedings of the IFIP TC 8 / WG 8.1 Working Conference on Information System Concepts: An In-depth Analysis, pages 139–156, Namur, Belgium, 1989. Elsevier
Science Publishers, Amsterdam.
[17] K. Jensen. Coloured Petri Nets: A High Level Language for System Design and Analysis. In G. Rozenberg, editor, Advances in Petri Nets 1990, volume 483 of
Lecture Notes in Computer Science, pages 342–416. Springer-Verlag, New York,
1990.
[18] K. Jensen. Coloured Petri Nets. Basic concepts, analysis methods and practical
use. EATCS monographs on Theoretical Computer Science. Springer-Verlag, New
York, 1992.
[19] K. Jensen and G. Rozenberg, editors. High-level Petri Nets: Theory and
Application. Springer-Verlag, New York, 1991.
[20] M. Ajmone Marsan, G. Balbo, and G. Conte. A Class of Generalised Stochastic Petri Nets for the Performance Evaluation of Multiprocessor Systems. ACM
Transactions on Computer Systems, 2(2):93–122, May 1984.
[21] D. Morris and J. Brandon. Reengineering your business. McGraw-Hill, New York, 1993.
[22] T. Murata. Petri Nets: Properties, Analysis and Applications. Proceedings of the
IEEE, 77(4):541–580, April 1989.
[23] C.A. Petri. Kommunikation mit Automaten. PhD thesis, Institut f¨ur instrumentelle Mathematik, Bonn, 1962.
[24] M. Silva and R. Valette. Petri Nets and Flexible Manufacturing. In G. Rozenberg, editor, Advances in Petri Nets 1989, volume 424 of Lecture Notes in Computer
Science, pages 274–417. Springer-Verlag, New York, 1990.
[25] A. Smith. The Wealth of Nations. 1776.
[26] J.M. Spivey. The Z Notation: A Reference Manual. Prentice-Hall, Englewood Cliffs, 1989.