environment on the size and structure of galaxies. PhD
thesis, University of Nottingham.
Access from the University of Nottingham repository:
http://eprints.nottingham.ac.uk/13059/1/DTMaltby.PhD.pdf
Copyright and reuse:
The Nottingham ePrints service makes this work by researchers of the University of Nottingham available open access under the following conditions.
· Copyright and all moral rights to the version of the paper presented here belong to
the individual author(s) and/or other copyright owners.
· To the extent reasonable and practicable the material made available in Nottingham
ePrints has been checked for eligibility before being made available.
· Copies of full items can be used for personal research or study, educational, or
not-for-profit purposes without prior permission or charge provided that the authors, title and full bibliographic details are credited, a hyperlink and/or URL is given for the original metadata page and the content is not changed in any way.
· Quotations or similar reproductions must be sufficiently acknowledged.
Please see our full end user licence at:
http://eprints.nottingham.ac.uk/end_user_agreement.pdf A note on versions:
The version presented here may differ from the published version or from the version of record. If you wish to cite this item you are advised to consult the publisher’s version. Please see the repository url above for details on accessing the published version and note that access may require a subscription.
The effect of the galaxy
environment on the size
and structure of galaxies
David T. Maltby
, M.SciThesis submitted to the University of Nottingham
for the degree of Doctor of Philosophy
the adventure Science.”
– Edwin Hubble (1889–1953)
Supervisors: Prof. Alfonso Arag´on-Salamanca Dr. Meghan E. Gray
Examiners: Dr. Michele Cappellari (University of Oxford)
Dr. Steven P. Bamford (University of Nottingham)
Submitted: 6 July 2012
Examined: 18 September 2012
Abstract ix
Acknowledgements xi
Published work xii
1 Introduction 1
1.1 The galaxy environment . . . 4
1.1.1 Hierarchical assembly . . . 4
1.1.2 The morphology–density relation . . . 5
1.1.3 Other correlations with environment . . . 6
1.1.4 Galaxy evolution: ‘nature’ versus ‘nurture’ . . . 9
1.1.5 Outstanding questions . . . 10
1.2 Environmental processes . . . 11
1.2.1 Galaxy-galaxy interactions . . . 11
1.2.2 Galaxy-cluster gravitational interactions . . . 12
1.2.3 Galaxy-ICM interactions . . . 12
1.2.4 Potential environmental effects . . . 13
1.3 The size and structure of galaxies and the galaxy environment . . . 14
1.3.1 The size of the stellar distribution . . . 14
1.3.2 The structure of the stellar distribution . . . 15
1.4 Thesis overview . . . 18
2 The STAGES survey 20 2.1 Overview . . . 20
2.2 Defining the galaxy environment . . . 22
2.2.1 Selection of a cluster sample . . . 22
2.2.2 Selection of a field comparison sample . . . 25
2.2.3 Visual morphologies: the STAGES morphological catalogue . 26 2.2.4 Sample completeness . . . 27
3 Mass–size relations and the environment 30 3.1 Introduction . . . 30
3.2 Data and sample selection . . . 32
3.2.1 Measuring stellar mass . . . 32
3.2.2 Measuring galaxy size . . . 33
3.2.3 Reliability of structural parameters . . . 35
3.3 The stellar-mass–size relation in STAGES . . . 36
3.3.1 The stellar-mass–size relation by Hubble-type morphology . . 40
3.4 Discussion . . . 44 iii
3.4.2 The effect of a photometric redshift bias . . . 48
3.4.3 The effect of contaminations . . . 49
3.4.4 Visual inspection . . . 51
3.5 Conclusions . . . 52
4 Disc structure and environment: spirals 54 4.1 Introduction . . . 54
4.2 Data and sample selection . . . 57
4.3 Profile fitting . . . 59
4.3.1 Photometric calibration . . . 62
4.3.2 Sky subtraction . . . 63
4.4 Profile classification . . . 64
4.4.1 Profile inspection . . . 64
4.4.2 Defining the outer stellar disc . . . 65
4.4.3 Profile types . . . 65
4.4.4 Measuring scalelength and break strength . . . 68
4.5 Results . . . 72
4.5.1 Morphology . . . 74
4.5.2 Pure exponential outer discs (Type Io) . . . 76
4.5.3 Broken exponential outer discs (Type IIo/IIIo) . . . 78
4.5.4 Inner/initial disc breaks . . . 81
4.6 Conclusions . . . 82
5 Disc structure and environment: S0s 84 5.1 Introduction . . . 84
5.2 Data and sample selection . . . 85
5.3 Profile fitting . . . 88
5.3.1 Sky subtraction . . . 88
5.4 Profile classification . . . 90
5.4.1 Profile inspection . . . 90
5.4.2 Profile types . . . 91
5.4.3 Measuring scalelength and break strength . . . 91
5.5 Results . . . 94
5.5.1 S0: pure exponential discs (Type I) . . . 96
5.5.2 S0: broken exponential discs (Type II/III) . . . 98
5.6 Comparing disc structure in spiral and S0 galaxies . . . 102
5.6.1 Spiral/S0: galaxy samples . . . 102
5.6.2 Profile type (I, II and III) . . . 102
5.6.3 Spiral/S0: pure exponential discs (Type I) . . . 103
5.6.4 Spiral/S0: broken exponential discs (Type II/III) . . . 103
5.6.5 Spiral/S0: bulge structure . . . 110
5.7 Conclusions . . . 111
6 Antitruncations: bulge or disc related? 113 6.1 Introduction . . . 113
6.2 Antitruncations in spiral galaxies . . . 114
6.2.1 Data and sample selection . . . 114
6.2.2 Methodology . . . 114
6.2.3 Results . . . 116 iv
6.4 Conclusions . . . 122
6.4.1 Implications for the formation of S0 galaxies . . . 124
6.4.2 Implications for the formation of Type III profiles . . . 124
7 Conclusions and future work 126 7.1 The stellar distribution and the galaxy environment . . . 126
7.1.1 The size of the stellar distribution . . . 126
7.1.2 The structure of the stellar distribution . . . 127
7.1.3 Conclusion: implications for galaxy evolution . . . 128
7.2 Structural analyses: implications for S0 formation . . . 128
7.2.1 The structure of the stellar distribution . . . 128
7.2.2 The nature of stellar disc antitruncations . . . 129
7.3 Future work . . . 130
Bibliography 131
1.1 The Hubble sequence . . . 1
1.2 The colour bimodality of the local galaxy population . . . 3
1.3 The hierarchical assembly of large-scale structure . . . 5
1.4 The morphology–density relation . . . 6
1.5 Galaxy colour as a function of environment . . . 7
1.6 Galaxy star formation as a function of environment . . . 8
1.7 Environmental correlations and galaxy mass . . . 9
1.8 The stellar-mass–size (M∗–re) relation . . . 15
1.9 The structure of a typical disc galaxy . . . 16
1.10 The structure of stellar discs: profile types . . . 19
2.1 The STAGES A901/2 field . . . 21
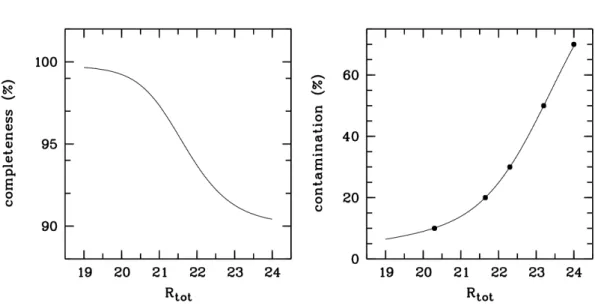
2.2 The selection of a field and cluster sample: photometric redshift z versus R-magnitude for the field and cluster samples . . . 23
2.3 The completeness and contamination of the cluster selection . . . 24
2.4 The STAGES A901/2 cluster cores . . . 25
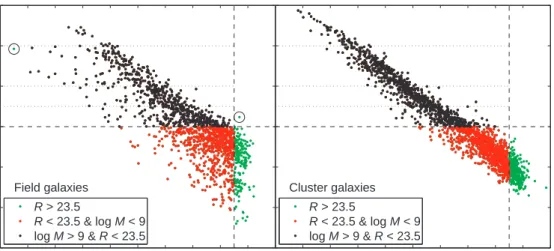
2.5 Mass–magnitude (M∗–R) relations for the field and cluster samples . 27 3.1 The stellar-mass–size relation (M∗–ae) in different environments . . 37
3.2 A comparison of the galaxy size ae distributions in different environ-ments . . . 39
3.3 The morphological mix of our galaxy samples in different stellar-mass ranges and environments . . . 40
3.4 The stellar-mass–size relation (M∗–ae) in different environments for elliptical, lenticular and spiral galaxies . . . 41
3.5 Elliptical galaxies: a comparison of the galaxy sizeaedistributions in different environments . . . 43
3.6 Lenticular galaxies: a comparison of the galaxy size ae distributions in different environments . . . 44
3.7 Spiral galaxies: a comparison of the galaxy size ae distributions in different environments . . . 45
3.8 The error in galaxy size ae versus R-magnitude and stellar mass for our field sample . . . 46
3.9 The effect of high photo-z errors on our stellar-mass–size relations . 47 3.10 The effect of field contaminations on the mean galaxy sizeae in the cluster . . . 50
3.11 A visual inspection of low-mass (M∗ <109.5M⊙) spirals from different environments . . . 51
4.1 Spiral galaxies: the distribution of axial ratio q . . . 57 vi
field and cluster samples . . . 58 4.3 The morphological mix (Sa–Sd) of our spiral galaxy sample . . . 58 4.4 Profile fitting: an example showing the procedure used for measuring
our surface brightness µ(r) profiles . . . 61 4.5 Spiral galaxies: the distributions of break surface brightness µbrk . . 66
4.6 Disc profile classification: outer disc profile types for spiral galaxies . 67 4.7 Broken exponential discs: a plot of break strength T versus outer
scalelength hout for our spiral galaxies . . . 69
4.8 Field spirals: example surface brightnessµ(r) profiles . . . 70 4.9 Cluster spirals: example surface brightnessµ(r) profiles . . . 71 4.10 The morphological mix (Sa–Sd) for different outer disc profile types 74 4.11 The distribution of outer disc profile types for different Hubble-type
morphologies (Sa–Sd) . . . 75 4.12 A comparison of the disc scalelength h distributions in field/cluster
spiral galaxies . . . 77 4.13 A comparison of the break strength T distributions in field/cluster
spiral galaxies . . . 79 4.14 Broken exponential discs: a plot of break strength T versus galaxy
size refor our spiral galaxies . . . 80
5.1 S0 galaxies: photometric redshiftz versusR-magnitude for the field and cluster samples . . . 86 5.2 S0 galaxies: the distribution of axial ratioq . . . 87 5.3 An evaluation of the sky subtraction for our S0 galaxies . . . 90 5.4 S0 galaxies: the distributions of break surface brightness µbrk . . . . 92
5.5 Disc profile classification: disc profile types for our S0 galaxies . . . 93 5.6 A comparison of the disc scalelength h distributions in field/cluster
S0 galaxies . . . 97 5.7 A comparison of the break surface brightness µbrk distributions in
field/cluster S0 galaxies . . . 99 5.8 Comparing the break strength T distributions in field/cluster S0s . . 100 5.9 A comparison of the disc scalelength h distributions in spirals/S0s . 104 5.10 A comparison of the break surface brightness µbrk distributions in
spirals/S0s for the field and cluster environment . . . 106 5.11 A comparison of the break strengthT distributions in spirals/S0s . . 108 5.12 Stellar disc antitruncations: a comparison of the break strength T
distributions in spirals/S0s . . . 109 6.1 Bulge–disc (B–D) decompositions: B–D profile types . . . 116 6.2 The distribution of B–D profile types in spiral and S0 galaxies . . . . 117 6.3 Example B–D decompositions and surface brightness µ(r) profiles . . 118 6.4 Spiral galaxies: a rare example of bulge light causing an
antitrunca-tion in a spiral galaxy surface brightnessµ(r) profile . . . 119 6.5 Spiral and S0 galaxies: comparing the orientations of the bulge
com-ponent and the outer regions of the galaxy . . . 121 6.6 S0 galaxies: an example of bulge light causing an antitruncation in
an S0 surface brightness µ(r) profile . . . 122 6.7 A comparison of the morphological distribution for genuine stellar
disc breaks and antitruncated surface brightness µ(r) profiles . . . . 125 vii
2.1 Visual morphologies for the field and cluster samples . . . 26
2.2 Properties of the field and cluster samples . . . 28
2.3 Properties of the field and cluster samples by stellar massM∗ . . . . 29
3.1 Errors in galaxy sizeaefor the various field and cluster galaxy samples used in this work . . . 34
3.2 Visual morphologies for the final field and cluster samples . . . 36
3.3 A comparison of the mean galaxy size ae in different environments: the field, cluster and cluster core . . . 38
3.4 A comparison of the mean galaxy size ae in different environments for various Hubble-type morphologies: elliptical, lenticular and spiral galaxies . . . 42
4.1 Spiral galaxies: properties of the field and cluster samples . . . 59
4.2 A determination of the error in the sky subtraction . . . 64
4.3 The frequency of outer disc profile types in spiral galaxies . . . 73
4.4 A comparison of disc structure (scalelength h, break strength T) in field/cluster spiral galaxies . . . 81
5.1 S0 galaxies: properties of the field and cluster samples . . . 87
5.2 S0 galaxies: errors in scalelength h and break strength T . . . 91
5.3 The frequency of disc profile types in S0 galaxies . . . 95
5.4 A comparison of disc structure (scalelength h, break surface bright-ness µbrk, break strength T) in field/cluster S0 galaxies . . . 101
5.5 A comparison of disc structure (scalelength h, break strength T) in spiral/S0 galaxies . . . 110
In this thesis, we explore the effect of the galaxy environment on the physical size and structure of the stellar distribution for relatively local galaxies (z <0.3) using
Hubble Space Telescope/Advanced Camera for Surveys imaging and data from the
Space Telescope A901/2 galaxy evolution survey (STAGES).
We determine the effect of the environment on the size of the stellar distribution (i.e. galaxy sizes) by comparing the stellar-mass–size relations in the field and cluster environments for different Hubble-type morphologies. For elliptical, lenticular, and high-mass (M∗ > 1010M⊙) spirals, we find no evidence to suggest that a galaxy’s size (i.e. effective radiusae) is dependent on the environment. This result suggests
that internal drivers are responsible for any potential size evolution inherent to these galaxies. However, for intermediate-/low-mass spirals (M∗ <1010M⊙) we do find some evidence for a possible environmental effect, with the mean galaxy size (ae)
being∼15–20 per cent larger in the field than in the cluster. This result is driven by a population of low-mass, large-ae field spirals (observed to contain extended stellar discs) that are largely absent from the cluster environments. This difference implies that the fragile extended stellar discs of these spiral galaxies may not survive the environmental conditions in the cluster.
We expand on this result by investigating the effect of the environment on the structure of galactic discs in spiral and S0 galaxies. Using V-band radial surface brightnessµ(r) profiles, we identify break features in the stellar disc (down-bending break – truncation; up-bending break – antitruncation) and evaluate their depen-dence on the galaxy environment. For both spiral and S0 galaxies, we find no evidence to suggest an environmental dependence on the frequency of these break features. We also find no evidence to suggest an environmental dependence on the scalelength h of pure exponential discs, or the break strength T (outer-to-inner scalelength ratio) of broken exponential discs. These results indicate that the stellar distribution in the outer regions of spiral/S0 galaxies is not significantly influenced by the galaxy environment.
In our structural analyses, one interesting observation was that truncated µ(r) profiles (down-bending breaks) are very rare in S0s; whereas in spiral galaxies they are commonplace. We expand on this result by comparing the structural properties of the disc (scalelength h, break strengthT, break surface brightnessµbrk) in spiral
and S0 galaxies. In these comparisons, we find no evidence to suggest that the scalelengthhof pure exponential discs or the break surface brightnessµbrkof broken
exponentials is dependent on the galaxy morphology. However, we do find some evidence to suggest that the break strengthT is smaller (weaker) in S0s compared to spiral galaxies. This result suggests that some process inherent to the morphological transformation of spiral galaxies into S0sdoesaffect the structure of the stellar disc causing a weakening of µ(r) breaks and may even eliminate truncations from S0 galaxies. In additional structural comparisons, we also find that the fraction of
suggesting that major mergers are not driving this transformation.
Finally, we complement our structural analyses with an assessment of whether the excess light in the outer regions of antitruncated (up-bending) µ(r) profiles is caused by an outer exponential disc or an extended spheroidal component: we use bulge–disc decomposition in order to achieve this. For spiral galaxies, in the vast majority of cases, evidence indicates that the excess light at large radii is related to an outer shallow disc. We thus conclude that in the majority of spiral galaxies, antitruncated outer stellar discs cannot be explained by bulge light and thus remain a pure disc phenomenon. However, for S0s, bulge light can have a significant effect in the outer regions of theµ(r) profile. In approximately half of S0 antitruncations, the excess light at large radii can be entirely accounted for by light from an extended spheroidal component. These results suggest that as a galaxy evolves from a spiral into an S0, the galaxy naturally evolves into a more bulge-dominated system. We suggest a fading stellar disc (e.g. caused by gas stripping and the termination of star formation) is consistent with this result.
In conclusion, our environmental studies indicate that the environment has little direct affect on the size and structure of a galaxy’s stellar distribution. This result implies that physical processes directly affecting the structure of the stellar distribu-tion (e.g. mergers or harassment), are not driving the observed morphology–density relation. With respect to both our environmental and morphological studies, we can conclude that more subtle processes acting on the gaseous component of a galaxy (e.g. ram-pressure stripping) are more likely to play an important role in the origin of the morphology–density relation and the transformation of spirals into S0s.
First and foremost, I wish to thank my Ph.D supervisors, Alfonso and Meghan, for all their scientific and personal support over the last four years. Their guidance and encouragement has been instrumental in the production of this thesis and I consider myself extremely fortunate to have benefited from their experience and expertise. Additional thanks must also go to Carlos Hoyos, for his vital assistance with the computational analyses – as well as for some entertaining discussions. I also wish to thank the entire STAGES collaboration for the production of an amazing and easy to use data set – you saved me many months of tedious ground work! Finally, a special thank you goes to my family and friends (especially PTB) for their unwavering understanding and support during my Ph.D studies, for putting up with my high stress levels over the last few months of writing and for helping me not to lose perspective of what I was trying to achieve.
The majority of the work contained within this thesis has already been presented in several published works: Chapter 3 (Paper i), Chapter 4 (Paper ii) and Chapter 6: Section 6.2 (Paper iii). The work presented in Chapter 5 and Chapter 6: Section 6.3 will feature a forthcoming paper (Paper iv).
i) Maltby D. T., Arag´on-Salamanca A., Gray M. E., Barden M., H¨außler B., Wolf C., Peng C. Y., Jahnke K., McIntosh D. H., B¨ohm A., van Kampen E., 2010, MNRAS, 402, 282: ‘The environmental dependence of the stellar-mass–
size relation in STAGES galaxies’.
ii) Maltby D. T., Gray M. E., Arag´on-Salamanca A., Wolf C., Bell E. F., Jogee S., H¨außler B., Barazza F. D, B¨ohm A., Jahnke K., 2012a, MNRAS, 419, 669: ‘The environmental dependence of the structure of outer galactic discs in STAGES
spiral galaxies’.
iii) Maltby D. T., Hoyos C., Gray M. E., Arag´on-Salamanca A., Wolf C., 2012b, MNRAS, 420, 2475: ‘Antitruncated stellar light profiles in the outer regions of STAGES spiral galaxies: bulge or disc related?’
iv) Maltby D. T., Arag´on-Salamanca A., Gray M. E., Hoyos C., Wolf C., Jogee S., B¨ohm A., 2012c, MNRAS, submitted: ‘The environmental dependence of the structure of galactic discs in STAGES S0 galaxies: implications for S0 forma-tion’.
The vast majority of the work presented in this thesis was carried out by the author, with advice from the paper coauthors listed above. Where the material presented is the result of more collaborative work, this is mentioned in the relevant chapter.
Introduction
The notion that there might be‘island universes’or galaxies outside our own Milky Way has its roots back in the mid-eighteenth century. However, it was only in the 1920s that this hypothesis was eventually confirmed and that the field of extra-galactic astronomy was born. Prior to this, any observed galaxies were simply regarded as ‘nebulae of an unknown nature’ and it was hotly debated as to whether these systems were internal or external to our Galaxy.
The matter was finally solved in 1923 when Edwin Hubble made the seminal dis-covery that so-called ‘spiral nebulae’ are indeed external to the Milky Way (Hubble 1925a,b). Using Cepheid variable stars, he was able to determine that the distances to some galaxies (e.g. the Andromeda ‘nebula’) were >200 kpc, placing them well outside our own Galactic system. Consequently, he was able to definitively conclude that spiral nebulae were extra-galactic in nature and galaxies in their own right.
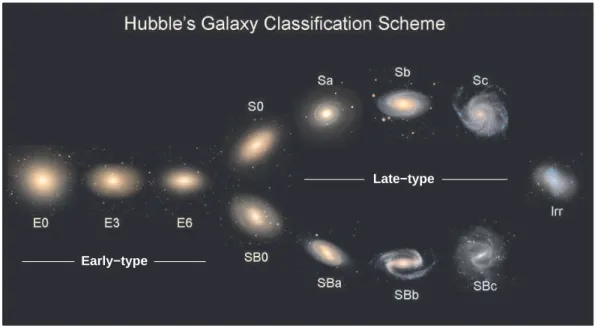
Hubble followed up this discovery with the observation that ‘extra-galactic neb-ulae’ could be grouped into different categories based on their overall appearance or morphology (Hubble 1926, 1936). The resulting classification scheme, often called ‘The Hubble Sequence’, remains in widespread use today (see Fig. 1.1).
Early−type
Late−type
Figure 1.1. The Hubble sequence. This figure was created using galaxies from the Sloan Digital Sky Survey (SDSS; York et al. 2000) classified by the members of the GalaxyZoo project (Lintott et al. 2008; image credit – http://www.galaxyzoo.org).
The Hubble sequence divides galaxies into four main categories or Hubble types: ellipticals, lenticulars, spirals and irregulars.
1. Elliptical galaxies (E): smooth ellipsoidal systems with very little internal
structure. The shape of the stellar distribution ranges from spheroidal (E0) to a highly flattened distribution (E6).
2. Lenticular galaxies (S0): a transitional class – systems with an outer smooth
disc structure (no spiral arms) in addition to a central spheroidal bulge.
3. Spiral galaxies (S/SB):systems with an outer disc structure containing visible
spiral arms and a central spheroidal bulge. The spiral class is subdivided into two parallel sequences, the normal spirals (S) and the barred spirals (SB), the latter of which exhibit an elongated ‘bar-like’ structure in the central region. The parallel spiral sequences (Sa–Sc/SBa–SBc) represent a decrease in the prominence of the central bulge and an opening up of the spiral arm structure. Later extensions to these spiral sequences include the additional Sd class, which contain a very small nucleus and irregular spiral arms (de Vaucouleurs 1959a).
4. Irregular galaxies (Irr): unordered systems with no obvious structure.
Hubble referred to the elliptical and lenticular classes as ‘early-types’ and the spiral and irregular classes as‘late-types’, a terminology still in widespread use today. This nomenclature suggests that Hubble may have originally suspected the Hubble sequence to represent an evolutionary sequence. However, Hubble (1926) states very clearly that these terms are simply intended to convey an increase in structural complexity and are not intended to have temporal connotations. We now know that evolutionary paths of this nature are almost certainly incorrect; however, the exact evolutionary path followed by galaxies remains largely uncertain.
Through the subsequent study of other galaxy properties, it is now well estab-lished that there exist many correlations between the Hubble-type morphology and properties such as colour and spectral type (Humason 1936; Holmberg 1958; de Vau-couleurs 1961; Roberts & Haynes 1994). These correlations show that the optical colours (e.g. U −R) of early-type galaxies (E/S0) are predominantly redder than those of late-type galaxies (spirals), although there are many exceptions e.g. blue ellipticals (Schawinski et al. 2009) and dusty red spirals (van den Bergh 1976; Wolf et al. 2009; Masters et al. 2010). Through the advent of modern photometric sur-veys, e.g. the Sloan Digital Sky Survey (SDSS; York et al. 2000), these correlations have now been studied using many thousands of galaxies and resulted in the discov-ery of an intrinsic colour bimodality in the local galaxy population (Strateva et al. 2001; Kauffmann et al. 2003; Balogh et al. 2004).
Strateva et al. (2001) initially reported this colour bimodality using data from SDSS (see Fig 1.2). Using visual morphologies and spectral classifications for a subset of galaxies, they were also able to establish that the two distinct peaks in the bimodality correspond roughly to early-type (E, S0 and Sa) and late-type galaxies (Sb, Sc and Irr), as expected. These two populations are now commonly known as
‘the red sequence’and ‘the blue cloud’, respectively (e.g. Bell et al. 2004).
The light we detect from a galaxy is the integrated light of its stellar population (although possibly modified by the effects of dust). Therefore, a galaxy’s optical colour is directly related to the composition of its stellar component. For the bulk of the stellar population (i.e. main sequence stars), the most luminous stars are the
0 1 2 3 4 u*-r* 12 13 14 15 16 17 18 g * 12 13 14 15 16 17 18 0 1 2 3 4 u*-r* 12 13 14 15 16 17 18 g * 12 13 14 15 16 17 18
Figure 1.2. The colour bimodality of the local galaxy population (Strateva et al. 2001). The colour bimodality from SDSS (contours) compared to a subsample of early- (triangles) and late-type (squares) galaxies classified spectroscopically (left-hand panel) and by visual inspection (right-hand panel).
hot, blue, massive but short-lived OB stars. Due to their extremely high luminosity, a relatively small number of OB stars can completely overwhelm the total light produced by fainter stars in the stellar population. Consequently, a galaxy may have a blue optical colour even if the majority of its stellar population is comprised of fainter redder stars (Ellis et al. 2001). If a galaxy has a blue optical colour (i.e. late-types), this really indicates the presence of young massive OB stars and is a clear signature of on-going or recent star formation. In contrast, low-mass redder stars generally contribute relatively little to the light output of a galaxy; and therefore, if a galaxy has a red optical colour (i.e. early-types) this indicates not only the absence of young OB stars but also the presence of luminous evolved red giant stars. Consequently, red optical colours are a signature of an old, passive (non star-forming) stellar population (although dust effects can be a complicating factor, e.g. dusty red spirals; Wolf et al. 2009).
Spectroscopy has reinforced these theories through the identification of charac-teristic spectral features in galaxy spectra which relate to the stellar spectral types and their effect on the interstellar medium. For example, the presence of OB stars is commonly indicated by the emission lines produced from their ionisation of interstel-lar gas (e.g. [Oii], Hα), the strength of which can also be used to estimate a galaxy’s
star-formation rate (SFR). The use of spectroscopy, along with radio/submillimetre imaging, has also enabled the detection of cold gas in galaxies (the raw material for star formation). Unsurprisingly, the amount of cold gas in a galaxy is also dependent on morphology, with early-type galaxies having less cold gas (and consequently less star formation) than late-types galaxies (see e.g. Roberts & Haynes 1994).
When one considers all these correlations with morphology, it becomes clear that there are two distinct galaxy populations in the Universe: old red passively evolving galaxies with early-type (E/S0) morphologies, and blue star-forming galaxies with late-type (spiral) morphologies. This bimodality raises the fundamental question;
‘What evolutionary path leads some galaxies to become old red passive ellipticals/lenticulars as opposed to young blue star-forming spirals?’
One way in which we can try and explore this issue is to compare galaxy properties between different galaxy populations (e.g. different redshift ranges or galaxy envi-ronments) and search for characteristic differences that could shed light on their evolution.
1.1
The galaxy environment
It has long been known that galaxies are not distributed randomly throughout the Universe. Instead, most galaxies are actually found in gravitationally bound groups or clusters (Hubble & Humason 1931; Shapley 1933; Abell 1965). This fact, coupled with observations of apparently interacting galaxies, has given rise to the idea that galaxies may be influenced by their local surroundings (i.e. the galaxy environment). Galaxy environment can be defined in many different ways; however, it generally relates to the local density of galaxies. Therefore, the range of galaxy environments span from the high-densities of cluster cores to the low-densities of the general field (i.e. galaxies in relative isolation).
In order to understand the origin of the galaxy environment, we must first un-derstand how galaxies assemble their mass and how structures form in the Universe. Our current theories of structure formation are largely based on the well-established principle of hierarchical assembly.
1.1.1 Hierarchical assembly
The light we detect from a galaxy originates from either its stellar or gaseous com-ponent. However, these components account for only a very small fraction of a galaxy’s overall mass. It is now widely accepted that the vast majority of mass in a galaxy (∼90 per cent), and indeed the Universe as a whole, is comprised of weakly interacting non-baryonic dark matter (see Spergel et al. 2007, for current determi-nations). This dark matter extends well beyond the visible extent of the galaxy and dominates the gravitational interactions in the Universe.
In current theories of structure formation (e.g. Davis et al. 1985), the dark matter density distribution in the very early Universe contained small-amplitude Gaussian fluctuations with the highest peaks in this density distribution being the first to collapse under their own gravity. Over time, these small collapsing dark matter haloes accrete more material from the surrounding Universe and grow in mass. At the same time, stars begin to form as gas is accreted and a galaxy is born in the centre of the halo. Under the influence of gravity, the dark matter haloes then begin to continually merge with each other, forming ever larger haloes or structures (Lacey & Cole 1993; see Fig. 1.3). This growth in structure through merging is known as
‘hierarchical assembly’. In this model, it is the dark matter halos that are merging
not the galaxies embedded within them. Therefore, over time, groups and clusters of galaxies are built up as their individual dark matter halos merge and form ever larger structures.
As a direct result of this model, the largest gravitationally collapsed structures in the Universe today (i.e. high-density galaxy clusters) are expected to have older, more evolved galaxy populations than lower-density environments (i.e. galaxy groups and the general field; De Lucia et al. 2006). Consequently, these models predict that correlations should exist between the properties of galaxies and the galaxy environment. It is now well established that such correlations do exist between
Figure 1.3. A schematic representation of the growth of dark matter haloes by hierarchical assembly (Lacey & Cole 1993). In this figure, known as a ‘merger tree’, time increases from top to bottom and the width of the branches represent the mass of a halo, and its progenitors at any given time t.
galaxy properties such as morphology, colour and star-formation rate (SFR), and the environment in which they are found. We shall review these correlations in the following sections.
1.1.2 The morphology–density relation
It has long been known that there exists a contrast between the morphologies of galaxy populations in low- and high-density environments (Hubble & Humason 1931; Abell 1965; Oemler 1974). Galaxies in high-density cluster cores are predominantly of early-type (E/S0) morphology, while galaxies in the low-density field are mainly late-type (spiral) galaxies. However, Dressler (1980) was the first to quantify this relationship as a function of the local galaxy density (z∼0) and establish the corre-lation now known as themorphology–density relation(see Fig. 1.4). This correlation clearly shows that the fraction of elliptical and S0 galaxies increases smoothly with increasing galaxy density from the outskirts of the cluster environment to the denser cluster core. A corresponding decrease in the late-type (spiral + irregular) fraction with increasing galaxy density is also observed.
Subsequent studies at higher redshift (z∼0.5) have revealed significant evolution in the morphology–density relation over cosmic time (Dressler et al. 1997). At higher redshifts z ∼0.5, the fraction of ellipticals in the cluster environment is similar to that found in the local Universe. However, at z ∼ 0.5 the fraction of S0s in the cluster environment is significantly lower than observed in the local Universe, while the fraction of cluster spirals is proportionally higher. This result suggests that the
Figure 1.4. The morphology–density relation (Dressler 1980). The observed fraction of elliptical (E), S0 and spiral+irregular (S+Irr) galaxies as a function of the log of projected galaxy density ρproj. (in galaxies Mpc−2) from a sample of 55 rich clusters (z ∼0). The fraction of elliptical and S0 galaxies increases smoothly from low to high densities, while the fraction of spiral+irregular galaxies decreases.
progenitors of low-z S0 galaxies are predominantly spiral galaxies. Therefore, it seems plausible that blue star-forming spiral galaxies can fall into the gravitational well of a cluster, have their star formation extinguished by the cluster environment, and then eventually evolve into the S0s we see in the Universe today.
1.1.3 Other correlations with environment
In addition to morphology, there are several other galaxy properties that also show strong correlations with the galaxy environment, e.g. colour, star-formation rate (SFR) and the fraction of active galactic nuclei (AGN).
(i) Galaxy colours. The photometric colours of galaxies show a distinct
corre-lation with the galaxy environment (e.g. Kodama et al. 2001; Blanton et al. 2005; Baldry et al. 2006). In the comparison of optical colours (e.g. V-I), galaxies in high-density regions tend to be redder than analogous galaxies (i.e. galaxies of sim-ilar luminosity) in lower density environments (see Fig. 1.5). In addition to this,
Figure 1.5. Galaxy colour as a function of environment (Kodama et al. 2001). The correla-tion between colour (V-I) and local galaxy density Σ for a rich cluster (A851,z= 0.41). The three red lines represent the 25th, 50th and 75th percentile colours. The open circles and filled triangles show galaxies brighter and fainter than I= 21.4, respectively. In this data, an abrupt transition in colour is observed at log Σ∼2. Note: the Σ scale was miscalculated in Kodama et al. (2001) and the subject of a later erratum (Kodama et al. 2003).
some studies (e.g. Kodama et al. 2001) also report an abrupt transition in colour at some characteristic density (see Fig. 1.5), implying a critical density at which the colours of in-falling galaxies are more strongly affected by the cluster environment. However, in other studies that use more general measures of the galaxy environment (e.g. halo mass), this critical density is not observed (Weinmann et al. 2006).
(ii) Star-formation rate. Recent observations have also reported that the
star-formation rate (SFR) of galaxies is strongly correlated with the galaxy environment (e.g. Lewis et al. 2002; G´omez et al. 2003). Using optical tracers of SFR (e.g. Hα emission), it has been shown that galaxies in high-density environments have lower SFRs than those in lower density environments (see Fig. 1.6). This trend is partic-ularly noticeable when you consider strongly star-forming galaxies (i.e. those in the 75th percentile of the SFR distribution). In addition to this, an abrupt transition in SFR at some characteristic density is sometimes observed (e.g. G´omez et al. 2003; see Fig. 1.6), implying a critical density at which the star formation of in-falling galaxies is more strongly effected by the cluster environment (c.f. to the critical
Figure 1.6. Galaxy star formation as a function of environment (G´omez et al. 2003). Left-hand panel: the distribution of star-formation rate (SFR) as a function of the pro-jected local surface density of galaxies from SDSS. Right-hand panel: a similar distribution for the luminosity normalised SFR (SFRN). In both cases, the shaded area represents the observed distribution, with the upper and lower limits being the 75th and 25th percentiles, respectively. The embedded solid line is the median SFR. In this data, an abrupt transition in the SFR distribution is observed at a surface density∼1 h−752Mpc−2.
density observed by Kodama et al. 2001 using galaxy colour). However, in other studies that use more general measures of the galaxy environment (e.g. halo mass), this critical density is not observed (Weinmann et al. 2006).
An important consideration in these relations is that the optical signatures of SFR can be obscured in galaxies that have large amounts of interstellar dust (e.g. dusty red spirals; Wolf et al. 2009). Using infrared data, Wolf et al. (2009) probed this obscured star formation and found that the SFR of star-forming galax-ies in the high-density cluster environment is clearly lower than in the low-density field. They also found that the SFR of blue galaxies alone is similar in both the field and cluster environments, suggesting dusty red spirals represent a key intermediate stage in galaxy evolution.
(iii) AGN fraction. There is also a potential relationship between the fraction of galaxies hosting AGN and the local galaxy density. Using [Oiii] emission as an
indicator of AGN activity, Kauffmann et al. (2004) find that twice as many galaxies host AGN in low-density environments compared to high-density environments.
It is not really surprising that we observe these density correlations given the well-established morphology–density relation and the observed correlations between galaxy properties and Hubble type. However, through studying different galaxy properties as a function of environment we can assess which galaxy properties are more susceptible to environmental influences and hence determine potential evolu-tionary paths for galaxies in-falling to the cluster environment. Considering all the
0.01 0.1 1 10 virial radius 0.01 0.1 1 10 virial radius 0.0 0.2 0.4 0.6 0.8 1.0
Passive Galaxy Fraction
Local Galaxy Density −18.0<M <−16.0 r −18.5<M <−18.0 r −19.0<M <−18.5 r −19.5<M <−19.0 r −20.0<M <−19.5 r −20.5<M <−20.0 r −21.0<M <−20.5 r −21.5<M <−21.0 r M <−21.5 r 0.0 0.2 0.4 0.6 0.8 1.0
Passive Galaxy Fraction
Local Galaxy Density 9.0<log(M )<9.2 * 9.2<log(M )<9.4 * 9.4<log(M )<9.6 * 9.6<log(M )<9.8 * 9.8<log(M )<10.0 * 10.0<log(M )<10.2 * 10.2<log(M )<10.4 * 10.4<log(M )<10.6 * 10.6<log(M )<10.8 * 10.8<log(M )*
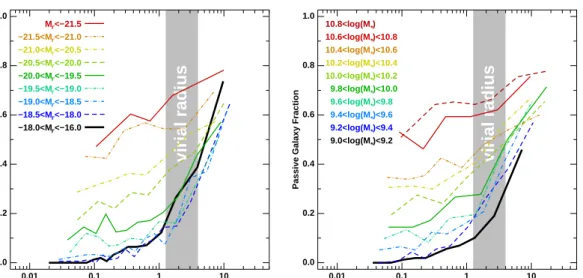
Figure 1.7. The robustness of different mass galaxies to the effect of the galaxy envi-ronment (Haines et al. 2007). The fraction of passively evolving galaxies as a function of the local galaxy density in SDSS for different luminosity (left-hand panel) and stellar mass ranges (right-hand panel).
observed correlations with environment, it is clear that there is a trend to a more passive (non star-forming) and spheroidal galaxy population in dense environments. This observation suggests that blue star-forming spiral galaxies falling into the grav-itational well of a cluster, somehow have their star formation extinguished by the cluster environment and eventually evolve into the S0s we see in the Universe today. In addition to these environmental correlations, it has also become apparent that a galaxy’s luminosity (and hence stellar mass) is a critical factor in governing how susceptible a galaxy is to environmental influences (Haines et al. 2006, 2007). Using data from SDSS, Haines et al. (2007) find that the correlation between the fraction of passive (non star-forming) galaxies and the local galaxy density is a strong function of luminosity and stellar mass (see Fig. 1.7). For luminous high-mass galaxies, the variation in the passive galaxy fraction from low- to high-density environments is much less extreme than for fainter mass galaxies. This result suggests that low-mass galaxies are far more susceptible to the effects of the galaxy environment than high-mass galaxies (e.g. less able to withstand any effect that could diminish their gas supply and suppress star formation).
1.1.4 Galaxy evolution: ‘nature’ versus ‘nurture’
The fact that a galaxy’s morphology, colour and star-formation rate is closely related to the local density of galaxies suggests the local environment is of key importance in the formation and of evolution galaxies. The observed correlations (see Sections 1.1.2 and 1.1.3) show a clear trend to a more passive and spheroidal population in dense environments. However, despite this evidence it remains uncertain as to whether the galaxy environment has any direct effect on the individual galaxies concerned.
In hierarchical models of galaxy formation (e.g. De Lucia et al. 2006), galaxies in the highest-density environments (i.e. cluster cores) formed earlier than analogous galaxies in lower-density environments (see Section 1.1.1). Therefore, it is natural to expect cluster galaxies to have older and more evolved stellar populations than analogous galaxies in the field. Consequently, it is possible that secular evolution
can account for the observed density correlations and that the environment itself has little or no direct effect on individual galaxies. However, at the same time, galaxies that formed in the high-density environments will also have had more time to experience the external influence of their local environment. Any such influences would also act on any in-falling galaxies as they are accreted into larger haloes. This raises the fundamental problem of ‘nature’ versus ‘nurture’ in our understanding of galaxy evolution:
1. Nature: galaxies are essentially unaffected by their local environment and the
origin of the observed density correlations is due to cluster galaxies being older and more evolved than analogous galaxies in the field. Galaxies evolve secularly, with a galaxy’s mass being key in determining the effect of internal processes (e.g. AGN feedback) on the observed properties of the galaxy.
2. Nurture: galaxies are directly affected by their local environment, resulting
in their observed properties, e.g. gas content, star-formation rate, colour and morphology.
In reality, the nature–nurture hypotheses are not mutually exclusive and a mix-ture of both scenarios may be responsible for the observed density correlations. This fact has led some authors to suggest that the nature–nurture debate is ill posed (e.g. De Lucia et al. 2012). However, nonetheless, the role of the galaxy environ-ment in determining the properties of galaxies remains one of the most fundaenviron-mental and yet still unanswered aspects in our understanding of galaxy evolution.
1.1.5 Outstanding questions
At the current time, there are several key outstanding problems in our understanding of galaxy evolution and the role of the galaxy environment:
(i) How does star formation get suppressed in the cluster environment?
Cor-relations of star-formation rate with galaxy density suggest that star formation is suppressed in high-density environments. The removal of the raw material for star formation (i.e. cold gas) from a galaxy is the most likely explanation. However, whether this is due to an internal process (e.g. AGN activity; Croton et al. 2006) or external influences (i.e. the cluster environment) is still uncertain. An additional complication is that our current models of galaxy formation predict this cold gas supply to be continually replenished by accretion from an outer hot gas reservoir (e.g. Fall & Efstathiou 1980), thus leading to sustained star formation in the galactic disc. If old stellar populations are to evolve, this process must also be interrupted.
(ii)How do spiral galaxies transform into S0s? The suppression of star formation
by the cluster environment is one potential mechanism by which a spiral galaxy could begin its transformation into an S0. However, the existence of S0 galaxies in the general field implies that either cluster processes are not responsible, or that S0s can form via alternative processes in different environments. Consequently, understanding the processes that can quench star formation and how they relate to the galaxy environment remains a topic of extensive study.
(iii) What drives the morphology–density relation? Understanding the origin of the morphology–density relation is key to our understanding of the role of the galaxy environment in galaxy evolution. However, at the present time we are still largely uncertain about what physical processes can bring about changes in stellar
structure (e.g. disc-to-spheroid transformations), how these are related to changes in star formation, and how these processes are related to the galaxy environment.
Disentangling the relative importance of both internal and external influences in galaxy evolution is vital to understanding these problems. However, this is very challenging and remains a topic of considerable effort by the scientific community. The matter is further complicated by the fact that changes in star formation are not necessarily related to changes in morphology. The processes that bring about these changes may well act on different timescales and in different regimes. In the following section, we shall review some of these potential environmental processes and explore how they can bring about changes in morphology and star formation in a galaxy.
1.2
Environmental processes
Many potential processes have been suggested in order to try and account for the observed correlations between the properties of galaxies and their local environment. However, the exact mechanisms driving these correlations remain elusive. Certain physical processes inherent to galaxy evolution and related to the galaxy environ-ment may contribute, e.g. by terminating star formation through gas stripping or by disrupting the stellar distribution. However, direct evidence for these processes is still lacking and their relative importance in galaxy evolution remains uncertain. The numerous potential processes and related varying terminology can be some-what confusing. However, several useful reviews are now available (e.g. Treu et al. 2003; Boselli & Gavazzi 2006; Poggianti 2006). Following the distinctions laid out by Treu et al. (2003), we separate these potential environmental processes into three broad categories: those related to galaxy interactions, those related to galaxy-cluster gravitational interactions, and finally those that refer to an interaction be-tween a galaxy and the intracluster medium (ICM). We expand on each of these categories in the following sections.
1.2.1 Galaxy-galaxy interactions
These processes refer to the gravitational interactions between two or more galaxies.
(a) Strong interactions – mergers: low-speed interactions between galaxies resulting
in a merging of their stellar distributions (Icke 1985; Bekki 1998). Mergers are most efficient when galaxies are at relatively low velocities; therefore, mergers are thought to be more prevalent in low-density environments (i.e galaxy groups) than in high-density cluster cores. There are two main schemes for classifying mergers: one based on the mass ratio of the merging galaxies;
(i) Major mergers: the merger between two galaxies of similar mass. These
dramatic events often lead to fundamental structural changes in the stellar distribution of the remnant galaxy (i.e. turning disc galaxies into ellipticals; e.g. Gonz´alez-Garc´ıa & Balcells 2005).
(ii) Minor mergers: the merging of a large mass galaxy with a small companion
(also calledsatellite accretion). These events can result in a smooth stellar envelope or thick outer disc forming around the more massive galaxy (Naab et al. 2007). These events may be prevalent in both the field and cluster environments.
and another scheme based on the amount of available gas in the merging galaxies.
(i) ‘Dry’ mergers: the merging of gas poor galaxies (e.g. van Dokkum 2005;
Bell et al. 2006). These events result in little triggered star formation and may lead to a subsequent expansion of the stellar distribution (also called
‘dissipationless’ merging).
(ii) ‘Wet’ mergers: the merging of gas rich galaxies resulting in triggered star
formation as the gaseous components are driven into the central regions of the remnant galaxy (Mihos & Hernquist 1996; Barton et al. 2000).
(b) Tidal interactions: multiple interactions at either low or high velocities.
(i) Low-speed tidal interactions: low-speed galaxy encounters that do not
re-sult in a merger event. Such encounters could cause the ‘tidal stripping’
of stellar and gaseous material from interacting galaxies. These events are expected to be more prevalent at high-densities but may play an important role in low-density environments (i.e. galaxy groups).
(ii) High-speed tidal interactions – galaxy harassment: multiple high-speed
en-counters between galaxies in the cluster environment (Moore et al. 1996). Such interactions could lead to the tidal stripping of gas and stellar mate-rial from the ‘harassed’ galaxy and/or disrupt the structure of the stellar distribution (i.e. gradually turn a disc galaxy into a spheroid).
1.2.2 Galaxy-cluster gravitational interactions
These interactions occur between an in-falling cluster galaxy and the gravitational potential of the cluster.
(a) Tidal compression of galactic gas: the tidal compression of a galaxy’s gas due
to gravitational interactions with the cluster potential (Byrd & Valtonen 1990; Henriksen & Byrd 1996). This process can trigger star formation and lead to an increase in the star-formation rate.
(b) Tidal truncation of the outer galactic regions: the tidal truncation (stripping)
of the outer regions of a galaxy’s dark matter halo due to the gravitational potential of the cluster (Merritt 1983, 1984). These tidal interactions can lead to structural changes in the in-falling galaxy’s mass profile. However, if the outer hot gas reservoir is also affected (see Section 1.1.5), this process can also lead to a quenching of star formation (i.e. strangulation, see Section 1.2.4). 1.2.3 Galaxy-ICM interactions
These interactions occur between an in-falling cluster galaxy and the gaseous com-ponent of the cluster – the intracluster medium (ICM).
(a) Ram-pressure stripping: the removal of cold gas from a galaxy’s interstellar
medium (ISM) due to the pressure exerted by the intracluster medium (Gunn & Gott 1972). The removal of the galactic gas supply leads to suppressed star formation in the affected galaxy. Ram-pressure stripping is expected to be most prevalent in very dense environments (e.g. cluster cores).
(b) ICM pressure: the compression of interstellar gas clouds due to the pressure exerted by the intracluster medium (Dressler & Gunn 1983; Evrard 1991). This process can trigger star formation and lead to a temporary increase in the star-formation rate.
(c) Turbulent and viscous stripping: various transport processes in the intracluster
medium (ICM) that can lead to the stripping of a galaxy’s interstellar medium (e.g. Nulsen 1982). The removal of the galactic gas supply leads to suppressed star formation in the affected galaxy.
(d) Thermal evaporation: the thermal evaporation (heating) of a galaxy’s
interstel-lar medium (ISM) by interactions with the hot intracluster medium (Cowie & Songaila 1977). The removal of the galactic gas supply leads to suppressed star formation in the affected galaxy.
1.2.4 Potential environmental effects
In the previous sections, we have explored some of the many potential processes by which a galaxy can be influenced by its local environment. However, regardless of the exact physical mechanism responsible, these environmental processes can either affect the galaxy’s stellar distribution (morphology), cold gas component, or outer extended hot gas reservoir. As a consequence, these processes can lead to three broad effects on a subject galaxy:
(i) Morphological transformation: mainly the disruption of the structure of the
stellar distribution caused by galaxy-galaxy interactions (e.g. mergers or ha-rassment). These events could also be the origin of intracluster light as inter-acting galaxies lose stars to the intracluster medium. However, some morpho-logical transformations are possible without disrupting the stellar distribution. If star formation is suppressed in the stellar disc (e.g. by gas stripping), then the disc will gradually fade and the bulge-to-disc ratio will change. This can significantly affect the observed morphology (see e.g. Poggianti 2006).
(ii) Triggered/suppressed star formation: the compression/stripping of a galaxy’s
cold gas component leading to a rapid triggering/termination of star formation – timescales ∼107yrs.
(iii) Gradual decline in star formation – strangulation: the removal of a galaxy’s outer hot gas reservoir (Larson et al. 1980; see Section 1.1.5) leading to the slow decrease in the star-formation rate as the galaxy depletes its remaining cold gas supply (also known asstarvationorsuffocation) – timescales >1 Gyr. However, these effects can also be induced from internal processes (e.g. AGN activity; Croton et al. 2006). Consequently, disentangling the effects of internal and external influences on galaxy evolution is an extremely challenging and daunting task. Ultimately, several unrelated processes may work together to bring about the above effects and explain the observed environmental correlations (see Sections 1.1.2 and 1.1.3). As an added complication, these processes may work on very different timescales and be more/less effective in different galaxy environments and for galax-ies of different mass. Galaxgalax-ies may undergo some physical changes in low-density environments (i.e. galaxy groups) and then complete their morphological transfor-mations as the group itself in-falls to the cluster environment (i.e. pre-processing).
The time-lag between processes acting on a galaxy and the visual signatures of the effects they induce is also a complication.
Considering all the above issues, it is clear that galaxy evolution is undoubtedly a very complex process. However, through studying different galaxy properties (both in structure and star formation) as a function of the galaxy environment, both for different galaxy morphologies and stellar masses ranges, we can try and unravel the role of the galaxy environment in galaxy evolution.
1.3
The size and structure of galaxies and the galaxy
environment
In this thesis, we use observational data to explore the effect of the galaxy environ-ment on the size and structure of a galaxy’s stellar distribution. Therefore, we are essentially exploring whether or not the galaxy environment can cause strong effects that can disrupt the stellar distribution (e.g. through galaxy-galaxy interactions). Other more subtle processes, acting on the gaseous component and causing a trig-gering/termination of star formation (e.g. ram-pressure stripping) are not directly probed by this work, although these processes could still have an indirect effect on the galaxy morphology.
1.3.1 The size of the stellar distribution
Several scaling relations are known to exist for galaxies in the Universe. The most famous are the relations between the luminosity of a galaxy and the velocity of its component stars (Faber & Jackson 1976; Tully & Fisher 1977):
(i) The Faber–Jackson relation: for spheroidal (elliptical) galaxies, the central
stellar velocity dispersion σ0 increases with increasing galaxy luminosity L
roughly as
L∝σoα α∼4. (1.1)
(ii) The Tully–Fisher relation: for disc (spiral/S0) galaxies, the maximum
rota-tional velocity vmax increases with increasing galaxy luminosityL roughly as
L∝vmaxα α∼4. (1.2)
For both spheroidal and disc galaxies, the velocities v of the stellar population are directly governed by the total mass Mtot of the galaxy (i.e. Mtot(r) =rv2/G).
Consequently, these relations indicate that the more luminous a galaxy is, the greater its total massMtot. More importantly, if we assume the surface brightness of a given
galaxy type is roughly constant (L∝r2), these relations imply that for that galaxy
type, the mass-to-light ratio (M/L) is well-defined. If galaxies contained no dark matter, one would expect a well-defined M/L, since a galaxy’s luminosity L is di-rectly related to the mass of its stellar componentM∗ (note: M/L≁ constant since
a galaxy’s luminosity will also depend on the specific properties of the stellar popula-tion, especially age). However, since the majority of a galaxy’s mass is comprised of dark matter (see Section 1.1.1), these relations are surprising. Somehow the amount of stellar mass in a galaxy is related to the mass of its dark matter halo.
Figure 1.8. The stellar-mass–size relation generated using 140 000 galaxies from SDSS (Shen et al. 2003). The median (top) and dispersion (bottom) of the distribution of half-light radius in the z-band (R50,S,z) as a function of stellar mass. The half-light radii were determined from S´ersic fits and the relations shown are for early- (squares) and late-type (triangles) galaxies as defined by their S´ersic indexn(see Section 1.3.2).
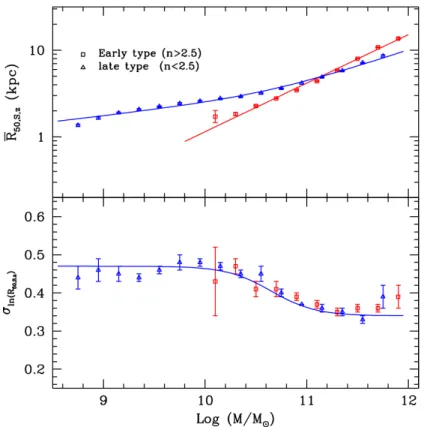
Another well-established scaling relation is the Kormendy relation – the relation-ship between the luminosityL(and hence stellar massM∗) of a galaxy and the phys-ical size of its stellar distribution (Kormendy 1977; Shen et al. 2003; see Fig. 1.8). This relation shows that the brighter (and hence more massive) a galaxy is, the greater its physical size (as measured by the half-light or effective radius re – the
radius within which half of a galaxy’s total light is emitted). For stellar mass M∗, this relationship is known as the stellar-mass–size relation.
Various physical processes could potentially effect the physical size of a galaxy (e.g. ‘dry’ merging or minor mergers, see Section 1.2.1) and the rate of these processes may be related to the galaxy environment. Therefore, comparisons of the stellar-mass–size relation between galaxies in the field and cluster environments can be used to assess whether or not the galaxy environment affects the physical size of galaxies, and hence aid in determining the importance of these processes in driving the morphology–density relation. We shall return to this problem in Chapter 3. 1.3.2 The structure of the stellar distribution
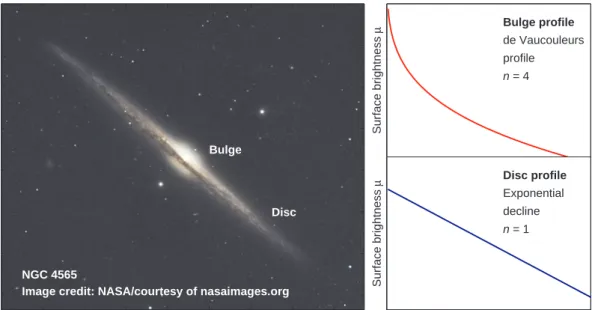
Since the work of Patterson (1940), de Vaucouleurs (1959b) and Freeman (1970), we have known that the light profiles of disc galaxies are comprised of two main structural components: an inner component dominated by a bulge (spheroidal com-ponent); and an outer component consisting of an exponentially declining stellar disc (see Fig. 1.9).
NGC 4565
Image credit: NASA/courtesy of nasaimages.org Disc Bulge Surface brightness µ Bulge profile de Vaucouleurs profile n = 4 Galaxy radius r Surface brightness µ Disc profile Exponential decline n = 1
Figure 1.9. The structure of a typical disc galaxy (NGC 4565). The central bulge component follows a de Vaucouleurs (r1/4) profile, while the outer exponential disc follows
a simple exponential decline.
(i) Bulge component: the light profile for the bulge component generally follows a
‘classical’, de Vaucouleurs (1948), r1/4 profile given by
µ(r) =µe+ 8.3268 " r re 1/4 −1 # , (1.3)
where µ is the surface brightness in mag arcsec−2, r is the radius and µe is
the surface brightness at the effective radius re. These profiles are thought to
originate from the result of a major merger event. Bulge profiles that do not follow this general form are called ‘pseudo bulges’ and are thought to form from secular processes (Kormendy 1993; Kormendy & Kennicutt 2004).
(ii) Disc component: the light profile for the stellar disc generally follows a
sim-ple exponential decline with some minor deviations related to substructure (e.g. spiral arms). The exponential decline is given by
µ(r) =µ0+ 1.0857
r
h
, (1.4)
where µ is the surface brightness in mag arcsec−2, r is the radius, µ
0 is the
central (r = 0) surface brightness (minus the bulge component) and h is the characteristic scalelength.
For a more general description of a galaxy’s light profile, an alternative single component parameterization known as a S´ersic (1968) profile is often used. For surface brightnessµin mag arcsec−2, a S´ersic profile is given by
µ(r) =µe+ 1.0857κ " r re 1/n −1 # , (1.5)
wherenis the S´ersic index (a concentration parameter) and the normalisation con-stant κ = κ(n) ≃ 1.9992n−0.3271. In this general description, a disc profile has n= 1, and a bulge profile hasn= 4. In reality, galaxies contain both disc and bulge components and to different extents; and therefore, the S´ersic profile (and S´ersic index) provides a useful description/measure of the concentration of the galaxy’s stellar distribution. For massive galaxies (e.g. M∗ > 1010M⊙), the S´ersic index is broadly related to morphology with early-type (elliptical) galaxies having n >2.5 and late-type (disc) galaxies having n <2.5. Due to the simple and useful param-eterization of the S´ersic profile, these profiles are very common in current galaxy surface brightness model-fitting codes, e.g. galfit(Peng et al. 2002).
The structure of galactic discs
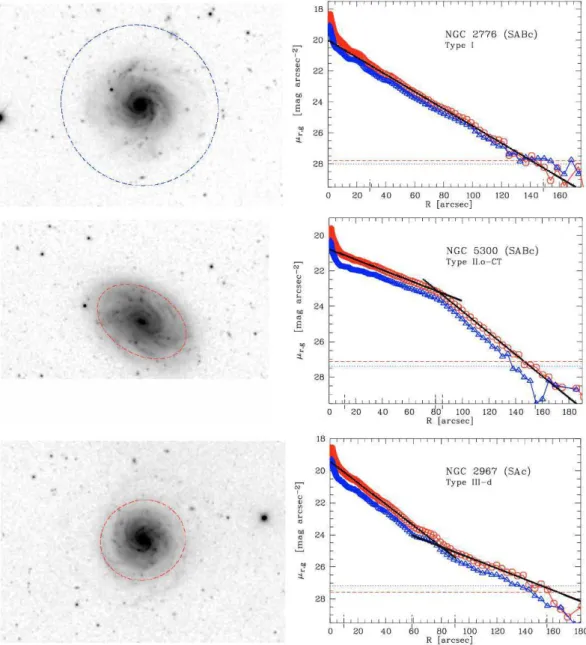
We now know the classical picture of a galaxy (simple bulge and disc) does not hold for the majority of galaxies in the Universe. For disc galaxies in particular, this simple model has been shown to fail at the faint surface brightness in the outer regions of the stellar disc (van der Kruit 1979; Pohlen et al. 2002). Since van der Kruit (1979), we have known that the exponential decline in the outer disc does not extend out to the last measured point but can be truncated (sharply cut off) after several scalelengths. More recently, Pohlen et al. (2002) have shown that the exponential disc does not cut off completely at the truncation. They find that most profiles are actually best described by a two-slope model (broken exponential), characterised by an inner and outer exponential scalelength separated by a relatively well-defined break radiusrbrk. Many studies have now reported (mainly using surface
photometry) the existence of broken exponential discs (truncations) in disc galaxies in both the local (Pohlen et al. 2002, 2007; Pohlen & Trujillo 2006; Bakos et al. 2008; Erwin et al. 2008, 2012; Guti´errez et al. 2011; Maltby et al. 2012a) and distant z <1 Universe (P´erez 2004; Trujillo & Pohlen 2005; Azzollini et al. 2008).
As a direct result of these studies, a comprehensive classification scheme for disc galaxies has emerged based on break features in the outer disc component of their radial µ(r) profiles (see e.g. Pohlen & Trujillo 2006; Erwin et al. 2008). This classification scheme consists of three broad profile types (Type I, II and III):
1. Type I (no break) – the galaxy has a simple exponential profile extending out to several scalelengths (e.g. Bland-Hawthorn et al. 2005);
2. Type II (down-bending break,truncation) – a broken exponential with a shal-low inner and steeper outer region separated by a relatively well-defined break radiusrbrk(van der Kruit 1979; Pohlen et al. 2002);
3. Type III (up-bending break, antitruncation) – a broken exponential with the opposite behaviour to a Type II profile (i.e. a shallower region beyond rbrk;
Erwin et al. 2005).
In each case, the classification refers to the outer, disc component of the galaxyµ(r) profile and does not consider the inner bulge component even if the bulge is near exponential in nature. Examples of each profile type are shown in Fig. 1.10.
Measurements independent of surface photometry (from resolved star counts) are also available on nearby galaxies for each of the three profile types. Bland-Hawthorn et al. (2005) find that NGC 300 has a simple exponential profile extending out to
as a broken exponential with a down-bending break (Type II), and Ibata et al. (2005) report that M31 could be described as having an antitruncated disc (Type III).
Understanding the structure of galactic discs is an important aspect in under-standing the formation and evolution of disc galaxies and the role of the galaxy environment. The fragile, outer regions of these galactic discs are more easily af-fected by interactions with other galaxies and the cluster environment, and therefore their structural characteristics must be closely related to their evolutionary history. Consequently, exploring the effect of the galaxy environment on the light distribution (surface brightnessµprofile) of disc galaxies should aid in our understanding of the physical processes of galaxy evolution occurring in different galaxy environments. We shall explore this problem in Chapters 4–6 of this thesis.
1.4
Thesis overview
This thesis concerns the effect of the galaxy environment on the physical size and structure of the stellar distribution for relatively local galaxies (z < 0.3). Conse-quently, this work focuses on the exploration of whether or not the galaxy environ-ment can cause strong effects that can disrupt a galaxy’s stellar distribution, and hence drive the morphology–density relation.
In order to achieve this, we first require extensive and high-quality data on a large sample of local galaxies. We find the Space Telescope A901/2 Galaxy Evolution Survey (STAGES; Gray et al. 2009) an ideal data set within which to carry out our studies. An overall summary of the STAGES survey is contained in Chapter 2, along with a description of how we measure the galaxy environment and select our galaxy samples.
We then begin our investigations in Chapter 3, where we explore the effect of the galaxy environment on the physical size of galaxies using the stellar-mass–size relation. For different Hubble-type morphologies, we compare the stellar-mass– size relation between the environments of the general field, the cluster, and the extreme environment of the cluster core. These comparisons have allowed us to assess whether or not the galaxy environment has any effect on galaxy sizes; and therefore, assess whether processes that can cause an expansion of the stellar distribution are driving the morphology–density relation.
We then move on to explore the effect of the galaxy environment on the structure of galactic discs. In Chapter 4, we investigate the effect of the galaxy environment on the structure of radial surface brightness profiles in spiral galaxies. We then com-plement this work with an analogous investigation on the effect of the environment on the galactic discs of S0 galaxies (Chapter 5). The comparisons of galactic disc structure between galaxies in different environments and between galaxies of differ-ent morphology, has allowed us to assess whether the galaxy environmdiffer-ent has any influences on stellar disc structure and shed light on potential evolutionary paths for spiral galaxies to evolve into S0s. We conclude this work with an examination of the impact of the de Vaucouleurs (1948) bulge profile on the surface brightness profile of the stellar disc in both spiral and S0 galaxies (Chapter 6).
The overall conclusions of this work, and their impact on our current theories of galaxy evolution, are discussed in Chapter 7. Throughout this thesis, we adopt a cosmology of H0 = 70 km s−1Mpc−1, ΩΛ = 0.7 and Ωm = 0.3, and use AB
Figure 1.10. Stellar disc profile types (Pohlen & Trujillo 2006). The three main types of radial surface brightnessµ(r) profile for disc galaxies: Type I – no break or pure exponential profile (top row), Type II – down-bending break ortruncation (middle row), and Type III – up-bending break or antitruncation (bottom row). Left-hand panels: r′-band images. Right-hand panels: azimuthally-averaged radial µ(r) profiles in the g′ (blue triangles) and
The STAGES survey
In order to explore the effect of the galaxy environment on the size and structure of galaxies, we require high-quality multiwavelength data and imaging on a large sample of local galaxies covering a wide range of environments and luminosities. Such extensive observations are most easily sourced from the rich archives available from modern surveys. For our research aims, the extensive multiwavelength data and imaging available from the Space Telescope A901/2 Galaxy Evolution Survey (STAGES; Gray et al. 2009) forms an invaluable data set within which to carry out our studies. Indeed, the work presented in this thesis is entirely based on the STAGES data and imaging published by Gray et al. (2009).
2.1
Overview
STAGES is an extensive multiwavelength survey designed to probe the physical drivers of galaxy evolution across a wide range of environments and luminosities (Gray et al. 2009). The survey targets the complex Abell(A) 901/902 multiclus-ter system (z ∼0.167), which consists of three clusters (A901a, A901b and A902) and related groups [e.g. the South-West (SW) group], all located within 0.5◦×0.5◦ (∼5×5 Mpc2; see Fig. 2.1). Consequently, the survey region encompasses a wide
range of galaxy environments spanning from the general field to the intermedi-ate densities of the A901/2 cluster cores [projected cluster galaxy number density (R < 24) up to ∼1600 gal Mpc−3; Heiderman et al. 2009]1. Therefore, the A901/2
system provides an ideal laboratory within which to explore the effect of the galaxy environment on the observed properties of galaxies and galaxy evolution.
The primary STAGES observations consist of an 80-tileV-band (F606W)Hubble
Space Telescope (HST)/Advanced Camera for Surveys (ACS) mosaic covering the
full 0.5◦ ×0.5◦ span of the multicluster system (see Fig. 2.1). This ACS imaging is complemented by high-precision photometric redshifts and observed-/rest-frame spectral energy distributions (SEDs) from the 17-band COMBO-17 photometric redshift survey (Wolf et al. 2003), as well as extensive multiwavelength observations using the Spitzer Space Telescope, Galaxy Evolution Explorer (GALEX), 2 degree field (2dF),XMM–Newton, and the Giant Metrewave Radio Telescope (GMRT).
The main goal of the STAGES HST/ACS imaging was to obtain morphologies and structural parameters for all cluster galaxies down toR = 24 mag. To address
1
Note: this core density is greater than in the Virgo cluster (∼360 gal Mpc−3
; Binggeli et al. 1987) but lower than in the Coma cluster (∼10 000 gal Mpc−3; The & White 1986). Also note that only order of magnitude comparisons are applicable between the quoted core densities. This is due to differences in the sample selections used by the respective works (i.e. magnitude limits).
Figure 2.1. The STAGES A901/2 field. Top panel: an image of the complete A901/2 field created using colour information (RGB) from the ground-based COMBO-17 survey (Wolf et al. 2003). The cores of the three Abell clusters (A901a, A901b and A902) and the South-West (SW) group are encircled for reference (note: also encircled is A901α– some suspected in-falling substructure related to A901a). Bottom panel: a schematic showing the HST/ACS 80-tile mosaic. Im