Introduction
The monitoring of atmospheric conditions in underground coal mines is an important task that helps mine operators run the ventilation systems in a more efficient manner, therefore ensuring a safe environment for all mine personnel. The layout of the sensors in each mine depends on mine geometry, the design of the ventilation system, the availability of power and communication lines to each sensor location, and other factors. Currently, several real-time monitoring techniques are available that allow mine operators to monitor all vventilation parameters, such as air flow, air vvelocity, pressure drop, and gas concentration at various locations throughout a mine.
Although advances in electronics and data transmission systems have led to progress in this field in recent years, monitoring of atmospheric conditions still presents challenges due to the limitations in current technologies in terms of accuracy, response time, range, sensitivity, and ruggedness of equipment.
In the USA, atmospheric monitoring in underground coal mines is not only mandatory, but systems should be designed and implemented according to existing regulations,i.e., Title 30 of the Code of Federal Regulations (CFR). More specifically, under current atmospheric monitoring system (AMS) regulations (CFR 30 §75.351), data archiving is not required. The regulation states that records must be kept regarding alert or alarm signals, AMS malfunctions, and seven-day tests of alert and alarm signals conducted. The records must note the person that recorded the information, and be kept in a secure book or electronic system that is not susceptible to alteration. These records must be kept for one year at a surface location at the mine and be available for inspection by miners and authorized representatives of the Secretary (CFR 30 §75.351). The required records are limited to alert or alarm signals, malfunctions, system tests, and calibration. Furthermore, in the case of coal mines, the equipment should be ‘permissible’ i.e. it should meet the specifi-cations by the US Mine Safety and Health Administration (MSHA) for the construction and maintenance of such equipment, to assure that it will not cause a mine explosion or mine fire.
Depending on the size and type of the underground mine, atmospheric monitoring should gather data that covers several different parameters that characterize the atmospheric conditions underground, including (but not limited to) concentrations of various gases (CO, CO2, CH4,etc.), wet and dry temperature, humidity, barometric pressure, air flow, fan performance indicators, air velocity, and total air pressure loss.
management system for underground coal
mines
by Z. Agioutantis*, K. Luxbacher
†
, M. Karmis
†
, and S.
Schafrik
†
Synopsis
With increasing demand for real-time monitoring of mine parameters, the requirement for appropriate data management in many mining applications is also increasing. This includes atmospheric monitoring in underground coal and metal mines. Although a number of different (real-time) monitoring systems have been installed in underground mines, they all typically share the same systems or sub-systems, where each sub-system may include both custom hardware and / or software components. In addition, monitoring components installed in underground coal mines in the USA should also be intrinsically safe and approved by the US Mine Safety and Health Administration.
Real-time analysis adds complexity to the system since data validation and storage should be completed independently of filtering, data reduction operations, or visualization. Real-time processing may include statistical evaluation, trending, cross-correlation, and real-time alarm or warning generation.
This paper presents the concept and design of an integrated system under development for atmospheric monitoring in US coal mines.
Keywords
mine ventilation, real-time monitoring, data management.
* University of Kentucky, USA.
† Virginia Center for Coal and Energy Research, Virginia Tech, USA.
© The Southern African Institute of Mining and Metallurgy, 2014. ISSN 2225-6253. This paper was first presented at,A Southern African Silver Anniversary, 2014 SOMP Annual Meeting, 26–30 June 2014, The Maslow Hotel, Sandton, Gauteng.
Proper monitoring becomes even more important in the case of coal mines, where high methane concentrations present a hazard and/or high CO indicates development of a fire. In addition to everyday operations, atmospheric monitoring can be used to detect incidents such as explosions behind seals, a methane ignition at the face, a belt fire,etc. However, it should be noted that atmospheric monitoring sensors commonly used to detect the parameters of interest may be currently limited in response time and sensitivity.
Current monitoring technologies in US coal mines
A simplified layout of a typical system currently installed in US coal mines is shown in Figure 1. Any equipment installed in the mine area should be ‘permissible’. Data transmission is currently accomplished mainly via fibre optic lines using commercial protocols such as ethernet over TCP/IP. Near-sensor communication is often via copper cable to a fibre jjunction box
The stations that provide power and coordinate data transmission to the surface are usually driven by programmable logic controllers (PLCs) that allow ‘smart’ communication between the surface computer(s) and the underground equipment. PLCs can usually report on the status of communications with a sensor, the status of a sensor, and keep track of multiple sensors per station. Power is usually transmitted to sensors via the same cable that gathers data. Data is usually converted from analog to digital at the sensor level and is transmitted as digital information to the surface.
At the surface location, dedicated computer units communicate with the PLCs at mine level and coordinate data flow to a database and a digital display system available to operators (Figure 2). These systems are typically called human-machine interfaces (HMIs) or supervisory control and data acquisition (SCADA) systems. Operators can interface with PLCs through these systems,e.g., acknowledge alarms, start / stop equipment,etc.
▲
Figure 1—Simplified layout of sensor deployment in US coal mines
f
In terms of hardware, such systems typically include three basic component groups: (a) the sensors (and data loggers / converters) responsible for data acquisition, (b) the communication sub-system responsible for transmitting data to a central location, and (c) the processing and storage sub-system, comprising one or more computer units, responsible for data processing and temporary or permanent data storage. In addition, software operating off the processing and storage sub-system is responsible for coordinating data acquisition, vvalidating collected data, visualization, data analysis, and report generation.
Such systems are usually built to comply with MSHA regulations as stated above, and lack advanced data analysis capabilities such as variable cross-correlation, correlation w
with variables external to the database,etc. Furthermore, a typical database system implemented on such systems is configured to store data on a moving 7-day or 14-day w
window,i.e. old data is erased every day.
In some system implementations, data for selected monitored parameters is exported to daily, weekly, or other files for archiving and storage. It is obvious that the data in such files cannot be easily managed and analysed unless it is stored in a common database.
Data management and analysis in mine ventilation is perhaps most heavily utilized in metal and nonmetal mines that have implemented ventilation on demand (VOD). Many of the same management and analysis challenges have been identified, such as the inherent complexity of mine
vventilation systems, and development of robust data collection, storage, and management (e.ggg. Meyer, 2008; Tonnos and Allen, 2008). Additionally, these mines have demonstrated measureable improvements in safety and efficiency through application of such systems (e.ggg., Gundersonet al., 2005; O’Connor, 2008; Karsten and Mackay, 2012) Although VOD is not applicable to
underground coal mines in the USA, due to restrictions in the amount of airflow change allowed while people are
underground (CFR 30 §75.324), the data management and analysis methods developed for application of VOD are certainly applicable.
Database design
A
A relational database application was developed that has built-in data capture and analysis capabilities. This application, called ‘Atmospheric Monitoring Analysis and Database mAnagement’ (or AMANDA), is specifically designed for AMS data. The capabilities of the system are discussed in this section.
Data management of an AMS should ensure that the integrity of historical data is maintained. Underground mines generate a large range of data, and this presents a challenge for the AMS database system, especially with systems that have many sensors reporting a large quantity of data. For instance, assume that each data record corresponding to a single measurement value from a given sensor may require a storage space of about 50 bytes (date-time stamp, tag number, project number, value,etc.). In typical applications, data may be gathered every few seconds. If one data value is sampled every ten seconds, there would be approximately 0.412 MB of data generated per sensor per day. For a mine w
with 20 sensors, approximately 8.2 MB of data is generated
f
daily. One year of data with only 20 sensors corresponds to approximately 3.0 GB. Large mining operations and processing plants may incorporate several hundreds (even thousands) of sensors throughout the operation to control and monitor devices. If a large mining operation deploys 300 sensors and its processing plant utilizes 400 sensors, with a sampling frequency of 10 seconds, those sensors would generate approximately 288 MB daily and 105 GB each year. This estimate does not include other data that can illuminate trends further,e.g., measures of loads on mechanized cutting and hauling equipment, physical locations of people and equipment via tracking technology, and maintenance, surveying, and production data.
Storage of this data presents a set of challenges; those with fairly simple solutions are not discussed in this paper. Management and utilization of the data is critical to the operation. Optimizing the placement of monitoring systems to acquire the most critical information, and transmitting the information to a centralized location with a sophisticated storage method has value only if the data can be understood and utilized by a decision-maker.
The AMANDA data management system has a number of subsystems,e.ggg. for data acquisition; data analysis,
validation, and storage; visualization and reporting of the data; alarm generation; and tools for statistical evaluation and cross-correlation. Thus, the database was designed with the following characteristics:
➤ Deployable on a 64-bit system to allow for large files
➤ Built on a relational database model
➤ Implemented as a client / server system
➤ Allows multiple indexing of the data records to assure a quick response to queries.
In addition, the data management application allows:
➤ Data collection for multiple projects; a project is defined as a collection of sensor data as implemented in a single mine database
➤ A fully parametric definition of the sensor types that will be used in a project. Each parameter measured by a PLC-driven sensor is called a tag; multiple user-defined tags can be defined per project, and a unique sensor type can be assigned per tag
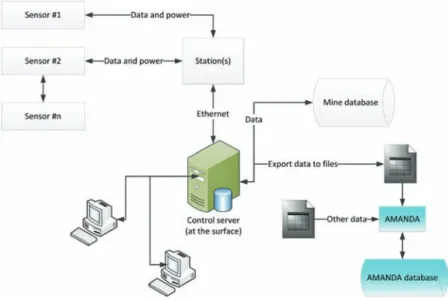
➤ Importing of data files exported by current AMS implementations (Figure 3)
➤ Importing of external data such as barometric pressure or temperature as recorded by weather stations available on the internet (Figure 3)
➤ Identification of missing data
➤ Setting of individual warning and alarm thresholds per tag.
Figure 3 presents a simplified diagram that shows data flow from the sensors to the currently available ‘Mine Database’. AMANDA is external to this data flow and only reads data available by automatic export by the mine system. AMANDA thus cannot directly or indirectly interfere with the installed data acquisition system.
Data from a US coal mine was imported to the database (Griffin, 2013). In this coal mine, multiple methane and CO sensors have been installed, in addition to the usual sensors for fan, belt, and other operations. Data was available in DBF format on a daily basis. More specifically, for every day two files were generated by the existing system: a ‘tag’ file, which
f listed the ‘tags’ or sensors that were monitored, and for w
which data was collected and saved; and the main data file (also in DBF format), which listed the data in columns. Each row represented measurements at a different timestamp. For each ‘tag’ two columns were provided, one with the value read from the sensor and one with the status of the sensor. A typical daily file included 8600 rows (sampling about every 10 seconds) and over 80 columns which correspond to 40 sensors. Prior to data import, a project was defined and the sensors were added to the project. When daily data was imported, each data value and its time stamp were assigned to the corresponding sensor and project.
There was no barometric pressure sensor installed at the mine at that time. Data from a nearby publicly available w
weather station was downloaded and imported into the database into a separate ‘tag’, which was assigned to the external sensor. During importing, data was not altered in any way. Erroneous values (i.e. negative or extreme values) w
were also imported. The user can isolate these values by flagging them, but the raw data is always available for inspection.
Once data has been imported into the relational database, it is easy to select specific data groups for plotting and analysis. The program can plot any of the recorded tags versustime. Data can also be displayed in a continuous mode by displaying a moving window of one or multiple days.
Figure 4 shows an example of ventilation fan motor amperes. The fan motor power consumption varies
throughout daily operation, demonstrating that tracking fan performance can be just as important as monitoring underground gas levels. Fluctuations in the fan motor amperes can be due to the motor efficiency, outside temperature, air density, movement in mine openings, and a w
wide variety of other factors. Monitoring fan performance can also help the mine operator understand if changes in gas concentrations are related to fan performance. Fan
performance is an example of a variable that can contribute to changes in gas concentration and must be analysed with other data to allow for the emergence of critical trends.
f
Figures 5a and 5b show examples of superimposed data collected by two methane sensors (right axis, methane concentration in per cent) at two different mine locations on return airways (green and blue curves) and the surface barometric pressure (left axis, inches Hg). It can be seen that sudden decreases in the barometric pressure coincide with an immediate increase in the methane percentage in these two locations. The horizontal axis corresponds to a time period of 7 days.
Although, the correlation of barometric pressure and methane concentration has been cited several times (Fauconnier, 1992; Lloyd and Cook 2004), with the new database management system this simple correlation by superposition was very easily accomplished.
▲
Figure 3—Data flow to the mine database and to the AMANDA database
Figure 4—Monitoring of the electrical current on a fan motor over a three-day period
Summary and conclusions
A new database management system was developed in order to facilitate the massive undertaking of maintaining, storing, reviewing, analysing, and interpreting large amounts of data generated daily by sensors installed in underground coal mines. The database is capable of handling multiple projects and multiple sensor sets per project. Data can also be imported from external sources.
In terms of application development, current work is focusing on identifying and analysing peaks (or spikes) in a given time-series. While it is easy to visually identify peaks in a short time window, there is a need to formalize peak detection to determine whether these peaks correspond to significant increases or decreases.
In terms of data analysis, the next step would be to correlate other collected parameters with each other, such as production and methane emissions, fan performance and barometric pressure or daily temperature variation,etc. This is a primary, but complex function; this data may be utilized to better characterize the behaviour of a mine environment, w
which is a complex engineered system. This includes determining and verifying causality (e.ggg. falling barometric pressure, malfunctioning fan, increased production) when a parameter trends in an alarming manner (e.ggg. rising methane concentrations), so that high-risk situations can be
remediated.
The importance of the human interface will be also examined. The most advanced human-computer interfaces in mining have generally been directed toward the stationary operator, or a person who has oversight of all the sensors in a mine. While communication via these interfaces is essential, and has led to improved safety and efficiency, many mine personnel do not have access to data that can allow them to better assess situations and make more informed decisions. The challenge is to design technology that is portable, rugged, and safe for use in underground coal mines, and to design software that rapidly conveys emerging data trends to mine personnel. These trends should allow personnel to anticipate system failure (e.g., ventilation, ground, equipment) or to verify safe conditions. An interface
f f f
for the AMANDA software will be developed and assessed for ease of use, knowledge gains to the user, and speed of information uptake.
Implementation of advanced monitoring and analysis systems in mines is challenging due to the dynamic nature and unique attributes of any single mine, but the gains in health and safety as a result of more informed decision-making are well worth the investment in resources and technology.
References
FAUCONNIER, C.J. 1992. Fluctuations in barometric pressure as a contributory
factor to gas explosions in South African mines.Journal of the South African Institute of Mining and Metallurgy, vol. 92, no. 5. pp. 131–147.
GRIFFIN, K.R. 2013. Utilization and Implementation of Atmospheric Monitoring
Systems in United States Underground Coal Mines and Application of Risk Assessment. Doctoral dissertation. Virginia Tech, Blacksburg, VA.
GUNDERSON, R.E., VONGLEHN, F.H., and WWWILSON, R.W. 2005. Improving the
efficiency of mine ventilation and cooling systems through active control. 8th International Mine Ventilation Congress, Brisbane, Queensland, 6–8 July 2005. Gillies, A.D.S. (ed.). Australasian Institute of Mining and Metallurgy, Carlton, Victoria. 6 pp.
KARSTEN
K
K , M. and MACKAY, L. 2012. Underground environmental challenges in deep platinum mining and some suggested solutions.Platinum 2012, 5th International Platinum Conference – ‘A Catalyst for Change’, Sun City, South Africa, 18–20 September 2012. Southern African Institute of Mining and Metallurgy, Johannesburg. pp. 177-192.
LLOYD, P.J.D. and COOK, A. 2004. Methane release from South African coal mines.Journal of the South African Institute of Mining and Metallurgy, vol. 105, no. 8. pp. 483–490.
MEYER, M.A. 2008. Implementing a tracking and ventilation control system at
Barrick Goldstrike’s underground division.12th U.S./North American Mine Ventilation Symposium, Reno, Nevada, 9–11 June 2008. Wallace, K. (ed.). Society for Mining, Metallurgy & Exploration, Englewood, CO. pp. 13–18.
O’CONNOR, D.F. 2008. Ventilation on demand (VOD) auxiliary fan project – Vale
Inco Limited, Creighton Mine.12th U.S./North American Mine Ventilation Symposium, Reno, Nevada, 9–11 June 2008. Wallace, K. (ed.). Society for Mining, Metallurgy & Exploration, Englewood, CO. pp. 41–44.
TONNOS, A.M. and ALLEN, C. 2008. Technology convergence for sustainable
underground mine ventilation system control.12th U.S./North American Mine Ventilation Symposium. Reno, Nevada, 9–11 June 2008 Wallace, K. (ed.). Society for Mining, Metallurgy & Exploration, Englewood, CO. pp. 37–40.
US Department of Labor, Mine Safety and Health Administration. 2014. Title 30, Code of Federal Regulations, Parts 1-199, Mineral Resources. http://www.msha.gov/30cfr/75.0.htm#.U16F6fldVTx.