THE DIVERSITY STUDY OF
ENGLAND AND WALES 2020
How
we
get
Dr Julian Hargreaves
Senior Research Fellow at the Woolf Institute, Lead Researcher and Lead Author.
Dr Edward Kessler MBE
Founder Director of the Woolf Institute and Principal Investigator.
David Izamoje
Methodology and Statistical Analyst at Survation.
Alissa Symon
Research Assistant at the Woolf Institute.
The full report is available as a free download at: www.woolf.cam.ac.uk/diversity
It is common to read in the media that our increasingly diverse society – particularly its ethnic, national and religious diversity – is becoming polarised and divided. This, it is feared, will lead to further marginalisation and prejudice.
The Government has reacted by developing a range of policies and interventions designed to tackle polarisation and its consequences and to foster better relations between
diverse groups. Such interventions require significant amounts of money, time and human resource. In a time of pressures on finances and public services, local and national governments
need to know whether or not the interventions they are funding are successful.
The Woolf Institute, which seeks to improve the relationship between religion and society through education, addressed the issues raised by these concerns and conducted a major two-year study. This included the examination of relevant existing research, surveying the views of more than 11,000 adults in England and Wales and undertaking interviews. We collected the data needed to understand how people perceive and experience diversity in their neighbourhoods, towns and cities and how this compared to an overall national picture. Our analysis is focused on personal, not institutional, attitudes towards diversity – in sum, what divides and what unites us.
We are encouraged by the extent of interest The Diversity Study of England and Wales 2020 has generated at local authority, regional and national levels. We would like to express our gratitude to everyone who contributed to this study, both individuals and organisations.
There has been general agreement that, in today’s society, it is essential not only to take
diversity seriously, but also to reflect on the significance of how we view one another. Indeed,
it is only with such an understanding that we learn how to get on together.
We believe this is an important report and ask that its findings, which takes into
account an extensive range of different views, be widely considered across the political
spectrum by policymakers, government officials, religious and community leaders and the wider
public.
We commend it to you.
Preface
Shabir Randeree CBE
Chair of the Board of Trustees
Woolf Institute
Dr Edward Kessler MBE
Founder Director
Introduction
What do we think of our neighbours? And what do they think of us? When it comes to race, religion and immigration, what divides us and what brings us together? Do we all share the same experiences of the diverse everyday world around us? Or is diversity something other people do? These are some of the questions that motivated the Woolf Institute to produce
How We Get Along: The Diversity Study of England and Wales 2020.
But they were not our only motivations. We wanted to address regular media reports of increasing polarisation and fragmentation of British society. Are these concerning depictions of us supported or challenged by large-scale data? Is there, in fact, more to unite us on issues of
diversity than we might assume? And if so, how might public policy reflect this? We also wanted
to address the lack of available evidence on diversity, integration and cohesion. In doing so, our
study fills some of the knowledge gaps identified by the 2016 Casey Review and by many others
since.
The Diversity Study of England and Wales 2020 has surveyed, mapped, measured and analysed attitudes and experiences relating to diversity across England and Wales. We worked closely with Survation, a leading market research company, and surveyed 11,701 adults throughout England and Wales. We asked respondents about their attitudes towards diversity in British society as a whole and within their local communities. We asked questions about the pace of change. To bring these issues closer to home, we invited respondents to share their attitudes towards a close relative marrying someone from a different background. We also explored our lived experiences of diversity both at work and among friendship groups.
We recognise that issues concerning diversity are complex and sensitive. Accordingly,
we created a research design that reflects this complexity, the richness of the data and the
regional differences across England and Wales. Similarly, we have taken care to present our
findings and recommendations clearly and compassionately. To reach our conclusions, we
have explored an array of factors that shape attitudes and experiences. The in-depth analysis presented in this report considers sex/gender, age, ethnicity and religion, location of residence and local levels of diversity, alongside education, employment, income and voting behaviour. To illustrate some of our main themes, we conducted a series of in-depth interviews.
Dr Julian Hargreaves
Senior Research Fellow
Woolf Institute
How We Get Along provides the granular evidence requested by many, as well as the information required to better inform national, regional and local policymaking. We are delighted to make our work available for use by the UK Government, the Welsh Senedd, local and combined authorities and city mayors.
To help enhance and complement current debates around institutional and structural forms of racism, we placed our focus on relations between everyday people. In doing so, we hope to transcend some of the political tribalism that we believe has hindered previous debates
in this field.
The report provides evidence that, far from being divided and highly polarised, there is an emerging national consensus that diversity is good for our country, but that the pace of change has been too fast. It also suggests that while racism and xenophobia by individuals may be in decline, negative attitudes towards diversity based on religion, especially Islam, are still widely held.
The findings suggest that friendships and workplaces have a vital role to play in bringing
people together. Changing work and life patterns as a result of coronavirus may require new local, regional and national approaches by policymakers to help us get along better in the future.
As you will read, some of our findings present a hopeful vision of British society, a place of diversity and inclusion to celebrate and cherish. Other findings suggest that, as a nation, we
Diversity
There is a national consensus that diversity is good for British society– we get along. Importantly, positive attitudes towards diversity are common between majority and minority groups. For example, there were no differences between White and Asian respondents in respect of attitudes towards ethnic diversity in British society, nor is there divergence amongst religious believers with respect to migrants and local communities.
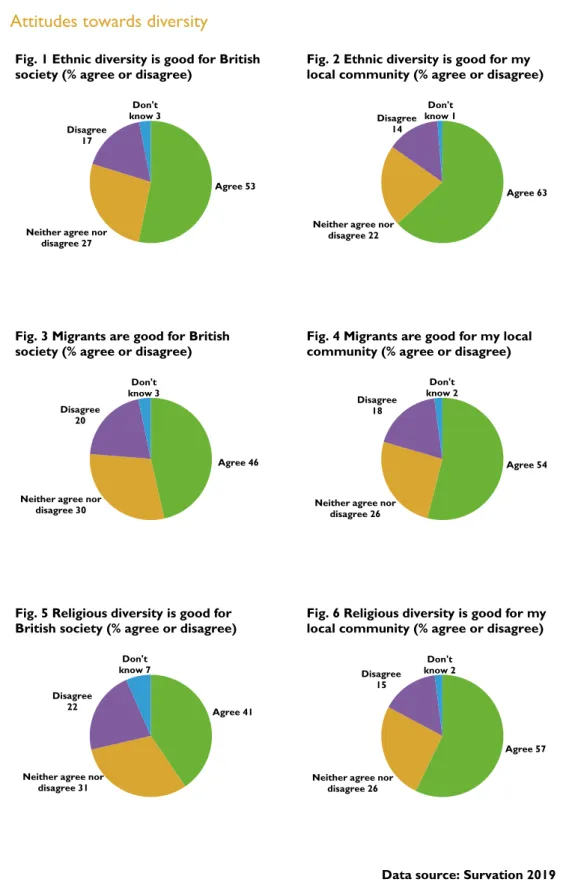
• Most people (53%) in England and Wales agree that ethnic diversity is good for British society. Around a fifth (17%) disagree.Those who agree outnumber those who disagree by 3 to 1.
• Just under a half (46%) agree that migrants are good for British society. A fifth (20%)
disagree. Those who agree outnumber those who disagree by over 2 to 1.
• 41% agree that religious diversity is good for British society. Nearly a quarter (22%) disagree. Religious diversity is less popular than ethnic and national diversity, but those who agree still outnumber those who disagree by nearly 2 to 1.
Despite widespread positive attitudes towards diversity, we found regional differences.
• Compared to people living in London, people in the North and East of England and in Wales tended to be less positive about diversity.
Attitudes towards diversity
Fig. 1 Ethnic diversity is good for British society (% agree or disagree)
Fig. 3 Migrants are good for British society (% agree or disagree)
Fig. 5 Religious diversity is good for British society (% agree or disagree)
Fig. 2 Ethnic diversity is good for my local community (% agree or disagree)
Fig. 4 Migrants are good for my local community (% agree or disagree)
Fig. 6 Religious diversity is good for my local community (% agree or disagree)
Data source: Survation 2019
Agree 53 Neither agree nor
disagree 27 Disagree 17 Don't know 3 Agree 46 Neither agree nor
disagree 30 Disagree 20 Don't know 3 Agree 41
Neither agree nor disagree 31 Disagree 22 Don't know 7 Agree 63 Neither agree nor
disagree 22 Disagree 14 Don't know 1 Agree 54 Neither agree nor
disagree 26 Disagree 18 Don't know 2 Agree 57 Neither agree nor
disagree 26 Disagree
15
Don't know 2
Change
Despite positive attitudes towards diversity, many people across England and Wales appear to be uncomfortable with the pace of national and local change. There is an emerging consensus that for many it has been too quick.
• Almost two thirds of people (60%) in England and Wales agree that the number of
migrants in Britain has increased too quickly in the past 10 years. 17% disagree. Those who agree outnumber those who disagree by over 3 to 1.
• Half (exactly 50%) agree that ethnic diversity in Britain has increased too quickly in the last 10 years. 21% disagree. Those who agree outnumber those who disagree by over 2 to 1.
• 43% of respondents agree that religious diversity in Britain has increased too quickly in the past 10 years. 19% disagree. Those who agree outnumber those who disagree by over 2 to 1.
• 54% of those who perceive their community to be nationally diverse agree that the number of migrants has increased too quickly. 22% disagree. Those who agree outnumber those who disagree by over 2 to 1.
Attitudes towards change
Fig. 7 Ethnic diversity in Britain has increased too quickly in the past 10 years (% agree or disagree)
Fig. 9 The no. of migrants in Britain has increased too quickly in the past 10 years (% agree or disagree)
Fig. 11 Religious diversity in Britain has increased too quickly in the past 10 years (% agree or disagree)
Fig. 8 Ethnic diversity in my local community has increased too quickly in the past 10 years (% agree or disagree)
Fig. 10 The no. of migrants in my local community has increased too quickly in the past 10 years (% agree or disagree)
Fig. 12 Religious diversity in my local community has increased too quickly in the past 10 years (% agree or disagree)
Data source: Survation 2019 Agree 50
Neither agree nor disagree 25 Disagree 21 Don't know 4 Agree 60 Neither agree nor
disagree 20 Disagree 17 Don't know 4 Agree 43
Neither agree nor disagree 29 Disagree 19 Don't know 9 Agree 44
Neither agree nor disagree 25 Disagree 27 Don't know 4 Agree 54 Neither agree nor
disagree 21 Disagree 22 Don't know 4 Agree 44
Neither agree nor disagree 27
Disagree 25
Don't know 4
Marriage
We are a society largely comfortable with the idea of a close relative marrying someone from a different ethnic or national background. This is often seen in social science circles as a proxy for the acceptance of diversity.
We are, however, less comfortable with a close relative marrying someone from a different religious background. This particularly applies to marrying a Muslim, the group most often targeted by negative attitudes from other faith groups, but also the group most likely to have negative attitudes towards other faith groups.
Religious prejudice, rather than racism or xenophobia, is the “final frontier” for
diversity, a place where individuals are willing to express negative attitudes.
• Around three quarters of us are comfortable with a close relative marrying an Asian or Black person (70% and 74%).
• Less than half (44%) are comfortable with the idea of a close relative marrying a Muslim.
• The word “Muslim” appears to trigger more negative sentiment than the word “Pakistani”. Given the vast majority of British Pakistani people are Muslim, we would expect feelings towards both groups to be broadly similar. However, feelings towards a close relative marrying a Muslim person appear to be more negative than those towards a Pakistani person.
• Attitudes between faith groups are more negative than between ethnic and national groups. The strongest negative attitudes towards marrying someone from another background are observed when we group the survey respondents by religion.
• Despite the evidence of uncomfortable marriage feelings between faith groups, our interviews suggest that attitudes within minority faith communities are far from static.
On the contrary, they are undergoing significant generational shifts. In particular, British
Attitudes towards a close relative marrying someone from a different background
The heatmaps below report attitudes at the local authority level towards a close relative marrying someone from a different ethnic, national or religious background. Green tones indicate positive attitudes, red tones indicate negative attitudes and tones in between represent weaker sentiment or ambivalence.
Fig. 13 A Black person
(Question asked to non-Black respondents)
Fig. 15 A Pakistani person
(Question asked to non-Pakistani respondents)
Fig. 14 An Asian person
(Question asked to non-Asian respondents)
Fig. 16 A Muslim person
(Question asked to non-Muslim respondents) 0 = No respondents comfortable (0% comfortable) 100 = All respondents comfortable (100% comfortable)
Friendship
Diverse friendships are the norm in British society. Our findings reveal that large
majorities of the public enjoy friendships that are ethnically, nationally or religiously diverse. Previous studies have shown that having diverse friends impacts more forcefully on our prejudices than our prejudice does on our choice of friends.
When it comes to tackling prejudice, friendship matters and works.
• 87% of respondents who told us they are religious have friendships with people from other faith backgrounds.
• Three quarters (76%) of respondents stated they have at least one friend from a
different ethnic background.
• Over two thirds (69%) of British respondents reported having non-British friends. • All ethnic groups are equally likely to have ethnically diverse friendships. All faith groups
equally likely to have religiously diverse friendships.
• We found little evidence supporting stereotypes that Jewish and Muslim people only mix with their own.
Again, despite the largely positive overall picture, we found regional differences.
• People in the North West are the least likely to have ethnically diverse friendships. Compared to people living in London, and after taking into account differing levels of diversity, they are 54% more likely to have friends only from the same ethnic background.
• People in the North East are the least likely to have any non-British friends. Compared to people living in London, people there are over twice as likely to have only British friends.
Workplace
Most workplaces are diverse. They provide opportunities for integration and meeting points to create shared goals, break down stereotypes and foster positive attitudes towards one another. Those without work are up to twice as likely to have no friends outside their own ethnic, national and religious groups. Our analysis suggests that workers are a “safe bet” for integration and cohesion strategies.
• Three quarters of all workers in England and Wales (76%), regardless of ethnicity, work
in a setting that is ethnically diverse.
• Three quarters of workers born in the UK (75%), and three quarters of those who described their ethnicity as British (75%), work with non-British workers.
• Over three quarters of all workers in England and Wales who self-described as religious (81%) work in settings that are religiously diverse.
Our research also examined people in non-diverse workplaces and “workplace solos” (people who are the only representative of their ethnic, national or religious group at work):
• In terms of non-diverse workplaces, 1 in 5 White workers work with no other ethnic groups. They are the ethnic group most likely to do so.
• British Asian workers are the minority group most likely to work in non-diverse places – 1 in 12 (8%) work only with other Asian workers.
• In terms of “workplace solos”, 1 in 5 British Asian workers work with no other people from their own ethnic background. Over a third of people who described their ethnicity as Mixed work as “solos”.
• 1 in 8 Muslim workers are “workplace solos”, as are around 1 in 5 from the other minority faith groups (Hindus, Jews and Sikhs).
Again, our data revealed regional differences.
• Workers in the North East, North West and Wales are 70% more likely than those in London to work only with British colleagues.
The findings from this report suggest several important policy considerations:
• Despite public concern and media narratives that our country is increasingly polarised, there is an emerging national consensus that diversity is good for Britain, but
the pace of change has been too fast for many. Our findings suggest that
“pro-diversity” and “pro-immigration control” positions are neither contradictory nor irreconcilable. The existence of an emerging consensus on both diversity and change offers policymakers opportunities for coalitions and broader appeal. They should seek
to build on this finding when considering issues such as equality and immigration. • Regional variations in attitudes to diversity suggest the need for an even more
devolved, regional approach to integration and cohesion policymaking,
including the increased use of local consultations. This means giving more
attention to regional difference and allowing local and regional government more responsibilities and discretion to manage diversity.
• Friendship should occupy a more prominent role in policymaking, with
friendships between people from different backgrounds more actively encouraged and supported.
• Building on the above, there should be a shift in the focus in workplaces tackling inequality towards promoting diversity. Policymakers and employers should consider “workplace solos” more often. More broadly, all workers are a “safe bet” for integration and cohesion strategies. As potential “ambassadors” of their own ethnic, national or religious group, they are well-placed to challenge stereotypes and establish new norms of social mixing.
DIVERSITY
IN A NUTSHELL
To help build our understanding of diversity in England and Wales, we asked respondents to our nationwide survey a series of questions concerning their attitudes towards ethnic, national and religious diversity. In particular, we asked whether diversity is good for British society and whether it is good, or would be good, for their local community. Our analysis revealed positive attitudes towards ethnic, national and religious diversity.
Most respondents (53%) agreed or strongly agreed that ethnic diversity is good for British society (see Table 1 and Fig. 1). Overall, more than twice as many respondents agreed as disagreed (17%).
Just under half (46%) agreed that migrants are good for British society (see Table 2 and Fig. 3). Again, more than twice as many agreed as disagreed (20%).
41% agreed that religious diversity is good for British society (see Table 3 and Fig. 5). Nearly twice as many agreed as disagreed (22%).
Women appear to be more positive towards diversity. For example, female respondents were 31% less likely to be negative towards ethnic diversity than male respondents and 30% less likely to be negative towards religious diversity (see Tables 13 and 15).
Where respondents agreed that their local communities were diverse (see Tables 4-6), attitudes towards diversity tended to be positive (see Tables 7-9 and Figs. 2, 4 and 6). Attitudes were more mixed and less positive among respondents in communities perceived as being less diverse (see Tables 10-12). Several factors appear to drive negative feelings towards national and local diversity. These include: being male; being older; disagreeing that your local community is diverse; living in a region outside London; having no qualifications or qualifications other than a degree; and voting behaviour in the 2016 EU Referendum and 2017 General Election (see Tables 13-21). Our findings in relation to positive attitudes towards diversity underpinned several policy recommendations reported towards the end of this report.
WHAT WE KNOW SO FAR
The body of academic literature concerning diversity is vast. The term “diversity” has been applied in multiple academic contexts, each representing significant sub-fields of academic study. One suitable starting point suggested by the existing literature, as used in this report and many others, is Robert Putnam’s influential 2006 lecture, E Pluribus Unum (“out of many, one”).
Putnam introduced the concepts of “contact” and “threat” (in essence, positive and negative consequences of diversity) and “bonding” and “bridging” (in essence, the distinction between communities looking inwards or outwards towards other ethnic, national and religious groups). The methods and findings reported below are all situated within a framework suggested by Putnam’s lecture and subsequent work influenced by it.
The study of immigration is central to the study of diversity in the UK, particularly where research focuses on relations between people and groups from different ethnic, national and religious backgrounds. A review of recent statistical studies revealed a mixed picture in the UK, defying a simple overall conclusion about the British public’s attitudes towards immigration and migrants.
Research is often politically motivated: some studies emphasise the positive consequences of contact between ethnic, national and religious groups; others focus on the negative attitudes directed towards minority groups.
We chose to adopt a more neutral, less political approach to diversity. The findings and analysis we present below, and throughout our report, offer both positive and negative attitudes.
WHAT WE DID
We conducted a nationally-representative survey of 11,701 adults throughout England and Wales. Respondents were asked a series of questions relating to attitudes towards diversity. Respondents were asked three questions on whether ethnic, national and religious diversity is good for British society. Respondents who agreed that their local community is diverse (ethnically, nationally or religious) were asked three questions on whether such diversity is good for it. Respondents who disagreed that there local community is diverse were asked whether ethnic, national or religious diversity would be good for it.
We explored the data using a variety of methods. We used basic statistical techniques to establish an overall picture of attitudes towards national and local diversity. Known as bivariate analysis, such techniques focus on two factors at a time (such as attitudes to diversity and ethnicity). We also used more advanced techniques to offer more in-depth analysis. Known as multivariate analysis, such techniques, including statistical modelling, consider multiple factors simultaneously. We grouped together the respondents who reported negative attitudes towards national and local diversity. Statistical modelling was used to determine which, if any, of the other factors (sex/gender1,
age, ethnicity, religion, etc.) predicted negative attitudes towards diversity. As you will read, several did.
Measuring diversity
We adopted two approaches to describing local levels of diversity: a subjective measure and an objective measure. The subjective measure was based on whether respondents agreed that their local community is diverse (i.e. whether they perceived it to be diverse). The objective measure used data based on estimated updates from the Census to group local authorities depending on ethnic, national and religious diversity.
Simply put, we grouped local authorities into one of ten groups depending on how diverse they are (in effect, ten tiers of diversity). We formed three sets of these groupings; one each for ethnic, national and religious diversity. Ethnic diversity was measured using the proportion of non-White residents in each local authority. National diversity was measured using the proportion of residents born outside the UK. Religious diversity was measured using the proportion of residents from minority faith backgrounds. In sum, we created two diversity measures: perceived diversity and actual diversity.
Research questions
To what extent may we describe attitudes towards national and local diversity in England and Wales as positive or negative?
To what extent do attitudes towards national diversity differ to those towards local diversity?
To what extent do attitudes towards local diversity differ between those who do and do not perceive their local community to be ethnically, nationally or religiously diverse?
To what extent do demographic and socio-economic factors, including actual levels of diversity, predict the likelihood that a person will have negative attitudes towards national and local diversity?
WHAT WE FOUND
A more detailed look at our findings
BASIC ANALYSIS
DIVERSITY AT THE NATIONAL LEVEL
As for all the survey responses reported in our study, many people felt unable or unwilling to offer definitive agreement or disagreement on the national benefits of diversity, or else had no view, or were not confident or comfortable in expressing a view. This is a reminder of the sensitivities around these topics and people’s willingness to discuss them.
Despite this, most people are positive towards ethnic diversity in Britain (see Table 1). Just under half (46%) agreed that migrants are good for British society (see Table 2). 41% agreed that religious diversity is good for British society (see Table 3, see also Figs. 1, 3 and 5)).
Despite the purported toxicity of public debates around migrants and immigration, more people are positive towards migrants than religious diversity.
If we were to establish a hierarchy of national diversity across our three chosen dimensions (from most popular to least), religious diversity would be at the bottom.
Most respondents (53%, see Table 1) either agreed or strongly agreed that ethnic diversity is good for British society. The response “agree” was the most popular (33% selected it as a response). Whilst reported levels of ambivalence and uncertainty were high (30% neither agreed nor disagreed or else answered “don’t know”), nearly three times as many people agreed than disagreed (53% as compared to 17%). Even if all of those who answered “neither agree nor disagree” used the response to mask negative attitudes, the group agreeing would still have outnumbered all those who disagreed.
Just under a majority of respondents (46%, see Table 2) agreed that migrants are good for British society. Over twice as many agreed than disagreed (20%). 1 in 3 expressed either ambivalence or uncertainty (33%).
From the three questions concerning diversity in British society, the question on religious diversity generated the highest levels of ambivalence and uncertainty: just over 1 in 3 (38%, see Table 3) answered “neither agree nor disagree or “don’t know”. It also produced the least positive attitudes: 41% agreed religious diversity is good for British society (compared to 23% who disagreed).
DIVERSITY AT THE LOCAL LEVEL IN DIVERSE COMMUNITIES
Most people perceive themselves to live in ethnically and nationally diverse communities. Fewer perceive themselves to live in religiously diverse communities (see Tables 4-6, see also Figs. 2, 4 and 6).
Attitudes towards diversity at the local level among people who consider their local community to be diverse are very positive. People with positive attitudes outnumber those with negative attitudes by 3 to 1 or more.
Moreover, compared to attitudes towards national diversity, people were more inclined to express agreement or disagreement about the benefits of local diversity. Respondents were more likely to have an opinion, or more comfortable expressing it.
Most respondents perceived their local community to be ethnically diverse (53%, see Table 4). A similar proportion perceived their local community to be nationally diverse (54%, see Table 5). Fewer perceived their local community to be religiously diverse (39%, see Table 6).
From those who perceived their local community to be ethnically diverse, nearly two thirds (63%, see Table 7) agreed that ethnic diversity was good for their local community; over four times as many as disagreed (14% as compared to 63%). Further, there was less reported ambivalence and uncertainty than for questions concerning whether ethnic diversity is good for British society (23% as compared to 30%, see Table 1).
From those perceiving themselves to live in a nationally diverse local community, most respondents (54%, see Table 8) agreed that migrants are good for it; exactly three times agreed than disagreed (54% compared to 18%). Ambivalence and uncertainty were higher than for ethnic diversity, though the difference was not large (28% compared to 23%).
From those who considered their local community to be religiously diverse, most respondents (57%, see Table 9) agreed that such diversity was good for it; nearly three times as many as disagreed (15% as compared to 57%). Levels of ambivalence and uncertainty were similar to those reported in relation to local attitudes towards migrants (28% answered “neither agree nor disagree” or “don’t know”).
DIVERSITY AT THE LOCAL LEVEL IN NON-DIVERSE COMMUNITIES
Overall, attitudes to diversity among people perceiving themselves to live in non-diverse local communities are more mixed and less positive (see Tables 10-12).
Further, more people in these areas are either unable or unwilling to express definitive agreement or disagreement, or have no view, or are otherwise less comfortable or confident in expressing how they feel.
Levels of ambivalence and uncertainty were the highest for these questions as compared to the others reported in this chapter. Whilst not revealed by the data, this could reflect the fact that more respondents were unable or unwilling to express definitive agreement or disagreement. Perhaps these respondents had no view or no desire to express one or were otherwise masking more negative sentiment. Whatever the motivation, for ethnic, national and religious diversity, 44%, 48% and 53% (respectively) answered “neither agree nor disagree” or “don’t know”.
From those who expressed an opinion, 33% agreed that ethnic diversity would be good for their local community (compared to 23% who disagreed). 24% agreed that migrants would be good for it (compared to 27% who disagreed). 22% agreed that religious diversity would be good for it (compared to 25% who disagreed). (See Tables 10-12.)
ADVANCED ANALYSIS
Logistic regression modellingA. ATTITUDES TOWARDS DIVERSITY IN BRITISH SOCIETY
1. ATTITUDES TOWARDS ETHNIC DIVERSITY IN BRITISH SOCIETY (see Table 13)
We analysed data responses from respondents who either disagreed or strongly disagreed with the statement “ethnic diversity is good for British society”, here referred to as being negative towards diversity in Britain.
Sex/Gender
Women appear to be more positive towards ethnic diversity in Britain than men. Female respondents were 31% less likely to be negative towards ethnic diversity than men (our reference category).
Age
Older people appear to be more negative towards ethnic diversity in Britain. Compared to 18 to 24 year olds (our reference category), being in one of the age categories over 45 (i.e. 45 to 54, 55 to 64, 65 to 74 and 75 and over made it twice as likely to be negative towards ethnic diversity in Britain (i.e. increases in likelihood by factors of 2, 2, 2.2 and 1.9 respectively).
Ethnicity
White and Asian people appear to share the same views about ethnic diversity in Britain. Whilst there were no differences between White and Asian respondents, or between White and Mixed respondents, respondents in the Other ethnic group (which included respondents who self-described as Black) were half as likely as White respondents to be negative towards ethnic diversity in Britain (51% less likely).
Religion
Compared to respondents in the No religion (our reference category), respondents in the Other religion group were 32% less likely to be negative towards ethnic diversity in Britain.
Perceived diversity
Respondents who agreed that their local community is ethnically diverse were less likely to be negative towards ethnic diversity in Britain.
Compared to those who disagreed (our reference category), agreeing made it half as likely to be negative (45% less likely).
Actual diversity
Conversely, respondents who lived in local communities with more actual diversity (rather than perceived diversity) were more likely to be negative towards ethnic diversity in Britain. Compared to living in a local authority with low levels of ethnic diversity (our reference category), living in local authorities with the highest proportions of BAME population doubled the likelihood of being negative towards ethnic diversity. We observed an increase in likelihood by factors of 2.3 and 2.1 for groups of local authorities with the largest and second largest BAME populations by proportion.
Region
Compared to living in London (our reference category), living in Wales doubled the likelihood of being negative towards ethnic diversity in Britain (see Fig. 7). Living in the North East, the East of England, the North West or South West increased the likelihood of being negative towards ethnic diversity by a factor of 50% or more (88%, 63%, 50% and 45% more likely respectively).
Education
People with university degrees appear to be more positive about ethnic diversity in Britain. Compared to those with degrees (our reference category), those with qualifications other than degrees and those with no qualifications were around a third more likely to be negative (44% and 32% more likely respectively).
Voting behaviour
Remain, Labour and Liberal Democrat voters appear to be more positive towards ethnic diversity in Britain. Compared to voting Leave (our reference category), respondents who voted Remain in 2016 were 76% less likely to be negative towards ethnic diversity in Britain. Those who voted either Labour or Liberal Democrat at the 2017 General Election were around half as likely (48% and 46% less likely respectively).
Other factors that predicted negative attitudes towards ethnic diversity in British society (altering the likelihood by 20% or less)
Respondents from minority faith backgrounds (religious, non-Christian respondents) were more likely to be negative towards ethnic diversity, although the difference was not large. Compared to respondents in the No religion group (our reference category), those in
Factors that had no effect on predicting negative attitudes towards ethnic diversity in British society
Living in a rural area, employment and income had no effect in predicting being negative towards ethnic diversity in British society.
2. NEGATIVE ATTITUDES TOWARDS MIGRANTS IN BRITISH SOCIETY (see Table 14)
Ethnicity
White and Asian people appear to have the same attitudes towards migrants in Britain.
Compared to White respondents (our reference category), belonging to the Other ethnic group (which included Black respondents) made it half as likely to be negative towards migrants in Britain (58% less likely). There were no differences between the Asian and Mixed groups when compared individually to the White group.
Perceived diversity
People who perceive their local community to be diverse are more positive towards migrants in Britain. Compared to those who disagreed (our reference category), respondents who agreed that their area is nationally diverse were around a third less likely to be negative towards migrants in Britain (31% less likely).
Actual diversity
People living in communities with more migrants appear to hold more negative attitudes towards them. Respondents living in one of the groups of local authorities with higher proportions of residents born outside the UK were more likely to be negative towards migrants in Britain (53%, 56%, 55% and 80% more likely).
Region
People living outside London appear to be more negative towards migrants in Britain (see Fig. 8). Compared to living in London (our reference category) and having taken into account both perceived and actual levels of local diversity, living in several regions doubled, or nearly doubled, the likelihood of being negative towards migrants in Britain. Such regions included: Wales, the North East, the North West, the West Midlands and the East Midlands (and increases in likelihood by factors of 2.6, 2.5, 2.1, 2 and 1.9 respectively).
Education
People with university degrees appear to be more positive towards migrants in Britain.
Compared to those with degrees (our reference category), those with qualifications other than a degree and those with no qualifications were more likely to be negative towards migrants in Britain (57% and 35% more likely).
Income
Lower earners appear to be more negative towards migrants in Britain. Compared to the highest earners (our reference category), earning less than £20,000 made it 30% more likely to be negative towards migrants in Britain.
Voting behaviour
Remain, Labour and Liberal Democrat voters appear more positive towards migrants in Britain. Compared to voting Leave (our reference category), respondents who voted Remain in 2016 were 75% less likely to be negative towards ethnic diversity in Britain than those voting Leave (our reference category). Those who voted either Labour or Liberal Democrat at the 2017 General Election were between a third and a half as likely (34% and 59% less likely respectively).
Other factors that predicted negative attitudes towards migrants in British society (altering the likelihood by 20% or less)
Female respondents were 14% less likely to be negative towards migrants in Britain. Compared to respondents in the No religion group (our reference category), Christian respondents were 12% less likely to negative towards migrants in Britain.
Factors that had no effect on predicting negative attitudes towards migrants in British society
Age, living in a rural location and employment had no effect on predicting negative attitudes towards migrants in Britain.
3. NEGATIVE ATTITUDES TOWARDS RELIGIOUS DIVERSITY IN BRITISH SOCIETY (see Table 15)
Sex/Gender
Women appear to be more positive towards religious diversity in Britain. Female respondents were 30% less likely to be negative toward religious diversity than male respondents (our reference category).
Older people appear to be more negative about religious diversity in Britain. Compared to being 18 to 24 (our reference category), being in either the 45-54 or the 55-64 age category increased the likelihood of being negative towards religious diversity in Britain (by 40% and 41% more likely).
Ethnicity
Minority ethnic groups appear to be more positive towards religious diversity in Britain.
Compared to White respondents (our reference category), Asian respondents and those in the Mixed ethnic group were half as likely to be negative towards religious diversity in Britain (58% and 42% less likely).
Religion
Religious people are more positive about religious diversity in Britain. Compared to being in the No religion (our reference category), being Christian and being in the Other religion group (respondents from non-Muslim minority faith backgrounds) reduced the likelihood of being negative towards religious diversity (by 21% and 42% respectively).
Perceived diversity
People who perceive their local community to be diverse are more positive towards religious diversity in Britain. Compared to those who disagreed (our reference category), respondents who agreed that their local community is religiously diverse were a third less likely to be negative toward religious diversity in Britain (38% less likely).
Actual diversity
People living in more diverse communities are more negative about religious diversity in Britain. Respondents who lived in two of the groups of local authorities with some of the highest proportions of residents from minority faith backgrounds (groups with the seventh and ninth highest proportions) were 57% and 38% more likely to be negative towards religious diversity in Britain.
Employment
People who are economically inactive appear to be more negative about religious diversity in Britain. Compared to being employed (our reference category), being economically inactive increased the likelihood of being negative towards religious diversity in Britain by a third (33%).
Voting behaviour
Remain, Labour and Liberal Democrat voters appear to be more positive about religious diversity in Britain. Compared to voting Leave (our reference category), respondents
who voted Remain in 2016 were 72% less likely to be negative towards ethnic diversity in Britain. Compared to those voting Conservative (our reference category), those who voted either Labour or Liberal Democrat at the 2017 General Election were half as likely to be negative (49% and 44% less likely respectively).
Factors that had no effect on predicting negative attitudes towards religious diversity in British society
Region, living in a rural location, education and income had no effect in terms of predicting negative attitudes towards religious diversity in Britain.
B. ATTITUDES TOWARDS DIVERSITY IN DIVERSE LOCAL
COMMUNITIES
1. NEGATIVE ATTITUDES TOWARDS ETHNIC DIVERSITY IN DIVERSE LOCAL COMMUNITIES (see Table 16)
Age
Older people appear to be more negative about ethnic diversity in their local community. Respondents in one of the age categories between 35 and 74 (i.e. 35 to 44, 45 to 54, 55 to 64, 65 to 74) were around twice as likely to be negative (increases in likelihood by factors of 1.8, 1.8, 2.2, 2.6 and 1.9 respectively).
Ethnicity
As we expected, respondents in the BAME group were more positive towards local ethnic diversity. Compared to White respondents (our reference category), BAME respondents were half as likely to be negative towards local ethnic diversity (57% less likely).
Religion
People from minority religious backgrounds appear to be more positive about local ethnic diversity. Compared to respondents in the No religion group (our reference category), respondents in the Christian group were about a third less likely to be negative towards local ethnic diversity (30% less likely). Being in the Other religion group (all non-Christian faiths) had no effect.
Region
Compared to living in London (our reference category), living in the North East and Yorkshire and Humber increased the likelihood of being negative towards local ethnic diversity by two thirds (68% and 66% respectively).
Education
People with degrees appear to be more positive about ethnic diversity in diverse local communities. Compared to having a degree (our reference category), having qualifications other than a degree and no qualifications increased the likelihood by around half (52% and 40% respectively).
Employment
People who are economically inactive appear to be more negative about local ethnic diversity. Compared to respondents in work (our reference category), respondents who were economically inactive were a third more likely to be negative towards local ethnic diversity (37% more likely).
Voting behaviour
Remain and Labour voters appear to be more positive about local ethnic diversity.
Compared to voting Leave (our reference category), voting Remain in 2016 decreased the likelihood of being negative towards local ethnic diversity by 78%. Compared to voting Conservative in 2017 (our reference category), voting Labour decreased the likelihood by 45%.
Other factors that predicted negative attitudes towards local ethnic diversity (altering the likelihood by 20% or less)
Being female decreased the likelihood of being negative towards local religious diversity by 18%.
Factors that had no effect on predicting negative attitudes towards ethnic diversity in diverse local communities
Neither living in a rural location nor income had an effect on predicting negative attitudes towards local ethnic diversity.2
2. NEGATIVE ATTITUDES TOWARDS MIGRANTS IN DIVERSE LOCAL COMMUNITIES (see Table 17)
Age
Older people appear to be more negative toward migrants in their local community.
Compared to respondents aged between 18 and 24 (our reference category), respondents in one of
2 After earlier experimentation, actual levels of ethnic diversity were excluded from the model. Inclusion of this variable
the age categories between 35 and 64 (i.e. 35 to 44, 45 to 54 and 55 to 64) were more likely to be negative (70%, 81% and 56% more likely respectively).
Region
Compared to respondents in London (our reference category), respondents in the West Midlands and Yorkshire and Humber were more likely to be negative towards migrants in their local community (67% and 81% more likely respectively, see Fig. 9).
Education
People with degrees appear to be more positive towards migrants in their local community. Compared to having a degree (our reference category), having qualifications other than a degree and having no qualifications increased the likelihood of being negative towards migrants (60% and 35% more likely respectively).
Voting behaviour
Remain voters are more positive about migrants. Compared to voting Leave (our reference category), voting Remain in 2016 decreased the likelihood of being negative towards migrants in their local community by 77%.
Factors that had no effect on predicting negative attitudes towards migrants in diverse local communities
Sex/gender, ethnicity, religion, actual national diversity, employment, income and voting behaviour in the 2017 General Election had no effect on predicting negative attitudes towards migrants in the local community.
3. NEGATIVE ATTITUDES TOWARDS RELIGIOUS DIVERSITY IN DIVERSE LOCAL COMMUNITIES (see Table 18)
Age
Older people appear to be more negative about local religious diversity. Compared to respondents aged between 18 and 24 (our reference category), older respondents were more likely to be negative towards local religious diversity. Respondents between 45 and 74 (45 to 54, 55 to 64, 65 to 74) were over twice as likely to be negative (increases in likelihood by factors of 2.6, 2.6 and 2.3 respectively).
Ethnicity
Non-White people appear to be more positive about local religious diversity. Compared to White respondents (our reference category), respondents in the BAME group were half as likely to be negative towards local religious diversity (56% less likely).
Religion
Religious people are more positive about local religious diversity. Compared to respondents in the No religion group (our reference category), religious respondents were less likely to be negative towards local religious diversity. Respondents in the Christian and Other religion groups were 38% and 47% less likely respectively.
Education
People with degrees appear to be more positive about local religious diversity.
Compared to having a degree (our reference category), having qualifications other than a degree and having no qualifications increased the likelihood of being negative towards local religious diversity (by 39% and 65% respectively).
Voting behaviour
Remain voters appear to be more positive about local religious diversity. Compared to voting Leave (our reference category), respondents who voted Remain in 2016 were 73% less likely to be negative towards local religious diversity.
Factors that had no effect on predicting negative attitudes towards religious diversity in diverse local communities
Sex/gender, actual levels of religious diversity, living in a region outside London, living in a rural area, employment, income and voting behaviour in the 2017 General Election local communities.
C. ATTITUDES TOWARDS DIVERSITY IN NON-DIVERSE LOCAL
COMMUNITIES
To recap, we asked respondents who did not agree that their local community was ethnically, nationally or religiously diverse whether diversity would be good for it.
1. NEGATIVE ATTITUDES TOWARDS FUTURE ETHNIC DIVERSITY IN NON-DIVERSE LOCAL COMMUNITIES (see Table 19)
Female respondents in non-diverse communities were more positive than male respondents about future ethnic diversity. Compared to male respondents (our reference category), they were a third less likely to be negative (33% less likely).
Ethnicity
Compared to White respondents (our reference category), respondents in the BAME group were 41% less likely to be negative towards future ethnic diversity.
Actual diversity
Respondents in the group of local authorities representing those with the second largest proportion of BAME residents were nearly twice as likely to negative towards future ethnic diversity.
Region
Compared to living in London (our reference category), living in Wales, the North East, the South West and the North West doubled the likelihood of being negative towards future ethnic diversity (we observed increases in likelihood by factors of 2.1, 2.1, 1.9 and 1.8 respectively).
Education
People with degrees appeared less likely to be negative towards future ethnic diversity. Compared to having a degree (our reference category), having qualifications other than a degree increased the likelihood of being negative towards it by a third (31%).
Voting behaviour
Voting Remain in 2016 decreased the likelihood of being negative towards local ethnic diversity (by 71%). Compared to voting Conservative (our reference category), Labour and Liberal Democrat reduced the likelihood by 52% and 40% respectively.
Factors that had no effect on predicting negative attitudes towards religious diversity in non-diverse local communities
Age, religion, living in a rural area, employment and income had no effect on predicting negative attitudes towards future ethnic diversity in respondents’ local communities.
2. NEGATIVE ATTITUDES TOWARDS FUTURE MIGRATION TO NON-DIVERSE LOCAL COMMUNITIES (see Table 20)
Respondents who did not agree that their local community was nationally diverse were asked if migrants would be good for it (hereafter, attitudes towards migrants in the future).
Age
Compared to respondents aged between 18 and 24 (our reference category), those between 25 and 34 were twice as likely to be negative towards migrants being good for local community in the future. No other age category returned a statistically significant effect. This anomalous finding may have revealed pessimism among this age group in relation to future prospects.
Ethnicity
Asian respondents appeared more positive towards migrants in the future. Compared to White respondents (our reference category), Asian respondents were half as likely to be negative towards migrants in their local community (58% less likely).
Actual diversity
Respondents in some local authorities with higher proportions of people born outside the UK were up to two and half times more negative about the prospect of migrants moving into their local community. Compared to living in a local authority with the lowest proportions (our reference category), those in three groups of local authorities (the highest, second highest and fifth highest proportions of non-UK born residents) had an increased likelihood of being negative by factors of 1.5, 1.7 and 2.7 respectively.
Region
Compared to living in London (our reference category), living in any of the other regions increased the likelihood of being negative towards migrants by factors of between 2.5 and 5.5. Living in the North East increased the likelihood by a factor of 5.5, living in Wales by a factor of 3.4 and living in the North West by a factor of 3.3.
Education
Compared to having a degree (our reference category), having qualifications other than a degree and having no qualifications increased the likelihood of being negative towards the prospect of migrants in local communities (by 28% and 57% respectively).
Voting behaviour
Compared to voting Leave (our reference category), voting Remain in 2016 decreased the likelihood of being negative towards migrants in the future by 74%. Compared to voting Conservative in the 2017 General Election, voting Labour and Liberal Democrat halved the likelihood of being negative towards future migrants (reduced likelihoods of 44% and 62%).
Other factors that predicted negative attitudes towards future migration to non-diverse local communities (altering the likelihood by 20% or less)
Compared to male respondents (our reference category), female respondents were 15% less likely to have negative attitudes.
Factors that had no effect on predicting negative attitudes towards future migration to non-diverse local communities
Religion, living in a rural area, employment and income had no effect on predicting negative attitudes towards migrants among respondents who did not perceive their local community to be nationally diverse.
3. NEGATIVE ATTITUDES TOWARDS FUTURE RELIGIOUS DIVERSITY IN NON-DIVERSE LOCAL COMMUNITIES (see Table 21)
Respondents who did not agree that their local community was religiously diverse were asked if such diversity would be good for it (hereafter, future religious diversity).
Sex/Gender
Women appeared more positive towards future religious diversity than men (our reference category. Female respondents were a third less likely to be negative towards future religious diversity (36% less likely).
Ethnicity
Compared to White respondents (our reference category), Asian respondents and respondents in the Other ethnic group were half as likely to be negative towards future ethnic diversity (46% and 51% less likely respectively).
Education
Compared to having a degree (our reference category), having qualifications other than a degree increased the likelihood of being negative towards future religious diversity by a third (an increase of 28%).
Voting behaviour
Compared to voting Leave (our reference category), voting Remain in 2016 decreased the likelihood by 63%. Compared to voting Conservative in the 2017 General Election, voting Labour and Liberal Democrat halved the likelihood (45% in both cases).
Other factors that predicted negative attitudes towards future religious diversity in non-diverse local communities (altering the likelihood by 20% or less)
Compared to respondents in the No religion group (our reference category), Christian respondents were 18% less likely to be negative towards future religious diversity. Living in a rural location reduced the likelihood by 19%.
Factors that had no effect on predicting negative attitudes towards future religious diversity in non-diverse local communities
Actual religious diversity, employment and income had no effect on predicting negative attitudes towards religious diversity among respondents who did not perceive their local community to be religiously diverse.3
3 After early experimentation, age was excluded from the model. Inclusion of this variable affected overall accuracy and
DISCUSSION POINTS
Consensus?If we consider only those who were inclined to express agreement or disagreement, we see that positive attitudes outweigh negative attitudes on all forms of diversity. Overall, many more people in England and Wales are more positive towards diversity than we might assume reading accounts from the media or campaign groups of political and socio-economic division, racial tensions and societal unrest. Whilst attitudes towards various ethnic, national and religious groups in Britain vary, our findings reveal that those who hold diversity in Britain to be a good thing far outnumber those who do not.
Consideration of those who expressed ambivalence or uncertainty
We should not dismiss respondents who neither agreed nor disagreed that diversity is or would be good for British society, or their local community, or would be good for the latter. Questions concerning diversity are sensitive and there is much academic evidence to show that survey respondents are often influenced by social acceptability bias (respondents giving the answers they presume other people will want to receive). Respondents are often uncomfortable expressing negative feelings towards minority groups. That said, it also holds that we should not presume all people answering “not sure” or “don’t know” are harbouring negative sentiment.
Local diversity
Given these considerations, we also see that perceiving a local area to be diverse has a positive effect on attitudes related to diversity. As an aside, perceptions of diversity and positive attitudes towards it may be contingent on each other: it may be that perceptions of diversity are more likely among those with positive attitudes towards it. For those not perceiving their local community to be diverse, attitudes were often much less positive and in the case of religious diversity more negative than positive.
Conversely, living in a local authority that is actually more diverse is associated with more negative views towards diversity and British society. Interestingly, there is no association between attitudes towards diversity and perceptions of local diversity except for those who perceived themselves to be in ethnically and nationally non-diverse communities. Residents in these non-diverse local communities reported more negative views toward diversity.
Regional differences
Whilst an overall consensus may be observable in the data, there were marked regional differences and differences between those living in areas that are actually diverse (rather than those
In terms of migrants, attitudes were more negative in every region outside London bar the South East of England. To multicultural Londoners, this may be a regrettable bad news story from the provinces. To our team, it suggests that a greater emphasis is required on understanding regional differences beyond mere differences in local levels in diversity. Regional differences emerged and held even after actual levels of diversity were considered. This suggests a greater emphasis is required on socio-economic drivers such as education and income and even on demographic factors such as sex/gender and age. It also suggests the UK Government should further devolve policymaking which considers diversity, integration and cohesion or, at the very least, think regionally more often.
CHANGE
IN A NUTSHELL
To develop our understanding of diversity in England and Wales, we asked respondents to our nationwide survey a series of questions concerning their attitudes towards the pace of change in relation to ethnic, national and religious diversity. We asked whether diversity has increased too quickly in Britain. We also asked those in diverse local communities whether diversity in them has increased too quickly and those in non-diverse areas whether it is likely to.
Our analysis revealed negative attitudes towards national and local change in the last ten years.
Almost two thirds of respondents (60%) agreed that the number of migrants in Britain has increased too quickly in the past 10 years (Table 23 and Fig. 12).
Half of the respondents (exactly 50%) either agreed or strongly agreed that ethnic diversity in Britain has increased too quickly in the last ten years (see Table 22 and Fig. 10). Over twice as many agreed than disagreed (50%, compared to 21%).
43% of respondents agreed that religious diversity in Britain has increased too quickly in the past ten years (see Table 24 and Fig. 14). Over twice as many agreed than disagreed (43%, compared to 19%).
Several factors appear to drive negative attitudes towards increasing ethnic, national and religious diversity across Britain. These include: being male; being older; living in a diverse local authority; living in a region outside London; having no qualifications or qualifications other than a degree; earning less than the country’s highest earners (those earning £60,000 per year and over); and voting behaviour in the 2016 EU Referendum and 2017 General Election (see Tables 31-33). We also found respondents in some minority ethnic groups who were more likely than White respondents to feel negatively towards national change.
Several factors appeared to drive negative attitudes towards increasing diversity within local communities: living in the North or Midlands; having no qualifications or qualifications other than a degree; earning less; and voting behaviour. Rather counter-intuitively, being older reduced the likelihood of respondents agreeing that ethnic and religious diversity has increased too quickly in local communities (see Tables 34-36). To illustrate some of the local issues related to change we
incorporated into a series of policy recommendations relating both to addressing negative attitudes towards change and managing change at a regional and local level.
WHAT WE KNOW SO FAR
A review of academic literature concerning attitudes towards demographic and societal change confirmed that there are many overlaps between studies of change and diversity in the UK. Any attempt to gather data relating to attitudes towards diversity in the UK (or Western Europe, or any developed country) does so within the context of increasing diversity, whether through migration from outside, urban migration and growth or birth rates within various population subgroups. Two of the most frequently used theories in the field of diversity studies – contact theory and threat theory – both imply demographic change whether in terms of increased opportunities for intergroup mixing or heightened concerns around competition for jobs and housing.
Recent studies have confirmed the scale and rate of demographic and societal change in the UK in terms of minority communities. According to the Centre on Dynamics of Ethnicity, there have been significant changes in the ethnic diversity of England and Wales since 1991. In 2011, one-in-five people (20%) identified with an ethnic group other than White British compared with 13% in 2001. The population with ethnic background other than White (meaning White British, White Irish and White Other) has more than doubled in size since 1991 from 3 to 7 million, while remaining a minority of the total population (14%).
The religious landscape has also changed. According to a report from the Commission of Religion and Belief in British Public Life (2015) almost half of the population of England describes itself as non-religious, as compared with an eighth in 2001. There has been a general decline in Christian affiliation. In 1985, two-thirds of the population identified as Christian but by 2015 that figure was four in ten. Finally, there have also been increases in religious diversity. Fifty years ago, Judaism – at one in fifty – was the largest non-Christian tradition. Today, it is the fourth largest behind Islam, Hinduism and Sikhism. Taken as a group, religious minorities make up one in ten of the UK’s population.
Research has tended to focus on minority rights rather than native attitudes. Where native attitudes are considered, focus is often placed on attitudes belonging to groups labelled as “White working class”. Fewer studies have focused on native born populations from mixed ethnic and religious backgrounds. British Future, a leading British think tank, has called for a more balanced approach to reporting British attitudes towards immigration among the public at large.
WHAT WE DID
Our nationally representative survey included a series of questions relating to attitudes towards changes in diversity. As stated, we asked respondents whether diversity has increased too quickly in Britain. We also asked those in diverse local communities whether diversity in them has increased too quickly and those in non-diverse areas whether it is likely to. As before, we explored the data using a variety of methods. We used basic statistical techniques – bivariate analysis (i.e. two factors considered at a time) – to establish an overall picture of attitudes towards national and local change. We used more advanced techniques – multivariate analysis (i.e. all factors considered at once) – to identify the groups who were the most likely to have negative attitudes towards national and local change.
We asked, for example, “Do you agree or disagree with the following statement: Ethnic diversity in my local community has increased too quickly in the past ten years?” Our multivariate analysis focuses on those who agreed with each statement (and were, therefore, deemed to have negative attitudes towards change).
(NB. We used the same subjective and objective measures of diversity as in the Diversity chapter.)
Research questions
To what extent may we describe attitudes towards national and local change in England and Wales as positive or negative?
To what extent do attitudes towards national change differ to those towards local change?
To what extent do attitudes towards local change differ between those who do and do not perceive their local community to be ethnically, nationally or religiously diverse?
To what extent do demographic and socio-economic factors, including actual levels of diversity, predict the likelihood that a person will have negative attitudes towards national and local change?
WHAT WE FOUND
A more detailed look at our findings
BASIC ANALYSIS
CHANGE AT THE NATIONAL LEVEL
Half of the respondents (exactly 50%) either agreed or strongly agreed that ethnic diversity in Britain has increased too quickly in the last 10 years (see Table 22 and Fig. 10). The response “agree” was the most popular (28% chose it). Whilst reported levels of ambivalence or uncertainty were high (just over 1 in 3 or 29%, neither agreed nor disagreed or otherwise answered “don’t know”), over twice as many agreed than disagreed (50%, compared to 21%). Even if all those answering “neither agreed nor disagree” were masking negative attitudes, those who agreed would still have outnumbered those who disagreed.
Almost two thirds of respondents (60%) agreed that the number of migrants in Britain has increased too quickly in the past 10 years (Table 23 and Fig. 12). Over three times as many agreed than disagreed (60%, compared to 17%). 1 in 4 or 24% expressed ambivalence or uncertainty.
43% of respondents agreed that religious diversity in Britain has increased too quickly in the past 10 years (see Table 24 and Fig. 14). Over twice as many agreed than disagreed (43%, compared to 19%). Over a third of respondents (38%) expressed ambivalence or uncertainty.
CHANGE AT THE LOCAL LEVEL IN DIVERSE COMMUNITIES
As reported in Chapter 1 (Diversity), most respondents perceived their local community to be ethnically diverse (53%, see Table 4). A similar proportion perceived their local community to be nationally diverse (54%, see Table 5). Around 1 in 3 (39%, see Table 6) perceived their local community to be religiously diverse.
From those per