Chemotactic factors underlying tumor infiltration by
immunocompetent cells in human colorectal cancer
Inauguraldissertation
Zur
Erlangung der Würde eines Doktors der Philosophie
vorgelegt der
Philosophisch-Naturwissenschaftlichen Fakultät
Der Universität Basel
von
Cremonesi Eleonora
aus Italien, Lodi
Basel, 2017
Original document stored on the publication server of the University of Basel
edoc.unibas.ch
This work is licensed under a Creative Commons Attribution-NonCommercial 4.0 International License.
Genehmigt von der Philosophisch-Naturwissenschaftlichen
Fakultät
auf Antrag von
Prof. Dr. Christoph Hess
Prof. Dr. med. Giandomenica Iezzi
Prof. Dr. med. Alfred Zippelius
Basel, 22.03.2016
Prof. Dr. J Schibler
Dekan
During my PhD training I have extensively investigated the role of chemotactic factors involved in the recruitment of beneficial immune cells in human colorectal cancer (CRC). This thesis consists of an introduction highlighting the clinical relevance of immune cell infiltration in CRC, and providing an overview of CRC microenvironment determinants and their possible influence on immune cell migration. A complete description of methods used and results obtained is then included. Finally, major findings and their implications are reviewed in the discussion.
The results of this study have been included in a manuscript currently under preparation. Beside my main research project, I have also been involved in additional projects of our group addressing the prognostic significance of a number of immune cells markers in human CRC, including interleukin-17A (IL-17), granulocyte macrophage colony-stimulating factor (GM-CFS), tumor necrosis factor receptor superfamily, member 4 (TNFRSF4, also known as OX40) and programmed death-ligand 1(PD-L1), and the development of innovative tridimensional systems for culturing human CRC cells in vitro. Publications resulting from these studies are included in the appendix.
1 Summary
Colorectal cancer (CRC) is a common digestive tract malignancy and a major cause of cancer mortality. Several studies have convincingly shown that CRC infiltration by
immunocompetent cells and, in particular, cytotoxic CD8+ T cells (CTLs), IFN-γ-producing
T-helper 1 cells (Th1), Foxp3+ regulatory T cells (Tregs), and CD16+ MPO+ neutrophils, is
significantly associated with prolonged patient survival. However, the chemotactic factors driving these cell populations into the tumor site, their cellular sources and their microenvironmental triggers remain to be elucidated.
During my PhD training I have investigated the chemokine/chemokine receptor network
promoting CRC infiltration by immune cells associated to favorable prognosis. In particular, I addressed:
1. The expression of immune cell markers and their correlation with chemokine expression in primary CRC tissues;
2. The identification of chemokine receptors relevant for CRC infiltration by beneficial immune cells;
3. The chemokine sources in CRC;
4. The microenvironmental stimuli triggering chemokine production in CRC tissues; 5. The effects of chemokine production on immune cell recruitment into CRC.
The expression of a panel of genes encoding 39 chemokines and 7 markers specific for defined immune cell populations was assessed by quantitative PCR array in 62 samples of freshly excised primary CRC and autologous healthy colonic tissue. Correlations between expression of chemokine genes and immune cell markers were then evaluated.
Furthermore, chemokine receptor profiles were analysed by flow cytometry on cell suspensions obtained upon digestion of clinical specimens or on corresponding cell populations from autologous peripheral blood. Based on chemokine receptor expression on
2 tumor infiltrating cells and correlations between expression of chemokines and immune cell
markers, I could identify for each immune cell subset a putative “chemokine signature”:
1) CCL3, CCL5, CCL8 CXCL9, CXCL10 and CXCL12, associated with recruitment of cytotoxic CTLs;
2) CCL5, CCL22, CXCL9, and CXCL12 correlating with infiltration by Th1; 3) CCL22 and CXCL12 potentially attracting Tregs;
4) CXCL2 and CXCL5 promoting chemotaxis of CD16+ MPO+ neutrophils.
I have further investigated potential chemokine sources and stimuli leading to chemokine release within CRC tissues. I found that CRC cells purified from primary tumor specimens express many of the genes encoding identified immune cell recruiting chemokines, including CCL3, CCL5, CXCL2, CXCL5, CXCL9 and CXCL10. In vitro experiments showed that chemokine production by CRC cells is triggered upon their exposure to microbial stimuli, such as Toll-like receptor agonists, or CRC-associated bacteria, including Fusobacterium nucleatum, Bacteroides Fragilis, Bacteroides vulgatus, and Escherichia Coli, thus suggesting that components of the gut flora may critically influence chemokine production in CRC
tissues. This was indeed confirmed by “in vivo” experiments showing that chemokine gene
expression in xenografts, generated upon injection of human CRC cells in immunodeficient NSG mice, appeared to be related to the presence of commensal bacteria. In particular, chemokine gene expression levels in intracecal xenografts, were found to be ≥10 fold higher
as compared to those of subcutaneous xenografts, and they were significantly reduced upon antibiotic treatment of tumor bearing mice.
Most importantly, a correlation between extent of immune cell infiltration and bacterial load was also observed in human CRC samples. Indeed, CRC samples characterized by high expression of chemokine and immune cell markers, displayed significantly higher bacterial loads, as assessed by analysis of bacterial 16S ribosomal RNA, as compared to samples
3 showing low chemokine expression and immune cell infiltration. In addition, a significant correlation between bacterial load and expression of the Th1 marker IRF1, CCL3 and CCL5, was also detected.
Our in vitro and in vivo results cumulatively suggest that bacteria-induced chemokine production by tumor cells may lead to tumor infiltration by beneficial immune cells.
Consistent with this hypothesis, in preliminary “in vitro” experiments, I found that
supernatants of bacteria-stimulated CRC cells promote chemotaxis of CTLs and Th1 cells to a higher extent than untreated tumor cells.
Additional “in vivo” studies are clearly warranted. In particular, I plan to evaluate intratumoral recruitment of CRC-derived CTLs and Th1 cells upon adoptively transfer into intracecal xenografts-bearing mice.
Bacterial species or strains mostly contributing to high chemokine expression and immune cell infiltration in human CRC samples also remain to be identified. Microbiome analysis of CRC samples characterized by high or low immune cell infiltration might be envisaged in future studies.
The results of the present work together with the proposed additional studies will contribute to the understanding of the interplay occurring between gut flora and immune system in CRC, and may pave the way towards innovative treatments aimed at modifying the gut flora in order to promote CRC infiltration by beneficial immune cell subsets.
4
Table of content
Summary ... 1
I. INTRODUCTION ... 6
1.Human colorectal cancer ... 7
1.1 Epidemiology and etiopathogenesis ... 7
1.2 Staging and prognosis... 9
1.3 Current treatment guidelines ... 10
2.CRC immune contexture ... 11
2.1 Definition of immune contexture ... 11
2.2 Impact of immune contexture in CRC ... 12
3. Immune cell trafficking in CRC ... 13
3.1 Chemokines and chemokine receptors ... 13
3.2 Role of chemokines in leukocyte trafficking ... 17
3.3 Gut homing receptors ... 17
3.4 Prognostic significance of chemokine expression in colorectal cancer ... 18
4. Pathophysiology of CRC microenvironment ... 18
4.1 Physiology of normal colonic mucosa ... 18
4.2 The gut microbiota ... 20
4.3 Interactions between gut flora and normal colonic epithelium ... 21
4.4 Physiopathology of gut epithelium in CRC ... 25
II. AIM OF THE STUDY ... 28
III. MATERIALS AND METHODS ... 30
5
2. Cell lines ... 31
3. Bacteria ... 31
4. Flow cytometry ... 32
5. Real-time reverse transcription PCR assays ... 33
6. CRC cell stimulation with TLR agonists and bacteria ... 34
7. Migration assay ... 35
8. Generation of CRC xenografts ... 35
9. Statistical analysis ... 36
IV. RESULTS ... 37
1. Expression of immune cell markers in primary CRC ... 38
2. Chemokine gene expression in primary CRC ... 41
3. Correlations between expression of immune cell markers and chemokine genes in CRC ... 41
4. Chemokine receptor expression on CRC infiltrating beneficial immune cells ... 42
5. Chemokine signatures underling immune cell recruitment in CRC ... 47
6. Chemokine sources in primary CRC ... 47
7. Effects of microbial stimulation on chemokine production by CRC cells in vitro... 49
8. Effects of microbial stimulation on chemokine production in vivo ... 52
9. Effects of chemokine production on immune cell recruitment into CRC tissues ... 54
V. DISCUSSION AND OUTLOOK ... 56
1. Discussion ... 57
2. Outlook ... 62
VI. BIBLIOGRAPHY ... 64
6
7
1.Human colorectal cancer
1.1 Epidemiology and etiopathogenesis
Colorectal cancer (CRC) is the third most frequent type of cancer worldwide. In 2012 about 1,361,000 new CRC cases (9.7% of total cancer incidence) and approximately 694,000 deaths (8.5% of total cancer deaths) were globally reported [Ferlay J. et al., 2013]. The highest incidence is reported in westernized countries [Center MM., et al., 2009]. In particular, in Europe 447,136 new cases of CRC have been reported in 2012 [Ferlay J., et al., 2015].
Notably, in Switzerland, CRC causes 1600 deaths per year (National Institute for epidemiology and cancer registration, NICER, Switzerland).
Risk factors include smoking, alcohol intake and increased body weight [Kuipers E., et al 2015]. Furthermore, chronic colitis due to inflammatory bowel disease (IBD) is also associated with an increased risk of CRC. However, IBD explains only 1% of CRC in westernized population [Jess T., et al., 2012].
CRC results from the accumulation of genetic and epigenetic mutations transforming the normal colonic epithelium initially into benign neoplasia (adenoma), and, subsequently, invasive adenocarcinoma. The steps involved in this process are described in the classic tumor progression model proposed by Fearon and Vogelstein [Fearon & Vogelstein, 1990], (Figure I.1).
8 Figure I.1: Adenoma to carcinoma sequences [West NR, et al. 2015].
Two major types of genomic instability are recognized as alternative mechanisms of CRC carcinogenesis. The most common, present in 65-70% of CRCs, is represented by chromosomal instability (CIN) defined by the presence of multiple structural or numerical chromosome changes in tumor cells. Instead, 15% of CRCs have a near-diploid chromosome set, but present instability in at least 2 of five standard microsatellite markers (so called microsatellite instability, MSI). Furthermore, approximately 20% of CRCs harbor epigenomic instability, either as global hypomethylation or as CpG island methylator phenotype (CIMP) [Walther A., et al., 2009].
Most cases (88%-94%) of CRC are sporadic, i.e. develop upon acquisition of somatic mutations. However, 5– 10% of CRC consist of hereditary cancer syndromes. Two main autosomal-dominant forms are recognized: 1) hereditary non-polyposis colorectal cancer (HNPCC), also known as Lynch syndrome, caused by germ line mutations of mismatch repair (MMR) genes, mainly MLH1, MSH2 and MSH6; 2): familial adenomatous polyposis (FAP) caused by germ line mutation of APC gene [Cunningham D., et al., 2010].
9 1.2 Staging and prognosis
Pathologic evaluation of resected CRC specimens plays a pivotal role in prognostication and patient management [Brenner H., et al., 2014]. The method currently used to assess prognostic differences among patients is the tumor-node-metastasis (TNM) staging system, established by the American Joint Committee on Cancer (AJCC), based on evaluation of tumor size (T), lymph node involvement (N) and presence of distant metastases (M) (Figure 2). Five-year survival rates are estimated approximately around 90% for patients in stage I, 80%, for patients in stage II, 60% in stage III and only<10% in stage IV [O’ Connell JB., et
al., 2004].
Figure 2: CRC development and TNM staging system.
However, TNM system does not precisely predict clinical outcome. Indeed, patients with early stage CRC still have approximately a 20-30% risk of recurrence [Cunningham D., et al.,
10 tumor stage [Maguire, et al., 2014]. The possibility to identify high risk patients who may benefit of additional systemic therapies through the evaluation of additional prognostic factors represents therefore an essential clinical need.
Numerous putative prognostic molecular and immunohistochemical biomarkers have been proposed [Walther A., et al., 2009 and Zlobec I., et al., 2008]. Importantly, KRAS mutation status has been found to predict responsiveness to treatment with anti-epidermal growth factor receptor EGFR antibodies [Walther A., et al., 2009]. However, the potential use of additional putative markers in clinical practice is still under evaluation [Brenner H., et al., 2014].
1.3 Current treatment guidelines
In general, the first line of CRC treatment is surgery, aiming at removing the tumor and corresponding lymphatic vessels [Kuipers E., et al 2015]. Usually, patients with stage I -II tumors do not receive any additional therapy. Instead, when the tumor has spread in to the lymph nodes (stage III), surgery is combined with adjuvant or neo-adjuvant chemotherapy, in particular with 5-Fluorouracil (5-FU), in combination with Oxaliplatin or Irinotecan. For stage IV disease, in which tumor has involved distant organs (metastatic CRC), combined chemotherapies are administered together with targeted therapies, such as monoclonal antibodies specific for EGFR or vascular endothelial growth factor (VEGF), or small molecule-based multikinase inhibitors [Kuipers E., et al 2015]. Response rates to systemic therapies remain limited, usually not exceeding 20% of treated patients [Brenner H., et al., 2014]. The identification of novel and more effective therapeutic approaches would therefore be desirable. Recently, the potential efficacy of therapeutic antibodies targeting immunological checkpoints, including CTLA4, PD-1 and PD-L1, has also started to be evaluated in clinical trials [Le DT., et al., 2015 and Singh PP., 2015].
11
2.CRC immune contexture
2.1 Definition of immune contexture
The term “immune contexture” refers to the analysis of location, density and functional orientation, of different tumor infiltrating immune cell populations [Fridman WH., et al., 2012] (Figure I.3).
Since a long time, histopathological analysis has provided evidence that tumors are infiltrated by different types of immune cells, including lymphocytes, macrophages and granulocytes. Immune infiltrates are heterogeneous between tumor types, and largely vary from patient to patient.
Only in the last decade, however, the prognostic significance of specific tumor infiltrating immune cell types has been recognized. Comprehensive gene expression and immunohistochemical analysis in large cohorts of different types of human tumors, annotated with clinico-pathological data, have revealed that tumor infiltration by defined immune cell types, their localization within the tumor, and their expression of specific cytokines/chemokines, predict patient survival more precisely than TNM staging, thus possibly representing a superior prognostic factor [Fridman WH., et al., 2012].
The immune contexture has therefore been proposed as additional prognostic tool. Its robustness in clinical practice is currently being evaluated by a consortium of experienced pathologists worldwide [Galon, et al., 2012].
12 Figure I.3: The immune contexture [Fridman WH., et al., 2012].
2.2 Impact of immune contexture in CRC
CRC is the first tumor type for which the immune contexture has been proven to critically impact survival. In particular, Galon and collaborators have reported that high infiltration by CD8+CD45RO+ T cells, and IFN-g producing Th1 cells correlates with good prognosis [Galon J., et al., 2006 , Tosolini M., et al., 2011 and Camus M., et al., 2009]. More surprisingly, high infiltration by Foxp3+ regulatory cells has also be found to predict better survival [Salama P., et al., 2009 and Frey DM., et al., 2010]. In addition, the presence of CD16+ MPO+ cells is also associated with favorable prognosis [Sconocchia G., et al., 2010; Hirt C., et al., 2013]. In contrast, the role of IL-17-producing CD4+ T cells (Th17) is still controversial. In a study, based on a small sample cohort (50-200), high expression of IL-17 has been found to be associated with unfavorable prognosis [Tosolini M., et al., 2011]. More recently, however, in a recent study from our group, based on the analysis of a cohort including more than 1400 CRC samples, no association with clinical outcome has been found [ Amicarella F., et al., 2015], (Table I.1).
13 Table I.1: Prognostic significance of immune cell subsets in CRC.
Mechanisms underlying heterogeneity of tumor infiltration by immune cells in different tumors remain to be elucidated. In particular, factors promoting migration of individual immune cell populations into the tumor remain to be clarified.
3. Immune cell trafficking in CRC
3.1 Chemokines and chemokine receptorsChemokines are chemotactic cytokines which control migratory patterns and positioning of various cell types [Griffith JW. et al., 2014]. Tumors are known to secrete chemokines playing a crucial role in the recruitment of different types of proinflammatory leukocytes into the tumor microenvironment as well as in many additional biological processes, such as tumor growth, survival, migration and angiogenesis [Wang D., et al., 2009 and Balkwill F., 2004]. More than 40 different chemokines have been identified so far which can be divided in four
groups, based on the position of the last cysteine residue: CXC (α-family), CC (β-family), C
14 Figure I.4: Schematic illustrations of the four chemokine subfamilies and the corresponding receptors [Rostène W., et al., 2007].
Chemokine structure appears to be linked to specific functions. In particular, the CXC subgroup has been shown to play an important role in angiogenesis in both physiologic and pathologic settings [Keeley EC., et al., 2008]. Notably, among this chemokine family, two subgroups can be further identified based on the presence or absence of a three amino acid sequence, glutamic acid-leucine-arginine (called the “ELR” motif) proximal to the CXC
sequence. ELR containing (ELR+) CXC chemokines are potent inducer of angiogenesis. Instead, non- ELR containing (ELR−) CXC chemokines are potent inhibitors of angiogenesis [Lee HJ., et al., 2014].
Based on their expression chemokines can also be classified in homeostatic, and inflammatory. The former are constitutively expressed, whereas the latter are induced by inflammatory stimuli [Le Y., et al., 2004]. However, there are a few chemokines including
15 CCL11, CCL20, CCL22, which are constitutively expressed and can also be upregulated upon inflammation. In humans, genes encoding inflammatory chemokines are located in chromosomes 4 and 17, whereas those encoding homeostatic chemokines are located individually or in miniclusters in different chromosomes [Zlotnik A., et al., 2012]. Notably, as a result of chromosomal instability, chemokine genes localized in chromosomes 7, 16 and 19, frequently undergo amplifications, whereas chemokine genes localized in chromosome 4 and 17 are deleted [Bindea G., et al., 2013].
Chemokines mediate their biological effects by binding to corresponding receptors. Chemokine receptors are members of the class A rhodopsin-like family of seven transmembrane domain G protein-coupled receptors (GPCRs) [Borroni EM., et al., 2010]. Chemokine receptor activation begins with extracellular ligand binding (Figure I.5) which triggers interaction with intracellular quiescent GDP-bearing trimeric G-proteins. This results in exchange of GDP for GTP, causing the protein to dissociate into alpha and G-beta/gamma subunits. The latter subunit in turn activates enzymes such as phospholipase C and phosphoinositide-3-kinase, which convert phosphotidylinositol-4,5-diphosphate (IP2) into phosphotidylinositol-1,4,5-triphosphate (IP3) and diacylglycerol (DAG). IP3 stimulates the influx of calcium ions, and DAG activates protein kinase C (PKC) isoforms. The intracellular environment is thus prepared for a cascade of phosphorylation events involving a series of kinases (e.g., mitogen-activated protein kinase and protein typsine kinase) and small GTPases (e.g., Ras and Rho) ultimately mediating cellular functions such as adhesion, chemotaxis, degranulation, and respiratory burst [Chensue SW., et al., 2001].
On the other side, chemokine receptors undergo desensitization and regulation. Upon ligation, chemokine receptors may be internalized and then degraded or recycled, leaving the membrane temporarily unresponsive to further ligand stimulation [Chensue SW., et al., 2001]. In particular, the C-terminal region contains target residues that may be phosphorylated by GPCR kinases, thus allowing the binding of regulatory molecules called arrestins, ultimately
16 causing uncoupling and desensitization. An additional mechanism of regulation occurs through direct inactivation of protein activity by GTPases, known as RGS (regulators of G-protein signaling) G-proteins [Chensue SW, et al., 2001].
Figure I.5: Chemokine receptor ligation and activation events. [Chensue SW., et al., 2001].
So called ‘atypical chemokine receptors’ [Mantovani A., et al., 2006], have also emerged as
important regulators of chemokine function. These receptors, which are characterized by inability to signal following ligand binding, have been shown to be able to scavenge chemokines and therefore to influence chemokine responses in vivo [Graham GJ., et al., 2012]. Four atypical receptors, DARC, CCXCKR and CXCR7 and D6, have been identified so far [Graham GJ., 2009].
17 3.2 Role of chemokines in leukocyte trafficking
Chemokines and chemokine receptors play a crucial role in the complex series of interactions between leukocytes and endothelial cells, eventually leading to the extravasion of leukocytes from the circulation into tissues. Transitory leukocyte attachment to the endothelium is initially mediated by the interaction of adhesion molecules, such as integrins and selectins, with their ligands on endothelial cells. However, only engagement of chemokine receptors, expressed on leukocytes, with corresponding chemokines on endothelial cells induces the arrest of leukocytes under shear flow, and subsequently promotes the diapedesis of the cells through the vascular endothelium and their localization into specific microenvironments [Masopust D., Schenkel JM., 2013 and Griffith JW., et al., 2014 and Habtezion A., et al., 2016].
3.3 Gut homing receptors
Distinct homing receptor patterns mediate immune cell recruitment into different anatomical compartments. In particular, in the absence of inflammation, T cell recruitment into the lamina propria of small intestine, is largely dependent on the expression of the integrin α4β7
and the chemokine receptor CCR9 whose corresponding ligands, mucosal vascular addressin cell-adhesion molecule 1(MAdCAM-1) and CCL25, are expressed in the gut lamina propria and on epithelial cells [Mora JR., et al., 2006 and Habtezion A., et al., 2016]. However, CCL25 expression decreases from the proximal to the distal small intestine [Stenstad H., et al., 2007] and it is poor in the colon [Papadakis KA., et al., 2000]. Indeed, CCR9 expression does not appear to be required for T cell trafficking into the colon [Papadakis KA., et al., 2000].
CCR6 and its ligand CCL20 have also been shown to significantly contribute to recruitment of T cells, and in particular of Th17 cells, into the small and large intestine, upon
18 inflammation [Wang C., et al., 2009]. Colon tissues from patients with IBD express higher levels of CCL20 than uninflamed tissues [Kaser A., et al., 2004]. Furthermore, antibodies against CCL20 has been shown to block adhesion of T and B cells to inflamed microvessels in mice with dextran sodium sulfate (DSS)-induced colitis [Teramoto K., et al., 2005].
Finally, CXCR4 and its widely expressed ligand CXCL12 may also participate in lymphocyte localization in the gut [Oyama T., et al., 2007].
3.4 Prognostic significance of chemokine expression in colorectal cancer
In humans CRC expression of defined chemokines, including CXCL16 [Hojo S., et al., 2007], CXCL9, CXCL10 [Mlecnik B., et al., 2010], CXCL13 [Bindea G., et al., 2013], CCL18 [Yuan R., et al., 2013], and CCL21 [Zou Y., et al., 2013], has been reported to correlate with good prognosis. In contrast, expression of CCL7 [Cho YB., et al., 2012], CXCL1 [Wang D., et al., 2006 and Ogata H., et al., 2010], CXCL5 [Kawamura M., et al., 2012], CXCL8 [Rubie C., et al., 2007], and CXCL12 [Wang SC., et al., 2010 and Kim J., et al., 2005 and 2006] has been found to be associated with unfavorable clinical outcome, Mechanisms underlying these associations remain to be clarified. Importantly, the nature of the cell populations responding to these chemokines and potential chemokine sources have not been elucidated yet.
4
. Pathophysiology of CRC microenvironment
4.1 Physiology of normal colonic mucosa
The normal colonic mucosa is composed by a single cell layered epithelium, formed by four types of intestinal epithelial cells (IEC), including absorptive enterocytes, mucus-producing goblet cells, antimicrobial peptides (AMP)-producing Paneth cells, and hormone-producing enteroendocrine cells, and by the underlying lamina propria, infiltrated by different type of
19 immune cells, including dendritic cells, macrophages, innate lymphoid cells, T lymphocytes, and plasma cells [Abreu MT., 2010].
IEC display a polarized structure characterized by an apical and basolateral surface facing the intestinal lumen and the lamina propria, respectively. The epithelial layer is overlaid by a mucous stratum, composed of secretory mucins (MUCs), mainly MUC2, produced by goblet cells, which creates a barrier impermeable to commensal bacteria and other microorganisms present in the gut lumen [Abreu MT., 2010] (Figure I.6). The integrity of the barrier is also maintained by the presence of adherent and tight junctions holding epithelial cells together and regulating the selective para-cellular permeability to solutes and water [Sánchez de Medina F., et al., 2014].
20 4.2 The gut microbiota
The gastrointestinal tract is heavily colonized by a vast number of microorganisms, mostly bacteria, viruses, and fungi, referred to as the gut microbiota or microflora, living in peaceful coexistence with their host [Sekirov I., et al., 2010]. Bacteria represent a major component of the gut flora. The number of bacterial cells present in the mammalian gut shows a continuum going from 10 1 to 10 3 bacteria per gram of content in the stomach and duodenum, progressing to 10 4 to 10 7 bacteria per gram in the jejunum and ileum and culminating in 10 11 to 10 12 cells per gram in the colon. Indeed the colon alone is estimated to contain over 70% of all the microbes in the human body [O'Hara AM., et al., 2006]. The majority of the gut flora is composed of strict anaerobes. Although, more than 50 bacterial phyla have been recognized, two only, Bacteroides and Firmicutes, appear to be dominant, whereas Proteobacteria, Verrucomicrobia, Actinobacteria, are present in minor proportions [Donaldson GP., et al., 2016] (Figure I.7).
21 Figure I.7: Spatial and temporal aspects of intestinal microbiota composition [Sekirov I., et al., 2010].
Microbial colonization of human gut begins at birth, upon the passage through the birth canal where the fetus is exposed to a complex microbial population. Indeed, the intestinal microbiota of newborns has been found to be very similar to the vaginal microbiota of their mothers [Mandar R., et al., 1996].
However, subsequently, the gut microbiota composition is shaped by additional factors, such as diet and exposure to antibiotics [Sekirov I., et al., 2010].
4.3 Interactions between gut flora and normal colonic epithelium
Under normal conditions, interaction between normal colonic epithelial cells and gut microbiota is limited and highly regulated. IEC can sense the presence of gut microbiota or
22 their products into the gut lumen thanks to the expression of Pattern recognition receptors (PRR) recognizing specific molecular patterns related to commensals, pathogens or cellular damage. Several functionally distinct classes of PRR [Medzhitov R., 2007] including, among others, Toll-like receptors (TLR), nucleotide binding oligomerization domain (NOD)-like receptors (NLR), and RNA helicases (RIG-I (retinoid acid-inducible gene-I) [Fukata M and Arditi M., 2013], are expressed by IEC. In particular, in the intestine and in the colon the recognition of commensal bacteria and pathogens is largely mediated by TLRs [Abreu MT., 2010].
TLRs are type 1 integral membrane glycoproteins [Martin MU., 2002], and are characterized by an extracellular leucine-rich repeat (LRR) domain and an intracellular Toll/IL-1 receptor (TIR) domain [Hashimoto C., 1988]. Thirteen mammalian TLRs have been described; classified into two subfamilies based on their localization. Cell surface TLRs, including TLR1, TLR2, TLR4, TLR5, TLR6, and TLR10; and intracellular TLRs, localized in the endosome including TLR3, TLR7, TLR8, TLR9, TLR11, TLR12, and TLR13 [Kawasaki T and Kawai T., 2014]. TLRs play a central role as primary sensor of invading pathogens and inducers of host antimicrobial defense. Cell surface TLRs recognize microbial membrane components, such as lipids, lipoproteins, and proteins, whereas intracellular TLRs sense exogenous or endogenous nucleic [Blasius AL. and Beutler B., 2010] (Table I.2).
23 Table I.2: Toll-like receptors and their main ligands [modified from Manaval B., et al., 2011].
24 The activity of TLR agonists occurs through binding to the corresponding TLR receptors. In particular, most Toll-like receptors (TLRs) except for TLR3 induce nuclear factor (NF)-κB
activation through the myeloid differentiation primary response gene 88 (MyD88) pathway. In contrast, TLR3 exclusively induces IRF3 activation through the TIR-domain-containing adapter-inducing interferon (IFN) - β (TRIF) pathway (Figure I.8), [Fukata M and Arditi M, 2013].
Figure I.8: Mammalian TLR signalling pathways [O’ Neill L., et al., 2013].
Under homeostatic conditions, colonic IECs express low levels of TLR2, TLR4 and high levels of TLR3 and TLR5 [Abreu MT., et al., 2001 and Otte JM., et al., 2004]. Notably, some TLRs, such as TLR5 are expressed only at the basolateral surface, whereas others, such as TLR9, are expressed at both apical and basolateral surface. However, also in the latter case,
25 TLR function appears to be polarized inasmuch as basolateral TLR engagement has been shown to trigger activation of NF-kb pathway, whereas apical engagement leads to its inhibition. These evidences are consistent with the hypothesis that inflammatory responses should only occurs upon formation of a breach in the epithelial barrier [Abreu MT., 2010]. In the presence of inflammation, TLRs expression on IEC is increased. In particular, TLR4 expression is up regulated by inflammatory cytokines such as, interferon-γ (IFN-γ) and tumor
necrosis factor (TNF). Notably, high TLR4 expression has been reported in inflammatory bowel disease [Abreu MT., et al., 2002 and 2010].
On the other hand, TLR2 and TLR4 functions are negatively regulated by Toll-interacting protein (TOLLIP) [Abreu MT., 2010] an intracellular protein that inhibits TLR2 and TLR4 signaling through its effect on IL-1R-associated kinases (IRAKs) [Burns K., et al., 2000]. Interestingly, IECs from patients affected by inflammatory bowel disease fail to upregulate TOLLIP, a finding suggesting that lack of TOLLIP may lead to chronic inflammation [Abreu MT., 2010].
TLR triggering by microbial stimuli results in a number of protective functions, including induction of IEC proliferation upon epithelial cells injury, release of antimicrobial peptides, and induction of IgA secretion by B cells [Abreu MT., 2010].
4.4 Physiopathology of gut epithelium in CRC
Recent evidence has proved that genetic mutations eventually leading to CRC development cause an early alteration of the epithelial barrier, due to decreased mucus production and loss of tight junctions [Grivennikov S., et al., 2012]. Commensal bacteria and their products may then translocate across the epithelium into the lamina propria, and trigger TLRs expressed on the basolateral surface of IEC and on immune cells. This results in the release of pro-inflammatory factors, ultimately promoting tumor progression (Figure I.9).
26 Figure I.9: Inflammatory Model of the Initiation of Colorectal Cancer
[Gallimore AM. and Godkin A., 2013].
Indeed, mice grown under germ free condition or deficient for TLRs or MYD88 show reduced tumor development [Rakoff-Nahoum S., et al., 2007], thus suggesting that TLR engagement by microbial stimuli promotes tumor growth.
Interestingly, in humans, defined bacteria species have been found to be abundant in CRC tissues [Castellarin M., et al., 2012]. In particular, Fusobacterium nucleatum (F. nucleatum), an invasive anaerobic bacterium common in dental plaque and generally associated with periodontitis [Castellarin M., et al., 2012], has been found to be overrepresented in CRC as compared to corresponding healthy colonic mucosa [Castellarin M., et al., 2012 and Kostic AD., et al., 2013]. The significance of this association is still unclear. On the one hand, F. nucleatum has been shown to direct promote CRC cell proliferation in vitro upon activation of WNT signaling [Rubinstein MR., et al., 2013] and tumor development in vivo [Kostic AD., et al., 2013]. On the other hand, it might suppress antitumor immune responses by promoting recruitment of myeloid derived suppressor cells [Kostic AD., et al., 2013]and by inhibiting the activities of NK and T cell through its interaction with the inhibitor receptor TIGIT [Gur C., et al 2015].
27 Paradoxically, TLR stimulation has also been shown to result in the induction of effective anti-tumor immunity [Rhee SH., et al., 2008]. However, underling mechanisms are not fully understood. In particular, whether TLR triggering may also lead to production of chemokines possibly recruiting effector immune cell populations remains to be thoroughly evaluated.
28
II.
AIM OF THE
29
CRC infiltration by specific immune cells, including CTLs, Th1 cells, and, most surprisingly, T regs and CD16+ MPO+ neutrophils, is associated with good prognosis. However, the chemotactic factors driving these cell populations into the tumor site, their cellular sources and their microenvironmental triggers remain to be elucidated. My PhD work aimed at investigating the chemokine/chemokine receptor network promoting CRC infiltration by immunocompetent cells associated to favorable clinical outcome.
In particular I have addressed:
1. Expression of immune cell markers and their correlation with chemokine expression in primary CRC tissues;
2. Identification of chemokine receptors relevant for CRC infiltration by beneficial immune cells;
3. Chemokine sources in CRC;
4. Microenvironmental stimuli triggering chemokine production in CRC tissues; 5. Effects of chemokine production on immune cell recruitment into CRC tissues.
30
III.
MATERIALS AND
31 1. Clinical specimen collection and processing
Clinical specimens were collected from consenting patients undergoing surgical treatment at Basel University Hospital, St. Claraspital in Basel, Kantonsspital Olten, Kantonspital St. Gallen, and Ospedale Civico di Lugano. Tumor or healthy tissue fragments were snap frozen for RNA extraction or treated by enzymatic digestion in order to obtain single cell suspensions. Briefly, tissues were minced and digested in Dulbecco's Modified Eagle Medium (DMEM) supplemented with 2 mg/ml collagenase IV (Worthington Biochemical Corporation) and 0.2 mg/ml DNAse I (Sigma-Aldrich) for 1 hour at 37°C. Single cell suspensions were then filtered through cell strainers (100, 70, and 40 µm diameter, sequentially) and used for flow cytometric analysis. In addition, peripheral blood mononuclear cells (PBMCs) from healthy donors (HD PB) or from CRC patients (CRC PB) were isolated by Ficoll-Hypaque (Histopaque-1077, Sigma-Aldrich) density gradient centrifugation and subsequently used for flow cytometry characterization.
The use of human samples in this study has been approved by the local ethical committee.
2. Cell lines
LS180, HT29 and Colo2015 human CRC cell lines were purchased from the European Collection of Cell Cultures, and maintained in RPMI 1640 (GIBCO) or, for HT29, McCoy's 5A medium (Sigma-Aldrich), supplemented with 10% fetal bovine serum, GlutaMAX-I and kanamycin (GIBCO). All cell lines were used at early passages.
3. Bacteria
Fusobacterium nucleatum (subsp. Nucleatum, ATCC 25586), Bacteroides vulgatus (Eggerth and Gagnon, ATCC 8482), and Bacteroides fragilis (non enterotoxigenic strain 9343, ATCC 25285), were kindly provided by Dr. Nina Khanna, Department of Biomedicine, University of Basel. They were cultured under anaerobic conditions. Escherichia coli (Castellani and
32 Chalmers, ATTC 25922) was purchased from American type culture collection (ATCC) and cultured in Tryptic Soy Agar/Broth (BD). All bacteria were used upon heat-inactivation at 90° for 1 hour.
4. Flow cytometry
For the analysis of surface markers, PBMCs from CRC patients, and single cell suspensions obtained from freshly excised clinical specimens of CRC and corresponding tumor-free colonic mucosa were incubated with fluorochrome-conjugated antibodies for 15 minutes at 4 °C. For the analysis of intracellular markers, cells were fixed and permeabilized (Intracellular Fixation & Permeabilization Buffer Set, eBioscience) and stained intracellularly with specific antibodies for 30 minutes at room temperature (RT). Antibodies used are listed in Table III.1
Specificity clone company
CD3 SK7 BD Biosciences CD4 SK3 BD Biosciences CD8 SK1 BD Biosciences CD16 3G8 BD Biosciences CD66b G10F5 Biolegend CCR3 5 E8 BD Biosciences CCR4 205410 R&D Systems CCR5 2D7 BD Biosciences CCR6 R6H1 eBioscience CCR9 BBC3M4 eBioscience CXCR1 42705 R&D Systems CXCR2 48311 R&D Systems CXCR3 1C6 BD Biosciences CXCR4 12G5 BD Biosciences CX3CR1 528728 R&D Systems TLR1 GD2.F4 eBioscence TLR2 TL2.1 eBioscence TLR3 TLR3.7 eBioscence TLR4 HTA125 eBioscence TLR5 624915 R&D Systems TLR6 86B1153.2 IMGENEX TLR7 533707 R&D Systems TLR8 44C143 IMGENEX TLR9 eB72-1665 eBioscence TLR10 3C10C5 eBioscence
33 Stained cells were analyzed by FACSCalibur flow cytometer (BD Biosciences). Tumor cells, as identified by the expression of EpCAM+, were sorted by magnetic microbeads (MACS® MicroBeadsfrom Miltenyi Biotec) from single cell suspensions obtained upon digestion of freshly excised CRC samples. The purity of tumor cells was > 98%, as evaluated by flow cytometry.
5. Real-time reverse transcription PCR assays
Total RNA was extracted from stored CRC tissues or sorted cell populations using NucleoSpin RNA (MACHEREY-NAGEL) and reverse transcribed using the Moloney Murine Leukemia Virus Reverse Transcriptase (M-MLV RT, Invitrogen). Quantitative Real-Time
PCR was performed in the ABI prism™ 7700 sequence detection system, using TaqMan
Universal Master Mix and No AmpErase UNG (both from Applied Biosystems). Commercially available primer sequences used are summarized in Table III.2.
Gene name code/seq company
CCL1 Hs00171072_m1 AppliedBiosystems CCL2 Hs00234140_m1 " CCL3 Hs00234142_m1 " CCL4 Hs99999148_m1 " CCL5 Hs00982282_m1 " CCL7 Hs00171147_m1 " CCL8 Hs00271615_m1 " CCL11 Hs00237013_m1 " CCL13 Hs00234646_m1 " CCL14-15 Hs00361122_m1 " CCL16 Hs00171123_m1 " CCL17 Hs00171074_m1 " CCL18 Hs00268113_m1 " CCL19 Hs00171149_m1 " CCL20 Hs00171125_m1 " CCL21 Hs99999110_m1 " CCL22 Hs00171080_m1 " CCL23 Hs00270756_m1 " CCL24 Hs00171082_m1 " CCL25 Hs00171144_m1 " CCL26 Hs00171146_m1 " CCL27 Hs00171157_m1 "
34 CCL28 Hs00219797_m1 " CXCL1 Hs00236937_m1 " CXCL2 Hs00236966_m1 " CXCL3 Hs00171061_m1 " CXCL4 Hs00236998_m1 " CXCL5 Hs00171085_m1 " CXCL6 Hs00237017_m1 " CXCL7 Hs00234077_m1 " CXCL8 Hs00174103_m1 " CXCL9 Hs00171065_m1 " CXCL10 Hs99999049_m1 " CXCL11 Hs00171138_m1 " CXCL12 Hs00171022_m1 " CXCL13 Hs00757930_m1 " CXCL14 Hs01557413_m1 " CXCL16 Hs00222859_m1 " CX3CL1 Hs00171086_m1 " IRF1 Hs00971960_m1 " FOXP3 Hs01085834_m1 " CD16A/B Hs00275547_m1 " IL17A Hs99999082_m1 " T-bet Hs00203436_m1 " CD33 HS01076281_m1 " CD8
CTCGGCCCTGAGCAACTC (Forward) Microsynth GGCTTCGCTGGCAGGA (Reverse) " ATGTACTTCAGCCACTTCGTGCCGGTC (Probe) " IFNγ AGCTCTGCATCGTTTTGGGTT (Forward) " GTTCCATTATCCGCTACATCTGAA (Reverse) " TCTTGGCTGTTACTGCCAGGACCCA (Probe) " 16S TCCTACGGGAGGCAGCAGT (Forward) " GGACTACCAGGGTATCTAATCCTGTT (Reverse) " CGTATTACCGCGGCTGCTGGCAC (Probe) " Table III.2: List of primers used in this study
6. CRC cell stimulation with TLR agonists and bacteria
Cells from LS180, HT29 and Colo205 CRC cell lines, were plated in 24-well plates
(Sigma-Aldrich) (350’000 cells/well in 0.5 ml) in RPMI 1640 and then stimulated at 37°C with a
panel of TLR agonists, including Lipopolysaccharides (LPS, 1000ng/ml from Escherichia coli O111:B4, Sigma-Aldrich), polyinosinic-polycytidylic acid (poly(I:C), 10µg/ml, Invivogen), synthetic diacylated lipoprotein (FSL-1, 1µg/ml, Invivogen), and purified
35 flagellin from S. Typhimurium (100ng/ml, Invivogen), or with heat-inactivated bacteria, including Fusobacterium nucleatum, Escherichia Coli, Bacteroides vulgatus, and Bacteroides Fragilis (bacteria: cell ratio = 30:1). After 4 hours, cells were collected for RNA extraction and used for the analysis of chemokine expression. Supernatants were collected from parallel cultures after an overnight incubation and used for migration assays.
7. Migration assay
Following gradient centrifugation, CD8+ T cells and neutrophils were sorted from peripheral blood of healthy donors by magnetic microbeads (MACS® MicroBeadsfrom Miltenyi Biotec, and EasyStep enrichment kit from StemCell Technologies, respectively,) according to
manufacturer’s instructions. The purity of both cell populations was >98%, as confirmed by
flow cytometry. Chemotaxis assays were performed using 96-well transwell plates with 5-μm pore size membranes (Corning Costar). Supernatants from LS180 cells, left untreated or treated with different bacteria strains for an overnight period, were added to the lower chambers (250 µl/ well). CD8+ T cells and neutrophils (1.5 x 10^4 / well in 80 µl) were placed in the upper chamber and allowed to migrate for 90 min at 37°C. Numbers of cell migrated into the lower chamber were quantified by flow cytometry. Extent of cell migration was expressed as migration index, calculated as numbers of cells migrated towards supernatants / number of cells migrated towards control medium.
8. Generation of CRC xenografts
In vivo experiments were performed collaboration with Prof. Dr. Borsig Lubor, Institute of Physiology, University of Zurich.
NSG mice (NOD.Cg-Prkdcscid Il2rgtm1Wjl/SzJ) were initially purchased from Charles River Germany, and then bred and maintained in our mouse facility. Eight-week old mice were
36 injected subcutaneously or intracecally with LS180 cells (3x10^5/ mouse), resuspended in a 1:1 mixture of PBS and Matrigel (8.7 mg/ml, Corning Costar).
For intracecal injection, mice were anesthetized with 10 % Ketamine (0.65 ml/kg intraperitoeum, i.p. Streuli Pharma AG) and 2% Xylazine, (0.5 ml/kg, i.p. Streuli Pharma AG). After surgery, Meloxicam (2 mg/kg, i.p. Boehringer Ingelheim), as pain killer, was also administered. Tumor growth was weekly monitored by palpation. In some experiments, starting from day 10 after injection, a randomized group of intracecally injected mice was treated with Ampicillin Sodium Salt (1 g/L, Amresco) and Vancomycin Hydrochloride (0.2 g/L, Bio Basic Canada), administered in the drinking water. Subcutaneously injected mice were sacrificed 24 days after injection. Intracecally injected mice were sacrificed on day 31 after inoculation. Tumors were harvested and snap frozen for RNA extraction.
9. Statistical analysis
The significance of differential expression of chemokines and immune cells markers in CRC specimens and corresponding healthy mucosa was tested by using Wilcoxon signed rank test. Correlations between chemokine expression and immune cell markers were evaluated using Spearman correlation assays. Differences in frequencies of chemokines receptor expression on CTLs, Th1 and Tregs and neutrophils from peripheral blood of healthy donors or CRC patients, and between tumor and control tissues were evaluated by Mann Whitney test. Chemokine induction in CRC cells in vitro and in vivo was analyzed using two-way ANOVA. Differences in migration rates were tested by one-way ANOVA. Statistical analysis was performed by using GraphPad Prism 5 software (GraphPad Software).
37
38 1. Expression of immune cell markers in primary CRC
We first evaluated by RT-PCR the expression of genes encoding immune cell markers identifying specific immune cell populations predictive of favorable prognosis, including CD8 for CTLs [Galon J., et al., 2006], T-bet and IRF1 for Th1 [Tosolini M., et al., 2011], Foxp3 for Tregs [Salama P., et al., 2009 and Frey DM., et al., 2010], and CD16 for neutrophils [Droeser RA ., et al 2013], in a cohort of 62 CRC specimens and corresponding tumor-free colonic tissues. Clinical-pathological characteristics of patients included in the cohort are listed in Table IV.1.
Patients Characteristics Age (mean) 71.03 Sex Male n (%) 34 (54.8) Female n (%) 28 (45.2) T stage T1 n (%) 0 T2 n (%) 6 (9.7) T3 n (%) 46 (74.2) T4 n (%) 10 (16.1) N stage N0 (%) 39 (62.9) N1 (%) 14 (22.6) N2 (%) 9 (14.5)
39 Expression levels of Foxp3 and CD16 genes were significantly increased in CRC (p<0.0001), whereas expression of CD8, T-bet and IRF1 genes was comparable in CRC and control tissues (Figure IV.1A). However, in a subgroup of CRCs (up to n=15) a marked upregulation of the expression of CD8, T-bet and IRF1 genes, as compared to matched control tissues, was also observed (Figure IV.1B). Correlations between different immune cell markers were also observed. As expected, expression of IRF-1 and T-bet genes, were strongly correlated. More surprisingly, expression of both IRF-1 and T-bet genes was associated with that of Foxp3 gene. Furthermore, a strong correlation between expression of CD8 and T-bet, Foxp3, and CD16 genes was also detected (Figure IV.1C).
40 A
B
C
Figure IV.1: Expression of immune cell markers genes in CRC tissue and corresponding tumor-free colonic tissues.Total cellular RNA was extracted from freshly excised CRC tissues (bold) and corresponding tumor-free colonic mucosa samples (gray) and reverse transcribed (n = 62). Expression of the indicated genes was analyzed by qRT-PCR, using, GAPDH house-keeping gene as reference. A. Gene expression levels relative to GAPDH. B. Ratio between gene expression levels in CRCs and matched tumor-free tissues. Statistical significance was assessed by Wilcoxon signed rank test (***p<0.0001) C. Correlation between CD8; IRF1 and T-bet, Foxp3 and, CD16 were detected. Spearman r and relative p-values are indicated in the table. Significant correlation coefficients ≥0.3 are indicated in bold.
41 2. Chemokine gene expression in primary CRC
We next evaluated the expression of a large panel of chemokine genes (Table III.2) in the same cohort of samples. All chemokines were found to be expressed in CRC, although at different levels. Notably, expression levels of CCL3, CCL4, CCL7, CCL17, CCL22, CCL24, CCL25, CCL26, CXCL1, CXCL2, CXCCL3, CXCL4, CXCL5, CXCL6, CXCL7, CXCL8, CXCL9, CXCL10, CXCL11, and CXCL16 were significantly higher in CRC as compared to
tumor-free colonic mucosa, whereas those of CCL8, CCL11, CCL13, CCL14-15, CCL19, CCL20, CCL21, CCL23, CCL28, CXCL12, and CXCL14 genes appeared to be downregulated (Figure IV.2 A, B).
Furthermore, when chemokine expression in tumors was normalized to that detected in corresponding tumor-free colonic tissues, a strong upregulation of a panel of chemokines including, CCL3-5, CCL7-8, CCL13, CCL20, CCL22, CXCL1-3, CXCL5, CXCL8-12, CXCL16, and CX3CL1, was observed in a subgroup of 11 samples (Figure IV.3). Importantly, these samples also displayed a higher expression of CD8, IRF1, T-bet, Foxp3 and CD16 genes (Figure IV.3).
42 A
B
Figure IV.2: Chemokine gene expression in CRC and corresponding tumor-free colonic tissues.Total cellular RNA was extracted from freshly excised CRC tissues (n = 62) and corresponding tumor-free colonic tissues, and reverse transcribed. Specific gene expression was analyzed by qRT-PCR, using, as reference, GAPDH house-keeping gene. A. CCL family chemokines. B. CXC family chemokines and CX3CL1. Means are indicated by bars. Statistical significance was assessed by Wilcoxon signed rank test (*p<0.05; **p<0.01***p<0.001;).
43 F ig ure IV. 3 : C he m ok in e ge ne ex pr ess io n in C R C a nd tu m or -fr ee co lo nic tis su es . T otal ce llu lar R N A w as ex tr ac ted fr om fr es hly e xci sed C R C ti ss ues (n = 46 ) an d co rresp on din g tu m or -fr ee co lo nic tis su es , an d r ev er se tr an scr ib ed . Sp ec if ic g en e ex pr ess io n w as an aly ze d b y q R T -P C R , u sin g, as r ef er en ce , G A P DH ho us e-kee pin g g en e.
41 3. Correlations between expression of immune cell markers and chemokine genes in CRC
Prompted by these results, we subsequently evaluated in greater detail correlations between expression of the identified chemokines and that of immune cell marker genes (Table VI.2).
Table IV.2: Correlation between gene encoding chemokine and immune cell markers. Total cellular RNA was extracted from freshly excised CRC tissues (n = 62) and corresponding healthy mucosa sampled at distance from the tumor and reverse transcribed. Specific gene expression was analyzed by qRT-PCR, using, as reference, GAPDH house-keeping gene expression. Correlation between CD8; IRF1 and T-bet, Foxp3 and, CD16 and chemokines were found. Spearman r and relative p-values are indicated in the table. Significant correlation coefficients ≥0.3 are indicated in bold.
CCL3 strongly correlated with CD16 and, to a lower extent, with CD8 and IRF1 gene expression. Similarly, CCL4 was strongly associated with CD16, and weakly with CD8 gene expression. CCL5 gene expression strongly correlated with CD8 and, IRF-1, and to a lower extent, with all other genes under investigation. CCL7, CCL8, and CCL13 were associated with expression of CD8 and CD16, and more weakly, with IRF1 gene. CCL20 only correlated with CD8. In contrast, CCL22 expression was associated with all markers, but most strongly with Foxp3 and IRF1. CXCL1, CXCL2, CXCL5 and CXCL8 were found to be only associated with CD16. CXCL9, CXCL10 and CXCL11 positively correlated with the
42 expression of CD16 and to a lower extent with that of T cell markers. CXCL12 expression also correlated with CD16 and all T cell markers. CXCL16 was associated with CD16 and IRF1, and weakly with CD8. Finally, expression of CX3CL1 correlated with CD16 and, to a lower extent, with that of all T cell marker genes.
4. Chemokine receptor expression on CRC infiltrating beneficial immune cells
We next investigated the molecular background underlying these associations. We hypothesized that chemokines associated with expression of specific immune cell markers, might have a role in recruiting the corresponding cell populations into tumor tissues. Therefore, we first verified whether CRC infiltrating CD8+ lymphocytes, CD4+ T helper cells, Tregs and CD16+CD66b+ neutrophils (and corresponding cell populations in tumor
-free colonic tissues and PBMCs) expressed corresponding chemokine receptors.
CRC infiltrating CD8+ T cells expressed CCR5, (binding CCL3-5, CCL8 and CCL13),
CXCR3, (the receptor of CXCL9 and CXCL10) and CXCR4 (specific for CXCL12) on a large fraction of cells, whereas CCR3 (binding CCL7) and CCR6 (the receptor of CCL20) were expressed on smaller subsets. Notably, frequencies of CCR5+, CCR6+, and CXCR4+ cells were significantly increased within tissue infiltrating as compared to peripheral blood CD8+ cells, whereas no significant differences were observed between CD8+ cells infiltrating
CRC or tumor-free colonic tissues nor between peripheral blood lymphocytes from patients
and healthy donors. Unfortunately, expression of the gut homing receptor CCR9 (binding CCL25) could be evaluated only on three CRC samples displaying heterogeneous proportions of CD8+ T cells. Remarkably, percentages of CCR9+ /CD8+ cells in PBMCs were significantly increased in patients as compared to healthy donors. In contrast, cells expressing CCR4 and CX3CR1, binding CCL22 and CX3CL1 respectively, were not detected (data not shown) (Figure IV.4).
43 Figure IV.4: Chemokine receptor expression in CRC infiltrating CD8+ T cells. PBMC from healthy donors or CRC patients, and single cell suspensions obtained from freshly excised clinical specimens of CRC and tumor free colonic tissues were surface stained whit antibodies specific for CD8, in combination with the indicated chemokine receptors. Percentages of positive cells are shown. Means and standard deviation are indicated by bars. Statistical significance was assessed by Mann Whitney test (*p<0.05; **p<0.01; ***p<0.001).
Tumor infiltrating CD4+ (Foxp3-) T helper cells mostly expressed CCR4, CCR5, CXCR3 and
CXCR4. In addition, CCR3, CCR6 and CCR9 were also expressed in smaller cell fractions. In
44
cells. Frequencies of CCR3+, CCR4+, CCR5+ and CXCR4+ cells were significantly higher within tissue infiltrating as compared to PB T helper cells (Figure IV.5).
Figure IV.5: Chemokine receptor expression on CRC infiltrating CD4+ T helper cells. PBMC from healthy donors or CRC patients, and single cell suspensions obtained from freshly excised clinical specimens of CRC and tumor free colonic tissues were surface stained whit antibodies specific for CD4, in combination with the indicated chemokine receptors, and intracellular staining for Foxp3 was then performed. Percentages of CD4+ Foxp3-positive cells are reported. Means and standard deviations are indicated by bars. Statistical significance was assessed by Mann Whitney test (*p<0.05; **p<0.01).
45
CRC infiltrating Tregs also showed prominent expression of CCR4, CCR5, CXCR3 and CXCR4, whereas only small fractions of cells expressed CCR3. Expression of CCR6 and CCR9, evaluated so far on two samples only, also appeared to be limited. Moreover, percentages of CCR5+ and CXCR4+ cells were significantly increased within tissue infiltrating as compared to peripheral blood Tregs, whereas no significant differences were observed between Tregs infiltrating CRC or tumor-free colonic tissues. (Figure IV.6).
Figure IV.6: Chemokine receptor expression on CRC infiltrating Tregs.PBMCs from healthy donors or CRC patients, and single cell suspensions obtained from freshly excised clinical specimens of CRC and tumor free colonic tissues were surface stained with antibodies specific for CD4, in combination with the indicated chemokine receptors. Intracellular staining for Foxp3 was then performed. Percentages of CD4+ Foxp3+ positive cells are shown. Means and standard deviation are indicated by bars. Statistical significance was assessed by Mann Whitney test (*p<0.05; ***p<0.001).
46
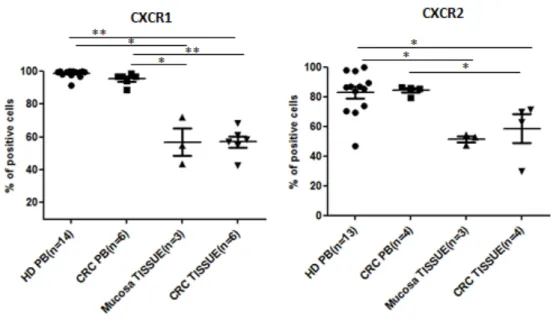
CD16+CD66b+ neutrophils in CRC and mucosa tissues similarly expressed CXCR1 (binding CXCL8) and CXCR2 (binding CXCL1, 2, CXCL5 and CXCL8) on a large cell fraction (approximately up to 60% of cells) This percentage however, appeared to be reduced as compared to that of positive cells among circulating neutrophils of both patients and healthy
donors. In contrast, no expression of CCR3-5, CXCR3-4 and CXCR6 was detected in any
neutrophil populations (Figure IV.7). Furthermore, we detected expression of CX3CR1 on a small neutrophil subset in peripheral blood of healthy donors (data not shown). We are currently evaluating CX3CR1 expression on circulating and tissue infiltrating neutrophils in patients.
Figure IV.7: Chemokine receptor expression on CRC infiltrating CD16+CD66b+ neutrophils. Neutrophils from healthy donors or CRC patients (EasyStep enrichment kit), and single cell suspensions obtained from freshly excised clinical specimens of CRC and tumor free colonic tissues were surface stained with specific antibodies, in combination with the indicated chemokine receptors. Percentages of CD16+ CD66b+ positive cells are shown. Means and standard deviation are indicated by bars. Statistical significance was assessed by Mann Whitney test (*P<0.05; **P<0.01).
In summary, CRC infiltrating immune cell subsets were found to express receptors capable of sensing chemokines whose expression is positively associated with that of immune cell markers in CRC tissues, thus suggesting a role for these chemokines in immune cell recruitment.
47 5. Chemokine signatures underling immune cell recruitment in CRC
Based on chemokine receptor expression profiles and correlations between expression of chemokines and immune cell markers, we could define for each immune cell subset a putative
“chemokine signature” (Figure IV.8):
for CD8+ cells: CCL3, CCL5, CCL8, CCL13, CXCL9, CXCL10 and CXCL12, (and to a minor extent CCL4 and CCL7);
for Th1: CCL5, CCL22, CXCL9 and CXCL12, (and to a minor extent CCL3, CCL7 and CCL13);
for Foxp3: CCL22 and CXCL12, (and to a minor extent CCL5 and CXCL9); for neutrophils: CXCL2 and CXCL5, (and to a minor extent CX3CL1).
Figure IV.8: Schematic representation of putative chemokine signatures for individual immune cell subsets.
6. Chemokine sources in primary CRC
We next investigated potential chemokine sources in CRC. Indeed, different cell types present within the CRC microenvironment including tumor, stromal, endothelial, and immune cells, may contribute to chemokine release. We first focused our attention on the major CRC component, i.e. the tumor cells. We analyzed by RT-PCR the expression of those chemokines found to be upregulated in CRC samples displaying high immune cell infiltration (see Figure
48 IV.3), on total CRC tissues and corresponding purified tumor cells, upon sorting based on expression of EpCAM marker. EpCAM+ cells expressed CCL3, CCL4, CCL20, CXCL1 and CXCL2, at significantly higher levels than total CRC tissues, thus suggesting that tumor cells are a major source of these chemokines. Furthermore, expression of CCL5, CXCL5, CXCL8, CXCL9, CXCL10, CXCL11 CXCL12, and CX3CL1, was also detected in purified EpCAM+ cells, but was not increased as compared to total CRC tissue, possibly indicating that these chemokines are also released by cells other than tumor cells. Finally, CCL7, CCL8, CCL13, and CCL22, were detected in CRC tissue but not in purified tumor cells (Figure IV.9). These results clearly indicated that tumor cells released a number of chemokines relevant for recruitment of CTLs, Th1, Tregs and neutrophils into CRC tissues.
Figure IV.9: Chemokine expression in isolated EpCAM+ cell and CRC tissue. Total cellular RNA was extracted from freshly excised CRC tissues (n= 10) and from EpCAM+ cells (purity > 97%) sorted from corresponding colorectal cancer cell suspensions, obtained upon enzymatic digestion (n=10). Specific gene expression was analyzed by qRT-PCR, using, as reference, GAPDH house-keeping gene. Means are indicated by bars. Statistical significance was assessed by Mann Whitney test (* p<0.05; **p<0.01).
49 7. Effects of microbial stimulation on chemokine production by CRC cells in vitro
Subsequently, we sought to elucidate the stimuli leading to chemokine release by CRC cells. Given the peculiar features of the gut microenvironment, we hypothesized that chemokine production in CRC cells might be induced upon triggering of TLRs, expressed on tumor cells, by microbial stimuli derived from gut flora-, possibly translocated into the lamina propria across the altered gut epithelium [Grivennikov S., et al., 2012]. We therefore first evaluated TLR expression on CRC cells from clinical specimens by flow cytometry. TLR2, TLR3, TLR4 and TLR5 were found to be highly expressed both at surface and intracellularly, whereas TLR6, TLR8, TLR9 and TLR10 were expressed at lower levels. No significant expression of TLR1 and TLR7 was observed (Figure IV.10 A, B). Similar TLR expression profiles were detected on a panel of established CRC cell lines (Figure IV.10 C, D).
Figure IV.10. TLR expression on CRC cells. EpCAM + cells sorted from CRC clinical specimens (A, n=7; B, n=4) and CRC cells from established cell lines (C,D) were surface (A,C) and intracellularly (B,D) stained with antibodies specific for the indicated TLRs. MFI in individual samples or cell lines are shown. Means are indicated by bars.
50
We then investigated, the effects of stimulation by microbial products on CRC cells from established cell lines. Exposure of CRC cells to purified TLR agonists including Poly(I:C),
LPS, Flagellin and FSL-1, binding TLR3, TLR4, TLR5, and TLR2/6 resulted in a significant
upregulation of chemokine genes in all cell lines tested, although to different extents (Figure IV.11), thus indicating that TLRs expressed on CRC cells are functional.
Figure IV.11: CRC cell from the indicated established cell lines were treated with LPS, Poly(I:C), Flagellin and FSL-1 at the indicated concentrations. Following four hours incubation, gene expression levels of the indicated chemokines were analyzed by RT-PCR, using GAPDH housekeeping gene as reference. Data from three independent experiments (A) and from one representative experiment (B, C) are shown. Statistical significance was assessed by two-way ANOVA test (*=p<0.05).
51 Most importantly, when CRC cells were cultured in the presence of different bacterial species known to be abundant in CRC tissues, including Fusobacterium nucleatum, Escherichia Coli,
Bacteroides vulgatus, and Bacteroides Fragilis [Castellarin M., et al., 2012 and Kostic AD., et al., 2013] expression of genes encoding chemokines mediating recruitment of beneficial immune cell populations into CRC, was also observed (Figure IV.12). Thus, gut flora-derived microbial stimuli are capable of triggering chemokine gene expression in CRC cells in vitro.
A
B
Figure IV.12: LS180 cells (A) and Primary CRC cells (B, n=1) were treated with heat-killed preparations of the indicated bacterial strains at the indicated bacteria/tumor cell ratio. After four hours culture, expression levels of the indicated chemokine genes were analyzed by RT-PCR, using GAPDH housekeeping gene as reference. Cumulative data from four independent experiments are shown (A). Statistical significance was assessed by two-way ANOVA test (*=p<0.05).
52 8. Effects of microbial stimulation on chemokine production in vivo
In order to investigate the impact of the gut flora on chemokine production by CRC cells in vivo, we evaluated gene expression levels of the selected chemokine gene panel in tumor xenografts generated upon subcutaneous or intracecal injection of CRC cells from established cell lines in immunodeficient NSG mice. Whereas subcutaneous xenografts displayed chemokine gene expression levels comparable to those of in vitro cultured CRC cells, intracecal xenografts showed strong upregulation of a number of chemokines, including CCL5, CCL20, CXCL1, CXCL2, CXCL5, CXCL8, and CXCL10 (Figure IV.13). These results suggest that exposure to gut environment promotes chemokine gene expression in CRC cells.
Figure IV.13: NSG mice were inoculated subcutaneously (n=8) or intracecally (n=14) with LS180 cells (10^5 cells/mouse). Following tumor development, xenografts were removed and expression levels of the indicated chemokine genes were analyzed by RT-PCR, using GAPDH housekeeping gene as reference, in comparison to those detectable in in vitro cultured LS180 cells. Statistical significance was assessed by two-way ANOVA test (*= p<0.05).
To further verify whether gut commensal bacteria play a role in this phenomenon, we evaluated the effect of antibiotic administration to tumor bearing mice on chemokine expression detected in intracoecal xenografts. Strikingly, expression of different chemokine genes, including CCL5, CCL20, CXCL5, and CXCL10, was significantly reduced in intracecal xenografts of treated mice as compared to controls (Figure IV.14). Moreover,
53 expression levels of CCL5, CCL20 and CXCL5 genes significantly correlated with bacterial loads (r=0.671 p=0.002; r=0.484, p=0.042; r=0.545, p=0.019, respectively). Thus, gut commensal bacteria promote the expression of genes encoding chemokines putatively contributing to CRC infiltration by immune cells.
Figure IV.14: NSG mice were inoculated subcutaneously (n=4) or intracecally (n=18) with LS180 cells (10^5 cells/mouse). Following tumor development, a group of mice (n=10) bearing intracecal xenografts were treated with Ampicillin and Vancomycin for three weeks. Xenografts were then removed and expression levels of the indicated chemokine genes and bacterial 16s were analyzed b

![Figure I.5: Chemokine receptor ligation and activation events. [Chensue SW., et al., 2001]](https://thumb-us.123doks.com/thumbv2/123dok_us/374815.2541310/20.892.291.597.273.672/figure-chemokine-receptor-ligation-activation-events-chensue-sw.webp)
![Figure I.6: Anatomy of the intestinal immune system [Abreu MT., 2010].](https://thumb-us.123doks.com/thumbv2/123dok_us/374815.2541310/23.892.110.775.597.950/figure-i-anatomy-intestinal-immune-abreu-mt.webp)
![Figure I.8: Mammalian TLR signalling pathways [O’ Neill L., et al., 2013].](https://thumb-us.123doks.com/thumbv2/123dok_us/374815.2541310/28.892.169.720.381.866/figure-i-mammalian-tlr-signalling-pathways-o-neill.webp)