machine learning approach for feature selection traffic classification using
security analysis.
Journal of Supercomputing, 74 (10). pp. 4867-4892. ISSN
0920-8542
Downloaded from:
http://e-space.mmu.ac.uk/622917/
Version:
Accepted Version
Publisher:
Springer
DOI:
https://doi.org/10.1007/s11227-018-2263-3
Please cite the published version
A machine learning approach for feature selection
traffic classification using security analysis
Muhammad Shafiq1 · Xiangzhan Yu1 ·
Ali Kashif Bashir2 · Hassan Nazeer Chaudhry3 · Dawei Wang4
© Springer Science+Business Media, LLC, part of Springer Nature 2018
Abstract Class imbalance has become a big problem that leads to inaccurate traffic classification. Accurate traffic classification of traffic flows helps us in security mon-itoring, IP management, intrusion detection, etc. To address the traffic classification problem, in literature, machine learning (ML) approaches are widely used. Therefore, in this paper, we also proposed an ML-based hybrid feature selection algorithm named WMI_AUC that make use of two metrics: weighted mutual information (WMI) met-ric and area under ROC curve (AUC). These metmet-rics select effective features from a traffic flow. However, in order to select robust features from the selected features, we proposed robust features selection algorithm. The proposed approach increases the accuracy of ML classifiers and helps in detecting malicious traffic. We evaluate
B
Muhammad Shafiq[email protected] Xiangzhan Yu
[email protected] Ali Kashif Bashir [email protected] Hassan Nazeer Chaudhry [email protected] Dawei Wang
1 School of Computer Science and Technology, Harbin Institute of Technology, Harbin 150001,
China
2 Faculty of Science and Technology, University of Faroe Islands, Faroe Islands, Denmark 3 Department of Electronics, Information and Bioengineering, Politecnico di Milano, Milan, Italy 4 National Computer Network Emergency Response Technical Team/Coordination Center, Beijing,
our work using 11 well-known ML classifiers on the different network environment traces datasets. Experimental results showed that our algorithms achieve more than 95% flow accuracy results.
Keywords Network traffic classification·Class imbalance·Feature selection· Machine learning·Security
1 Introduction
Accurate flow traffic classification has potential to solve challenging network problems including network security monitoring, IP management, intrusion detection [1]. From the network management perspective, it helps Internet Service Providers (ISPs) to manage, control and understand the changing bandwidth requirements and behaviors of traffics such as Voice over IP (VoIP) and video conferencing traffic. From the security perspective, it helps blocking attackers and unwanted traffic.
To improve the performance of accurate flow traffic classification, several models have been proposed in the literature [1,2]. Among them,port-basedandpayload-based techniques are the most known traditional ones. Theport-basedtechnique use well-known port numbers for internet traffic identification such as for SMTP is 25, DNS is 53 and HTTP uses port number 80. Althoughport-basedmethods are easier to deploy, however, their performance cannot attain over 50–70% accuracy [3] due to several challenges including dynamic port switching, e.g., P2P and security configurations over ports [4]. Moreover, usingport-basedtechniques we cannot identify and classify several applications as they use encryption methods to avoid from being detected. Payload-based also known as deep packet inspection (DPI) technique was proposed to mitigate security restraints over ports. Instead of scanning ports, DPI inspects payload’s signatures to identify certain packets [5–7]. Though this technique improves traffic classification performance, but is against the privacy laws and regulations of some applications, hence, not allowed to inspect the payload of packets.
To overcome the limitations ofpayload-basedtechnique [3,8], machine learning (ML)-based techniques are proposed that uses a special attribute called feature that is derived from the traffic flow statistics. ML techniques are based on training and testing datasets to identify traffic. However, the traffic loads on internet vary from time to time resulting in imbalance traffic flows [8,9], hence inaccurate flow feature selection. In this paper, all these are being researched under the class imbalance problem. Class imbalance plays an important role in security analysis and identification of malicious traffic that leads to the identification of inaccurate traffic as proposed by Singh et al. [9]. Therefore, it is hard to train the ML classifiers for traffic identification. Thus, class imbalance and inaccurate feature selection becomes a challenging problem.
Class imbalance refers to the classification of ML in which algorithms tend to generate more traffic as compared to other applications traffic. In 2010, Labovitz et al. [10] showed that HTTP traffic always generate more flows compared to other applications, e.g., VoIP, P2P. Since HTTP flows are higher, ML classifiers achieve more accuracy in comparison with applications that produce less flows. Therefore, it
is important to design a method for flow classification that solves such kind of class imbalance problem.
In this paper, we propose a hybrid mechanism called WMI_AUC to overcome the class imbalance problem. Our algorithm WMI_AUC includes two different metrics for feature selection: (1) weighted mutual information (WMI) and (2) area under ROC curve (AUC). Mutual information is a known technique that defines relationship between two packets. In literature, this is intensively used for feature selection [11,12]. Whereas, AUC is also a known metric used to define the performance of ML classifiers [13,14]. In this work, for the first time in ML classification research, we propose to use both metrics together that help in the selection effective features in imbalance traffic classification. Together, they also increase the accuracy of ML classifiers. However, in order to select robust features from the selected features, we proposed RFS algorithm. The detailed contribution of work is given below:
• Our proposed algorithm searches the highest WMI values and then assigns them to features that help in differentiating the minority class from the majority class. After filtering the features with WMI metric, WMI_AUC selects the features that achieve the highest AUC value of specific ML classifier. However, we use WMI metric combined with AUC metric. In order to deal with the robust and stable features selection problem, we design robust features selection (RFS) algorithm. The proposed algorithm is able to select the robust and stable features from the results achieved by WMI_AUC algorithm on different utilized used datasets. • RFS algorithm includes two steps: occurrence frequency of the selected features
and mean of metric values of the selected features. Dealing with the impact of class imbalance in instant messaging (IM) flow-based traffic classification, we present the robust selected features and report their metric values.
• Our experimental results show that flow-based selected features are marked as discriminative power features for classifying IM imbalance applications traffic and can achieve more than 95% accuracy.
The rest of the paper is organized as follows: Sect.2demonstrates related work. The detailed methodology and our proposed WMI_AUC and RFS algorithms are given in Sect.3. Section4discusses the evaluation. Section5presents the experimental results and analysis, while some analysis and discussions are given in Sect.6. At the end, Sect.7concludes our paper and discusses the future work.
2 Related work
In our previous works [15–17], we applied ML algorithms in flow-based identifica-tion for the classificaidentifica-tion of IM applicaidentifica-tions, we achieved high promising accuracy results and improved the performance of the utilized ML algorithms. Similarly, sev-eral studies in the past [8,18–24] have also applied ML algorithms for flow-based traffic classification, bandwidth management and security analysis. However, most of them are related to improving the performance of classification using ML algorithms. These proposed approaches were able to achieve more than 80% flow classification accuracy using different network environment datasets. Considering the flow classi-fication accuracy, class imbalance also affects the performance of the conducted ML
algorithms. It is difficult for the traditional ML algorithms to classify internet traffic accurately when the data distribution is imbalance and changes occur time to time. These data distribution imbalance changes arise sufficient in IM applications traffics and most of the literature works classify these traffic with less accuracy values about 80% due to ineffective features selection which is less accuracy for accurate traffic classification. This paper for the time studies the IM application imbalance traffic flow classification using effective features selection. In 2007, Auld et al. [20] found that, in training data, the accuracies of applications differ with respect to the number of instances of that application. They collected their training data with majority class of WWW traffic application whose accuracy reached up to 99.8% in the best case, and 70% in average case. To overcome the imbalance problem and maximize the average class accuracy, they used sampling method and form each class with the same pro-portion of training data. Similarly, Cieslak et al. [21] also used the sampling method for imbalance problem in network intrusion data sets. But, due to altering the original class distribution, the sampling methods were criticized. Nechay et al. [22] proposed two different novel ML classifiers based on Neyman–Pearson and Learning Satisfia-bility framework. Chen and Wasikowski [25] pointed out that it is more difficult for solve class imbalance when the dimensionality is very high. They also point out that it is very difficult for both the sampling methods and algorithmic methods to solve the class imbalance problem effectively when the dimensionality of flow-based features is very high.
Feature selection is very crucial for handling class imbalance problem and to man-age security policy. In 2000, Der Puttern and Somere [26] showed that feature selection is more important as compared to classification algorithm for the optimization of per-formance. They showed that feature selection technique is more important as compared to classification classifiers. However, most of the proposed techniques failed to con-sider the relation between class distribution and features selection [8,20,23,27,28] which does not give very promising classification results. In 2010, Lim et al. [29] studied and analyzed the traffic flow features. They also studied the impact of class distribution on features. To understand the feature selection metrics, Zheng et al. [28] studied and analyzed feature selection metrics that affected the classification performance. Chen et al. [25] presented feature selection metrics using approxi-mation to the area under curve (ROC) metric. Similarly, for the effective features selection Kamal et al. [30] proposed feature selection techniques to identify sig-nificant features from imbalanced data sets. The proposed techniques are balanced minority repeat, higher weight and differential minority repeat. Wasikowski and Chen [31] compared seven feature metrics and develop three different types of method considering imbalance traffic classification. They showed that signal to noise cor-relation coefficient and feature assessment by sliding thresholds (FAST) are very effective for feature selection in imbalanced traffic classification. More et al. [32] presented feature selection and feature extraction methods for internet traffic classi-fication. They used whole flow and extracted 248 statistical features such as packet size, average packet size, maximum and minimum statistical features. Using these statistical features, they got very promising performance results for internet traffic classification. However, but in real circumstances, it is not effective for network traf-fic classitraf-fication [33]. Recently, in 2012 Zhang et al. [13] proposed two different
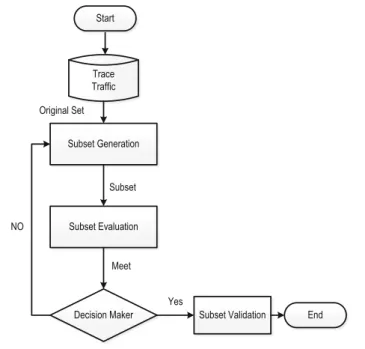
Subset Generation Subset Evaluation Decision Maker Original Set Subset Meet Yes NO Subset Validation Trace Traffic Start End
Fig. 1 Feature selection process
algorithms for imbalance traffic classification. They select robust features with AUC metrics for traffic flow classification. Moreover, they used true positive rate (TPR) and false positive rate (FPR) for the experimental results evaluations and also showed that their proposed algorithms can achieve more than 90% flow accuracy results for traffic flow classification. In 2016 Peng et al. [34] showed and analyzed the effec-tiveness of statistical features for early stage internet traffic classification. Bernaille et al. [35] studied features selection problem and select packet size as a feature, while extract some statistical features from it. They used K-Means, GMM and HMM model for internet traffic classification. Lim et al. [29] extract statistical features from packet size and used the extracted features with connection level for internet traffic classification.
However, studying the above given literature, it is important to select the effective and stable features for IM imbalance traffic flow classification. In Fig.1we have shown the basic concept of effective feature selection process consisting of four steps: on subset generation, subset evaluation, decision maker and subset validation. A feature is selected if it contains all the required information, otherwise discarded.
To solve the above-mentioned problem, in this paper, we propose two different features selection algorithms known as WMI_ AUC and RFS for the classification of IM application accurately. WMI_AUC algorithm proposed to handle class imbal-ance problem when the traffic flow dimensional are very high. It is very important for the internet traffic flow classification, when the whole network application traf-fic flow distribution is imbalanced. After selecting features based on WMI_AUC algorithm, RFS algorithm is used to select robust features for IM application traffic classification.
Dataset Feature Set WMI_AUC
Alogorithm Selected Set
RFS Algorithm Best Features Set Final Set Validation Start End
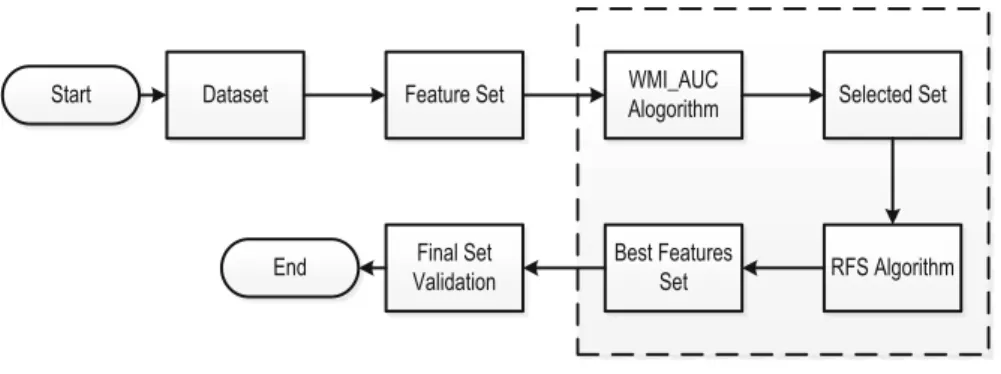
Fig. 2 Feature selection process
3 Methodology
In this section, we explained our proposed WMI_AUC and RFS algorithms in details. We first analyze the problem of features metric that is based on (MI) analysis. There-after, we present WMI feature metric and design WMI_AUC algorithm combined with AUC metric for the imbalance traffic classification. Then we used RFS algorithm to select robust features from the features selected by WMI_AUC algorithms. Our pro-posed model is shown in Fig.2. WMI_AUC algorithm details are given in Sect.3.2.1
while the RFS algorithm details are shown in 3.2.2.
In the first step, datasets are developed in two different network environment named HIT Trace 1 and NIMS dataset. Then 23 statistical features are extracted. In the third step, the proposed algorithm is used for the selection of effective features, which is the combination of WMI metric and AUC metric. After applying WMI_AUC algorithm the control pass to Selected Setstep to group and sort the selected features. Now to overcome the class imbalance problem and filter the results achieved by propose algorithm, RFS algorithm is conducted. RFS algorithm selects the features that are efficient for imbalance traffic classification. And then the control transfer to theBest Features Set includes on effective features. Finally the ML classifiers are conducted in theFinal Set Validationstep to validate the selected features selected by proposed algorithms. The details descriptions are given below.
3.1 Feature selection metrics
3.1.1 Metric based on MI
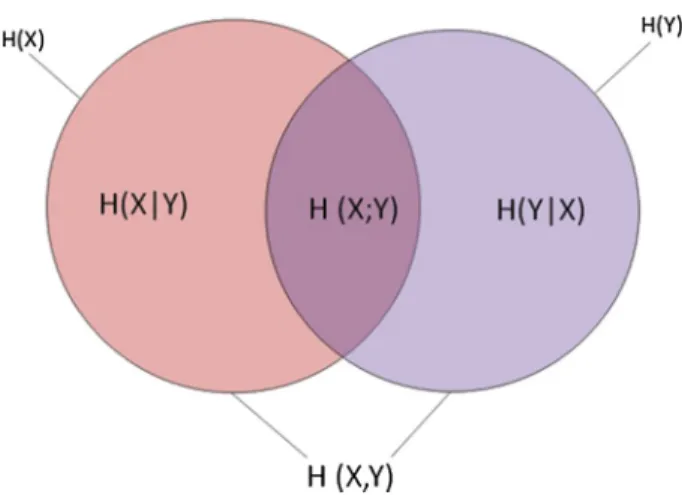
Mutual information (MI) is extensively used for feature selection [11], image process-ing [12], and speech recognition [36] and so on. It is the measure between two random variables X and Y of mutual dependences. It states the amount of information held by random variable. In information theory, it is defined as:
I(X;Y)=H(X)−H(X|Y) =H(Y)−H(Y|X)
Fig. 3 The relationship between mutual information and entropies
=H(X)+H(Y)−H(X,Y)
=H(X,Y)−H(X|Y)−H(Y|X) (1) In Eq. (1), H(X)andH(Y)are the marginal entropies of X andY, respectively, while theH(X|Y)andH(Y|X)are the conditional entropies. Similarly, the joint entropy of X andY isH(X,Y).From the perspective of set theory, the relationships among H(X),H(Y),H(X|Y),H(X, Y)andI(X;Y)are shown in Fig.3. According to Shan-non’s definition of entropy [37], we have:
H(X)= − xX p(x)log(p(x)) (2) H(Y)= − xY p(Y)log(p(y)) (3) H(X;Y)= − xY yY p(x,y)log(p(x,y)) (4) where p(.)shows the probability function of random variables. As in [38] for MI analysis, they use Eq. (3) in Eq. (1). We use the same method that they have applied formutual informationanalysis.
H(X;Y)= − xX yY p(x,y)log p(x,y) p(x)p(y) (5)
While for continuous random variables, the summation is replaced by a definite double integral: I(X;Y)= y x p(x,y)log p(x,y) p(x)p(y) dxdy (6)
3.1.2 Weighted mutual information (WMI) metric
To address the class imbalance problem, we use WMI metric based on weighted entropy. If the total number of featuresN, the weight value is calculated as:
Wi =1−
ni
N (7)
In Eq. (7)nishows the number of feature assigned to features set, then we can get the weighted WMI between two variables describe as:
Iw(X;Y)=Hw(X)−Hw(X|Y) =Hw(X)−Hw(X|Y)
=Hw(X)+Hw(X|Y)−Hw(X|Y)
=Hw(X)−Hw(X|Y)−Hw(X|Y) (8) In Eq. (8),Hw(X)andHw(Y)are the marginal entropies ofXandY, respectively, while the Hw(X|Y)and Hw(Y|X) are the conditional entropies. Similarly, the joint entropy ofXandY isHw(X,Y).From the perspective of set theory, the relationship amongHw(X),Hw(Y),Hw(X|Y),Hw(X,Y)andIw(X;Y). According to Shannon’s definition of entropy, we have:
Hw(X)= − x=X wip(x)log(p(x)) (9) Hw(Y)= − x=Y wip(y)log(p(y)) (10) Hw(X,Y)= − xX yY wip(x)log(p(x)) (11)
Whereas, for continuous random variables, the summation is substituted by a defi-nite double integral:
Iw(X;Y)= y x wi p(x,y)log w i p(x,y) wip(x)p(y) dxdy (12)
For the analysis of mutual information computation, there is several open source software. These software packages are freely available over internet, but for our study we use Pengs mutual information MATLAB toolbox [37].
3.1.3 Area under the Curve (AUC) metric
After using WMI metric, it is important to select the optimal features for a particular ML classifier from the selected data. For this purpose, we applied wrapper method
which is based on area under the ROC curve (AUC) metric. However, for the classifica-tion of applicaclassifica-tion, it is important to use accuracy (ACC) metric. But due to imbalance traffic flow classification, AUC metric is better than accuracy metric for this study and useful to rank the features. In this paper, the highest AUC metric values show that ML classifier can get effective performance results. AUC metric is very useful for measuring the performance in imbalanced data. Therefore, we use AUC metric to rank the features and select those feature which gives the highest AUC metric values.
3.2 Feature selection algorithms
In this section, we present our two features selection algorithms: WMI_AUC and RFS, respectively. WMI_AUC first filters most of the features with WMI metric and then filters the selected features with the highest AUC metric for a particular ML classifiers. RFS algorithm is used to select the optimum features from the features selected by WMI_AUC algorithm. Both of the algorithms are given in detail in the following sections.
3.2.1 WMI_AUC algorithm
In this subsection, we describe WMI_AUC with pseudo code as shown in Fig.4. As we discussed in the above sections, the dimension of features is always high with respective traffic classification. Thus we filter most of the features with WMI metric to select effective features which is correlated to each other.
In our proposed algorithm, there are two steps. Step 1 is given in line 1–10 in Fig.4. Let’s say given data set is D with M classes and N features. In Fig.4, WMI_AUC algorithm filters most of the features with WMI value. The weight values for each features (line 3) is calculated according to Eq.6. (illustrated in Sect.3.1.2). A good feature has greater MI values related to other features. WMI_AUC firstly calculates the value of WMI between each features (line 6). However, if the value of WMI is greater than the predetermined threshold value (line 7), it inserts features in the list in descending order. The greater threshold value speeds up the feature selection process, but decreases the classification accuracy [34]. Thereafter, in line 11 the algorithm will get the list of WMI features set.
In the second step (line 13–26), WMI_AUC algorithm selects effective features with AUC metric for a particular ML classifier. It gets the features from the desire list one by one and find the features that produce high AUC (accuracy) value. Exactly, from line 13–16, firstly it achieves the values of AUC based on Swrapperwhich consists
on first feature list and then it takes the next feature from the list and inserts it into the Swrapper. If the value of features that inserted new feature is of low AUC value,
WMI_AUC algorithms remove the features from the list in line 21. Lastly, the Swrapper
includes the effective features set.
3.2.2 Robust feature selection (RFS) algorithm
Though, our proposed WMI_AUC algorithm selects effective features to handle the problem of imbalance traffic flows. But due to the diverse traffic distribution of classes,
Fig. 4 WMI_AUC algorithm
the selected features are not similar. Thus, it is significant to select the robust feature set. For this, RFS algorithm selects features that have the highest mean metrics. Highest mean metric value means that the features contribute more in traffic classification. The detailed pseudo code is given in Fig.5.
The WMI_AUC algorithm form the features into subsetfeature[].Nis the numbers of training data set, whilemeanis the mean metric. RFS selects the most effective feature from the WMI_AUC given features set subsetfeature[]. In the RFS algorithm (line 2–5),L is the number of features selected by WMI_AUC andfreq[]is an array used for storing occurrence frequencies of the WMI_AUC algorithm. The RFS algo-rithm (line 6–13) counts the occurrence frequency of the features in training data set. However, in line (13–15) normalized the features set and then compute the mean of features in training data set. RFS algorithm selects the features that have the highest mean metric values. If the occurrence of each feature is lower than other features, RFS deletes the feature and passed it to other feature. Finally, the robust features robustfeature[]includes the effective and accurate features.
Fig. 5 RFS algorithm
4 Evaluation methodology
This section includes traffic datasets and evaluation criteria used in our experimental work.
4.1 Data sets
In this study, we used two different network environment datasets given in Sect.4.1.1. We use two data sets to show that our approach is not only suitable for only a specific
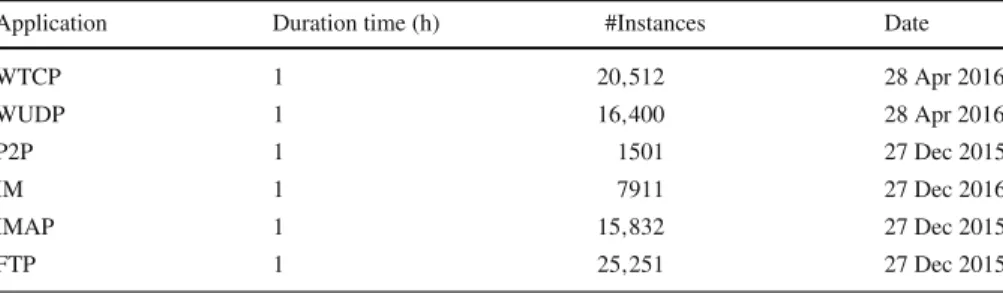
Table 1 Characteristics of HIT trace 1 data set
Application Duration time (h) #Instances Date
WTCP 1 20,512 28 Apr 2016 WUDP 1 16,400 28 Apr 2016 P2P 1 1501 27 Dec 2015 IM 1 7911 27 Dec 2016 IMAP 1 15,832 27 Dec 2015 FTP 1 25,251 27 Dec 2015
trace dataset, but suitable for both large and small number of instances dataset. There-fore, we applied our approach on both dataset. The detailed descriptions are given below.
4.1.1 HIT trace I dataset
To develop HIT Trace I dataset, we captured WeChat (messenger) four functionalities: text messages, pictures messages, audio calls and video calls traffic. Includes TCP, UDP traffic and four other applications traffic such as P2P, IM, IMAP and FTP appli-cations traffic. In this study work, we are interested to find out the effective number of features for WeChat and other applications in imbalance traffic flows.For this, we first captured WeChat application traffic of text messages, pictures messages, audio call and video call using wire shark tool [39] at our lab in School of Computer Science and Technology, Harbin Institute of Technology Harbin China at 27 December 2015 and 28 April 2016, respectively. But we select the traffic that none zero payload packets. In this process of capturing, we are interested to capture WeChat TCP, UDP traffics of text messages, pictures messages, audio call and video call. Thereafter, we also capture P2P, IM, IMAP and FTP traffics. After capturing the traffic, the trace file is saved as dot PCAP extinction (.PCAP). The characteristics of datasets are given in Table1. However, WTCP mean WeChat TCP traffic and WUDP also WeChat UDP traffic.
4.1.2 NIMS dataset
NIMS data set includes packets collected at the authors’ research tested network. The data set consists on SSH servers outside connection and application behaviors traffic such as DNS, HTTP, SFTP and P2P traffic. However, we are interested in instant messaging application traffic classification. In this case, we also added NIMS GTalk trace traffic, which includes TCP Gtalk traffic and UDP Gtalk Traffic. Moreover, in NIMS data set, we select only DNS, HTTP, SFTP, Gtalk TCP and Gtalk UPD traffic for our research work study. The detailed characteristics of NIMS data are shown in Table2.
Table 2 Characteristics of NIMS data set [40]
Application #Instances Location Date
GTalkTCP 482 Dalhousie University network 2010
GTalkUDP 9176 Dalhousie University network 2010
DNS 12,734 Dalhousie University network 2010
FTP 1728 Dalhousie University network 2010
HTTP 3840 Dalhousie University network 2010
SFTP 2269 Dalhousie University network 2010
4.1.3 Flow-based features
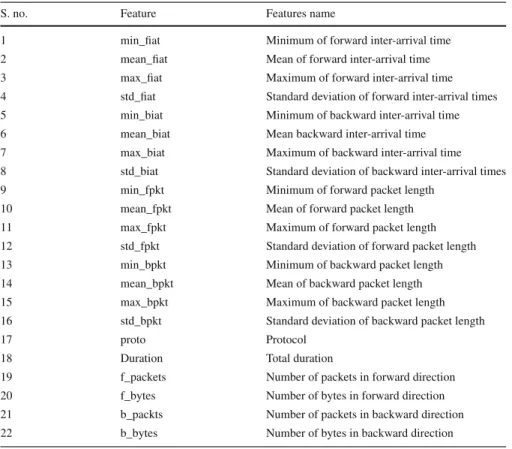
In this research study, we use the trace traffic as a bidirectional flows connection between the two hosts, where the both hosts have the same 5-tuple for instance source and destination IP address, source and destination port numbers and protocol etc. The forward flows are client to server, while server to clients are backward direction flows. However, we use NetMate tool [40] for the extraction of flow statistical features as shown in Table3. While the effective features selected by our proposed approach are (1) min_fpktl (2) mean_bpktl (3) max_bpktl (4) mean_biat (5) std_biat (6) total_fvolume and carry enough classification information for IM network traffic classification.
4.1.4 Evaluation criteria for performance measurements
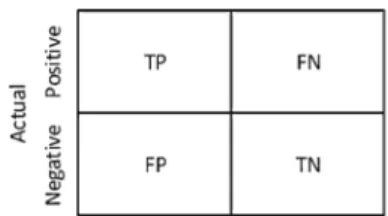
For the measurement of classification performance results, the confusion metrics is the important and fundamental base of traffic identification measurements. Figure6shows the confusion matrix with graphical details for traffic classification measurements evaluation. In Fig.6row includes actual class’s instances, while column represents predicted class instances.
The performance measurements that we used in this paper are described as below:
(i) True Positive (TP)it means that Class Z is truly classified as belonging to Class Z.
(ii) True Negative (TN)it means that Class Z is truly classified as not belonging to Class Z.
(iii) False Positive (FP)it means that Class Z is not truly identified as belonging to Class Z.
(iv) False Negative (FN)it means that Class Z is not truly identified as belonging to Class Z.
Using these metrics, different performance measurement metrics can be made for the classification performance evaluation [14,41]. It should be noted that classifiers always minimize the FP and FN metrics values. In this regard, we choose accuracy, sensitivity, specificity and AUC metrics for our classification performance evaluations defined as follows.
Table 3 Features used in this study
S. no. Feature Features name
1 min_fiat Minimum of forward inter-arrival time 2 mean_fiat Mean of forward inter-arrival time 3 max_fiat Maximum of forward inter-arrival time 4 std_fiat Standard deviation of forward inter-arrival times 5 min_biat Minimum of backward inter-arrival time 6 mean_biat Mean backward inter-arrival time 7 max_biat Maximum of backward inter-arrival time 8 std_biat Standard deviation of backward inter-arrival times 9 min_fpkt Minimum of forward packet length
10 mean_fpkt Mean of forward packet length 11 max_fpkt Maximum of forward packet length 12 std_fpkt Standard deviation of forward packet length 13 min_bpkt Minimum of backward packet length 14 mean_bpkt Mean of backward packet length 15 max_bpkt Maximum of backward packet length 16 std_bpkt Standard deviation of backward packet length
17 proto Protocol
18 Duration Total duration
19 f_packets Number of packets in forward direction 20 f_bytes Number of bytes in forward direction 21 b_packts Number of packets in backward direction 22 b_bytes Number of bytes in backward direction
(i) AccuracyClassification accuracy can be defined as the correctly classified traffic flows in overall classified traffic flows. Using the above performance measure-ment metrics mathematically, accuracy metrics can be defined as the sum of True Positive (TP) and True Negative (TN) over sum of True Positive (TP), True Negative (TN), False Positive (FP) and False Negative (FN) as
Accuracy= TP + TN
TP + TN + FP + FN (13) We used Eq.1accuracy metric to measure the performance of classifier. It gives the overall effectiveness of classification model.
(ii) SensitivityIt is important to note that sensitivity is also known as recall metric. Sensitivity and recall are the same metrics used in Internet traffic classification. However, sensitivity is the True Positive (TP) divided by sum of True Positive (TP) and False Negative (FN). Thus Eq. (14) can be used for sensitivity metric.
Sensitivity= TP
Fig. 6 Confusion matrix for classification results evaluation
(iii) Specificity It can be described as to classify negative results. In other words, the ability of ML classifier to identify negative results. Equation (15) shows the mathematically formula for specificity metric.
Specificity= TN
FP + TNFPR (15) (iv) Area under CurveIt is known as receiver operating characteristics (ROC) [14] . AUC metric can define the performance of ML classifier. In other words, AUC metric shows the trade-off between TPR and FPR, while TPR metric is known as sensitivity and FPR is specificity. Thus we can easily compute the AUC metric by using the confusion metric.
AUC= 1+TPR−FPR 2
Since Specificity=FPR and Sensitivity = TPR (16) Replacing FPR by Specificity and TPR by Sensitivity, we can get
AUC=Sensitivity+Specificity
2 (17)
Equation (17) shows the AUC metric. Furthermore, it also shows the average of specificity and sensitivity.
5 Experimental results and analysis
In this section, we explain the experimental results and analysis. Firstly, we will explain the results analysis of HIT Trace 1 dataset and then NIMS dataset with details applied methods to validate our proposed methods.
5.1 Analysis results of HIT trace 1 dataset
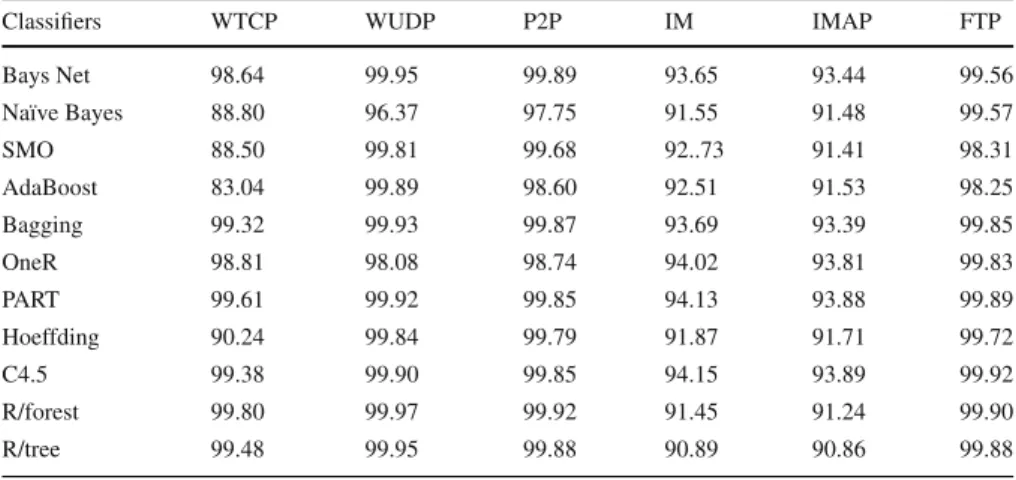
Figure7shows the accuracy results of the HIT Trace 1 Dataset while the details results are shown in Table4. The applied ML classifiers get promising accuracy results using selected features set which are selected by our proposed method. However, support
BayesNet NaiveBayes SMO AdaBoost Bagging OneR Part Hoeffding C4.5 Rforest R/Tree TCP UDP P2P IM IMAP FTP
Fig. 7 Accuracy result for HIT dataset
Table 4 Accuracy results for HIT trace 1 dataset
Classifiers WTCP WUDP P2P IM IMAP FTP
Bays Net 98.64 99.95 99.89 93.65 93.44 99.56 Naïve Bayes 88.80 96.37 97.75 91.55 91.48 99.57 SMO 88.50 99.81 99.68 92..73 91.41 98.31 AdaBoost 83.04 99.89 98.60 92.51 91.53 98.25 Bagging 99.32 99.93 99.87 93.69 93.39 99.85 OneR 98.81 98.08 98.74 94.02 93.81 99.83 PART 99.61 99.92 99.85 94.13 93.88 99.89 Hoeffding 90.24 99.84 99.79 91.87 91.71 99.72 C4.5 99.38 99.90 99.85 94.15 93.89 99.92 R/forest 99.80 99.97 99.92 91.45 91.24 99.90 R/tree 99.48 99.95 99.88 90.89 90.86 99.88
vector machine (SVM) ML classifier gets low accuracy results for IM traffic, AdaBoost ML classifier also get slightly low accuracy results for TCP traffic only.
The remaining all ML classifiers get very effective accuracy results and classify all the HIT Trace 1 dataset traffic very accurately. Thus PART ML classifier gets the maximum accuracy results for HIT Trace 1 dataset 97.88%. Similarly, FTP application traffics are accurately classified as compared to other applications traffics which is about 99.51%, and then P2P traffics are classified very effectively. However, all the applications traffics flows are classified very effectively using ML algorithms and get very promising accuracy results for HIT Trace 1 data set.
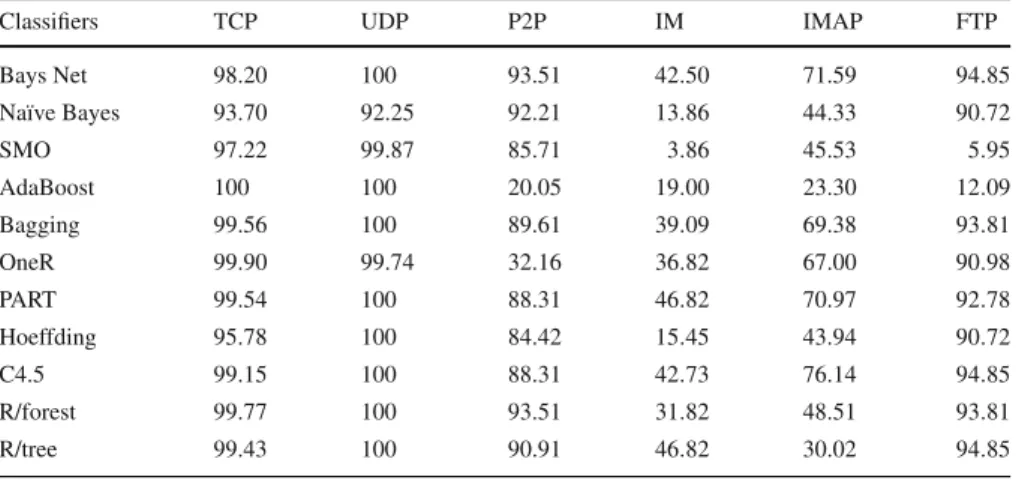
Figure8shows the sensitivity results of HIT Trace 1 dataset and detailed results are shown in Table5. From the figure, it is clear that TCP and UDP traffics are effectively classified with respective to sensitivity results and the remaining applications slightly get low sensitivity results for the HIT Trace 1 dataset. However, all the applications
BayesNet NaiveBayes SMO AdaBoost Bagging OneR Part Hoeffding C4.5 Rforest R/Tree TCP UDP P2P IM IMAP FTP
Fig. 8 Sensitivity result for HIT data set
Table 5 Sensitivity result for HIT data set
Classifiers TCP UDP P2P IM IMAP FTP
Bays Net 98.20 100 93.51 42.50 71.59 94.85 Naïve Bayes 93.70 92.25 92.21 13.86 44.33 90.72 SMO 97.22 99.87 85.71 3.86 45.53 5.95 AdaBoost 100 100 20.05 19.00 23.30 12.09 Bagging 99.56 100 89.61 39.09 69.38 93.81 OneR 99.90 99.74 32.16 36.82 67.00 90.98 PART 99.54 100 88.31 46.82 70.97 92.78 Hoeffding 95.78 100 84.42 15.45 43.94 90.72 C4.5 99.15 100 88.31 42.73 76.14 94.85 R/forest 99.77 100 93.51 31.82 48.51 93.81 R/tree 99.43 100 90.91 46.82 30.02 94.85
traffics are classified very effectively. Similarly, all the applied ML classifiers get very promising sensitivity results, but Bayes Net ML classifier get the maximum sensitivity results for HIT Trace 1 dataset and then Bagging ML classifier get the maximum sensitivity results, while the performance of AdaBoost ML is very low for P2P, IM, IMAP and FTP, but for UDP and TCP traffic AdaBoost ML classifier give very effectively sensitivity results.
Furthermore, SMO classifier also gets low sensitivity results for IM application traf-fic, but their performance results are continuously increasing with respect to sensitivity results for HIT Trace 1 dataset.
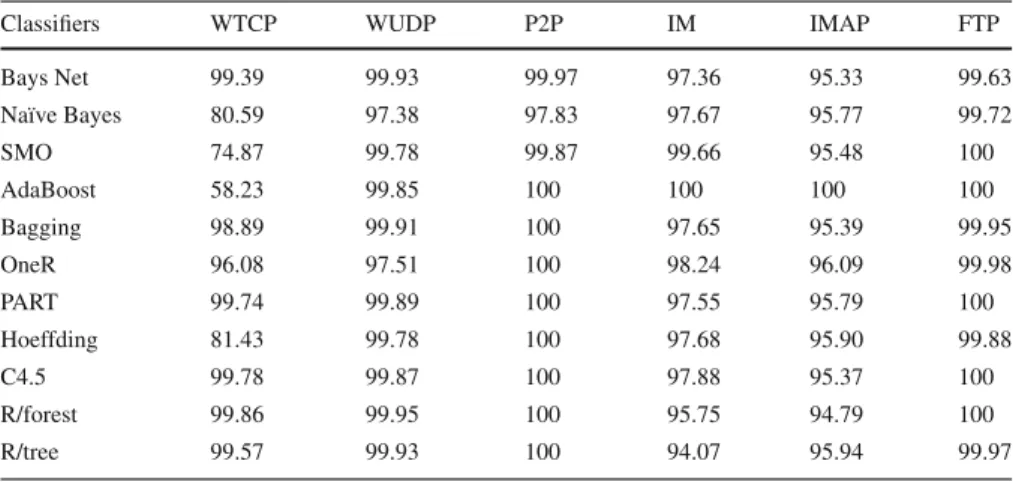
Table6and Fig.9show the specificity results for HIT Trace 1 data set, respectively. From the figure and table, it is evident that all the applied ML classifiers gets very effective specificity result for HIT Trace 1 dataset. However, only for TCP traffics, the applied ML algorithms got slightly low specificity results as compared to other
Table 6 Specificity result for HIT data set
Classifiers WTCP WUDP P2P IM IMAP FTP
Bays Net 99.39 99.93 99.97 97.36 95.33 99.63 Naïve Bayes 80.59 97.38 97.83 97.67 95.77 99.72 SMO 74.87 99.78 99.87 99.66 95.48 100 AdaBoost 58.23 99.85 100 100 100 100 Bagging 98.89 99.91 100 97.65 95.39 99.95 OneR 96.08 97.51 100 98.24 96.09 99.98 PART 99.74 99.89 100 97.55 95.79 100 Hoeffding 81.43 99.78 100 97.68 95.90 99.88 C4.5 99.78 99.87 100 97.88 95.37 100 R/forest 99.86 99.95 100 95.75 94.79 100 R/tree 99.57 99.93 100 94.07 95.94 99.97 BayesNet NaiveBayes SMO AdaBoost Bagging OneR Part Hoeffding C4.5 Rforest R/Tree TCP UDP P2P IM IMAP FTP
Fig. 9 Specificity result for HIT data set
traffic applications. Though, all the applied ML classifiers specificity results are very promising, yet the PART ML classifier gets the maximum specificity results for HIT Trace 1 data set, which is 98.82%. Similarly, all the applications traffics are classified very accurately with respect to specificity results. The FTP traffics are classified with 99.92% specificity results as shown in Fig.9and Table5.
Table7and Fig.10show the AUC results with details of HIT data set, respectively. From the figure and table, it is clear that the applied ML classifiers give very effective AUC results for HIT Trace 1 dataset. However, only AdaBoost ML classifier gets slightly low AUC result and using Bagging ML classifier shows very poor AUC performance for IMAP application traffic. SMO classifiers also give low AUC results for the FTP and IM application traffic, but its overall performance is good as compared
Table 7 AUC results for HIT trace 1 dataset
Classifiers TCP UDP P2P IM IMAP FTP
Bays Net 0.9879 0.9996 0.9673 0.6999 0.8346 0.9724 Naïve Bayes 0.8714 0.9507 0.9501 0.5576 0.7005 0.9522 SMO 0.8604 0.9982 0.9279 0.5176 0.7050 0.5 AdaBoost 0.7911 0.9992 0.5 0.5 0.5 0.5 Bagging 0.9922 0.9995 0.9480 0.6836 0.8238 0.9688 OneR 0.9798 0.9862 0.5 0.6752 0.8154 0.9535 PART 0.9963 0.9994 0.9415 0.7218 0.8338 0.9639 Hoeffding 0.8860 0.9989 0.9220 0.5656 0.6999 0.9529 C4.5 0.9946 0.9993 0.9415 0.7030 0.8575 0.9742 R/forest 0.9981 0.9997 0.9675 0.6378 0.7164 0.9690 R/tree 0.9950 0.9996 0.9545 0.7044 0.6297 0.9740 BayesNet NaiveBayes SMO AdaBoost Bagging OneR Part Hoeffding C4.5 Rforest R/Tree TCP UDP P2P IM IMAP FTP
Fig. 10 AUC results for HIT data set
to other ML classifier. Similarly, all the utilized applications traffics are classified with respect to AUC metric such as UDP, FTP, applications traffic give maximum AUC results as compared to other application traffic. Overall AUC result of IM and IMAP are slightly low as compared to other applications traffic. Thus application traffics are classified very accurately with respective AUC results.
5.2 Analysis results of NIMS dataset
Figure11shows the accuracy results of the NIMS dataset, while the detailed results are shown in Table8. Using NIMS dataset applied ML classifiers get very accurate accuracy results using selected features which are selected by our proposed two algo-rithms. However, AdaBoost ML classifier get low accuracy results on average based
BayesNet NaiveBayes SMO AdaBoost Bagging OneR Part Hoeffding C4.5 Rforest R/Tree TCP UDP P2P IM IMAP FTP
Fig. 11 Accuracy results of NIMS data set
Table 8 Accuracy results for NIMS dataset
Classifiers WTCP WUDP P2P IM IMAP FTP
Bays Net 100 99.53 99.53 99.97 99.96 99.99 Naïve Bayes 98.02 72.31 72.02 99.55 97.72 99.96 SMO 99.91 87.15 86.06 98.15 99.46 99.91 AdaBoost 97.03 64.63 60.36 90.74 84.70 87.35 Bagging 99.95 99.99 100 100 99.94 100 OneR 99.77 96.75 95.20 98.29 96.70 99.02 PART 99.98 99.99 100 99.97 99.96 99.98 Hoeffding 97.65 71.61 69.71 95.97 97.33 99.96 C4.5 99.99 99.99 99.99 100 99.94 99.97 R/forest 100 100 100 100 100 100 R/tree 99.97 100 100 99.98 99.95 100
as compared to other applied ML classifiers. The lifted applied ML classifiers get very effective accuracy results and classify all the NIMS dataset traffic very accurately. Thus RandomForest ML classifier gets the maximum accuracy results for NIMS data set. Similarly, TCP application traffic is accurately classified as compared to other application traffics, which is about 99.29%, while P2P traffic is classified a little bit low as compared to application traffics. However, all the utilized applications traffics are classified very effectively. Furthermore, comparing the accuracy results of NIMS dataset with accuracy results of HIT Trace 1 data set, NIMS data set produces high accuracy results as compared to HIT Trace 1 dataset.
In Fig.12, it is clear that all the utilized application traffics are classified with respective sensitivity metrics as shown in Table 9. However, only P2P application
BayesNet NaiveBayes SMO AdaBoost Bagging OneR Part Hoeffding C4.5 Rforest R/Tree TCP UDP P2P IM IMAP FTP
Fig. 12 Sensitivity results of NIMS data set
Table 9 Sensitivity results for NIMS dataset
Classifiers WTCP WUDP P2P IM IMAP FTP
Bays Net 100 99.93 98.94 100 99.77 99.88 Naïve Bayes 97.09 92.29 41.01 94.42 88.38 99.63 SMO 100 75.62 86.82 83.65 96.33 100 AdaBoost 12.00 10.0 100 9.00 97.32 8.00 Bagging 100 100 100 100 99.94 100 OneR 98.84 96.52 93.16 80.10 88.91 99.63 PART 100 100 100 99.65 99.69 100 Hoeffding 99.42 91.02 40.71 59.69 87.71 99.63 C4.5 100 100 100 100 99.54 100 R/forest 100 100 100 100 100 100 R/tree 100 100 100 99.83 99.69 100
traffics are slightly low classified as compared to other traffic applications, while applied ML classifiers also give very effectively performance results.
But AdaBoost ML classifier gives very poor performance results for FTP appli-cation. Moreover, the P2P application traffic also does not give very good sensitivity results, but their overall performance is good as compared to other application traffic. RandomForest ML classifier gives the maximum sensitivity results for NIMS dataset on average sensitivity results, while AdaBoost ML classifier gives the minimum sen-sitivity results. However, overall sensen-sitivity results are effective as compared to HIT Trace 1 dataset.
Table10and Fig.13show the specificity results for the NIMS data set, respectively. From the figure and table, it is clear that the entire applied ML classifiers give very
Table 10 Specificity results for NIMS dataset
Classifiers WTCP WUDP P2P IM IMAP FTP
Bays Net 100 99.36 99.97 99.97 99.99 100 Naïve Bayes 98.05 63.56 95.30 99.99 99.69 100 SMO 99.91 92.18 85.97 99.14 100 99.90 AdaBoost 100 100 25.67 100 81.59 100 Bagging 99.95 99.99 100 100 100 100 OneR 99.79 96.85 96.73 99.42 97.88 99.91 PART 99.98 99.98 100 99.99 100 99.98 Hoeffding 97.61 62.02 91.62 99.05 99.54 100 C4.5 99.99 99.99 99.98 100 100 99.82 R/forest 100 100 100 100 100 100 R/tree 99.97 100 100 99.99 99.99 100 BayesNet NaiveBayes SMO AdaBoost Bagging OneR Part Hoeffding C4.5 Rforest R/Tree TCP UDP P2P IM IMAP FTP
Fig. 13 Specificity results of NIMS data set
promising specificity results for NIMS dataset. However, only AdaBoost ML classifier gives slightly low specificity result as compared to other ML classifiers, while the RandomForest ML classifier gives maximum specificity result for NIMS data set. Similarly, all the utilized applications traffics are classified very effectively with respect to specificity matric. The FTP application traffics are classified very accurately and give the maximum specificity result as compared to other applications traffics. Moreover, the P2P application traffics are classified with minimum specificity results, which are 90.47%. It is very good performance with respect to specificity matric.
Table11and Fig.14show the AUC results with details for NIMS data set, respec-tively. From the figure and table, it is evident that the applied ML classifiers give very effective AUC results. However, only AdaBoost ML classifier gives low AUC for applications traffics and the rest of the others ML classifiers give very effective AUC results. Similarly, the RandomForest ML algorithm gives highly results values
Table 11 AUC results for NIMS dataset
Classifiers WTCP WUDP P2P IM IMAP FTP
Bays Net 100 99.36 99.97 99.97 99.99 100 Naïve Bayes 98.05 63.56 95.30 99.99 99.69 100 SMO 99.91 92.18 85.97 99.14 100 99.90 AdaBoost 100 100 25.67 100 81.59 100 Bagging 99.95 99.99 100 100 100 100 OneR 99.79 96.85 96.73 99.42 97.88 99.91 PART 99.98 99.98 100 99.99 100 99.98 Hoeffding 97.61 62.02 91.62 99.05 99.54 100 C4.5 99.99 99.99 99.98 100 100 99.82 R/forest 100 100 100 100 100 100 R/tree 99.97 100 100 99.99 99.99 100 BayesNet NaiveBayes SMO AdaBoost Bagging OneR Part Hoeffding C4.5 Rforest R/Tree TCP UDP P2P IM IMAP FTP
Fig. 14 AUC results of NIMS data set
as compared to other ML classifiers. All the utilized applications traffics are classified very accurately with respect to AUC matric, but only P2P application traffics are clas-sified slightly low AUC results. On the other hand, FTP application traffic is clasclas-sified with maximum AUC results, which is promising AUC results as compared to other application traffic AUC results as well as HIT Trace 1 data set AUC results.
6 Analysis and discussion
The results of eleven applied ML classifiers are different with respect to accuracy, sen-sitivity, specificity and AUC results using two different network environments datasets HIT Trace 1 data set and NIMS data set. However, some information can be learned from the experimental study for instant messages imbalance traffic classification.
– In this work, it is clear that our proposed algorithms: WMI_AUC and RFS select effective features for IM imbalance traffic classification using two different net-work environment dataset in terms of accuracy, sensitivity, specificity and AUC metrics.
– From this study, it is clear that our proposed algorithm selects effective features set and it is evident that all the selected features carry enough information for IM imbalance traffic classification such as (1) min_fpktl (2) mean_bpktl (3) max_bpktl (4) mean_biat (5) std_biat (6) total_fvolume and evident by applying machine learning classifiers that these selected feature carry enough classification informa-tion.
– From the experimental results analysis, it is evident that all the applied ML clas-sifiers performance is effective using both two different datasets. However, only P2P and FTP applications traffic is low classified as compared to other applica-tions traffic because of not enough instances; however, it is also evident that our proposed approaches are able both big datasets and small numbers of instances datasets.
– The applied ML classifiers give very promising performance results for IM imbal-ance traffic classification. Nevertheless, we found that RandomForest and C4.5 decision tree ML classifiers performance results are promising for both datasets as compared to other ML classifiers in IM imbalance traffic classification.
7 Conclusion
This paper proposed two feature selection algorithms named WMI_AUC and RFS. WMI_AUC algorithm used to select feature from the high-dimensional imbalance data. After using, WMI_AUC algorithm RFS algorithm is further used to select robust feature to be applied into practice. Experimental results show that our proposed approaches were effective for IM imbalance traffic classification in high-dimensional imbalance data. It is evident that applied approaches are able for IM imbalance traffic classification without altering any changes in training data. The features selected by our algorithms perform very well in terms of accuracy, sensitivity, specificity and AUC metrics for classifying Instant Messages (IM) imbalance traffic data. The robust fea-tures selected by our approaches are (1) min_fpktl (2) mean_bpktl (3) max_bpktl (4) mean_biat (5) std_biat (6) total_fvolume and it is evident that these selected features carry enough information for IM imbalance traffic classification. The applied eleven ML classifiers get very efficient performance results, but we found that RandomForest and C4.5 decision tree ML classifiers with WMI_AUC and RFS algorithms selected features have very efficient performance results. However, our proposed algorithms are very effective for IM imbalance traffic classification.
Acknowledgements This work was supported by National Natural Science Foundation of China under Grant No. 61571144.
References
1. Foremski P (2013) On different ways to classify internet traffic? A short review of selected publications. Theor Appl Inform 25(2):119–136
2. Moore A, Papagiannaki K (2005) Toward the accurate identification of network applications. Passiv Act Netw Meas 3431:4–54
3. Nguyen T, Armitage G (2008) A survey of techniques for internet traffic classification using machine learning. IEEE Commun Surv Tutor 10(4):56–76
4. Karagiannis T, Broido A, Faloutsos M, Claffy K (2004) Transport layer identification of P2P traffic. In: IMC ’04 Proceedings 4th ACM SIGCOMM Conference Internet Measurement, pp 12–134 5. Sen S, Spatscheck O, Wang D (2004) Accurate, scalable in-network identification of p2p traffic using
application signatures. In: Proceedings 13th International Conference World Wide Web, p 521 6. Karagiannis T (2004) Application-specific payload bit strings.http://alumni.cs.ucr.edu/~tkarag/papers/
strings.txt, 2004. [Online].http://alumni.cs.ucr.edu/~tkarag/papers/strings.txt. [Toegang verkry: 0Jan-2017]
7. Haffner P, Sen S, Spatscheck O, Acas DW (2005) Automated construction of application signatures. In: Proceedings 2005 Workshop Mining Network Data, pp 197–202
8. Moore AW, Zuev D (2005) Internet traffic classification using Bayesian analysis techniques categories and subject descriptors. In: Sigmetrics, pp 50–60
9. Singh R, Kumar H, Singla R (2013) Sampling based approaches to handle imbalances in network traffic dataset for machine learning techniques. arXiv Prepr. arXiv1311.2677
10. Labovitz C, Iekel-Johnson S, McPherson D, Oberheide J, Jahanian F (2010) Internet inter-domain traffic. SIGCOMM Computer Communication Review, vol 41
11. Peng H, Long F, Ding C (2005) Feature selection based on mutual information: criteria of max-dependency, max-relevance, and min-redundancy. IEEE Trans Pattern Anal Mach Intell 27(8):1226– 1238
12. Maes F, Collignon A, Vandermeulen D, Marchal G, Suetens P (1997) Multimodality image registration by maximization of mutual information. IEEE Trans Med Imaging 16:187
13. Zhang H, Lu G, Qassrawi MT, Zhang Y, Yu X (2012) Feature selection for optimizing traffic classifi-cation. Comput Commun 35(12):1457–1471
14. Bradley AP (1997) The use of the area under the ROC curve in the evaluation of machine learning algorithms. Pattern Recognit 30(7):1145–1159
15. Shafiq M, Yu X, Laghari AA (2016) WeChat text messages service flow traffic classification using machine learning technique. In: 2016 6th International Conference IT Convergence and Security ICITCS 2016
16. Shafiq M, Yu X (2017) Effective packet number for 5G im WeChat application at early stage traffic classification. Mob Inf Syst 2017
17. Shafiq M et al (2017) WeChat text and picture messages service flow traffic classification using machine learning technique. In: Proceedings—18th IEEE International Conference High Performing Computer Communication 14th IEEE International Conference Smart City 2nd IEEE International Conference Data Science System HPCC/SmartCity/DSS 2016, pp 58–62
18. Peng L, Zhang H, Yang B, Chen Y, Qassrawi MT, Lu G (2010) Traffic identification using flexible neural trees. In: IEEE International Workshop Quality Servervice IWQoS
19. Lu G, Zhang H, Sha X, Chen C, Peng L (2010) TCFOM: a robust traffic classification framework based on OC-SVM combined with MC-SVM. In: Proceedings—2010 International Conference Com-munication Intelligence Information Security ICCIIS 2010, pp 180–186
20. Auld T, Moore AW, Gull SF (2007) Bayesian neural networks for internet traffic classification. IEEE Trans Neural Netw 18(1):223–239
21. Cieslak DA, Chawla NV, Striegel A (2006) Combating imbalance in network intrusion datasets. In: IEEE International Conference Granular Computing, pp 732–737
22. Nechay D, Pointurier Y, Coates M (2009) Controlling false alarm/discovery rates in online internet traffic flow classification. IEEE INFOCOM 2009:684–692
23. Li W, Canini M, Moore AW, Bolla R (2009) Efficient application identification and the temporal and spatial stability of classification schema. Comput Netw 53(6):790–809
24. Gomes DG, Agoulmine N, Bennani Y, de Souza JN (2007) Predictive connectionist approach for VoD bandwidth management. Comput Commun 30(10):2236–2247
25. Chen X, Wasikowski M (2008) FAST: a roc-based feature selection metric for small samples and imbalanced data classification problems. In: Proceeding 14th ACM SIGKDD International Conference Knowledge Discovery and Data Mining—KDD 08, pp 124–132
26. Van Der Putten P, Van Someren M (2004) A bias-variance analysis of a real world learning problem: the CoIL challenge 2000. Mach Learn 57(–2):177–195
27. Lei D, Xiaochun Y, Jun X (2008) Optimizing traffic classification using hybrid feature selection. In: Ninth International Conference Web-Age Information Management, pp 520–525
28. Zheng Z, Wu X, Srihari R (2004) Feature selection for text categorization on imbalanced data. SIGKDD Explor 6(1):80–89
29. Lim Y, Kim H, Jeong J, Kim C, Kwon TT, Choi Y (2010) Internet traffic classification demystified: on the sources of the discriminative power. In: Proceedings 6th International Conference, p 9 30. Kamal AHM, Zhu X, Pandya A, Hsu S (2009) Feature selection with biased sample distributions. In:
2009 IEEE International Conference on Information Reuse and Integration IRI, pp 23–28
31. Wasikowski M, Chen X (2010) Combating the small sample class imbalance problem using feature selection. IEEE Trans Knowl Data Eng 22(10):1388–1400
32. Moore A, Zuev D, Crogan M (2005) Discriminators for use in flow-based classification
33. Peng L, Zhang H, Yang B, Chen Y (2014) Feature evaluation for early stage internet traffic identification. In: Lecture Notes in Computer Science (including subseries Lecture Notes in Artificial Intelligence Lecture Notes in Bioinformatics), vol 8630. LNCS, pp 51–525
34. Peng L, Yang B, Chen Y, Chen Z (2015) Effectiveness of statistical features for early stage internet traffic identification? Int J Parallel 44:18–197
35. Bernaille L, Teixeira R, Akodjenou I, Soule A, Salamatian K (2006) Traffic classification on the fly. ACM SIGCOMM Comput Commun Rev 36(2):23–26
36. Bahl LB et al (1986) Maximum mutual information estimation of hidden Markov model parameters for speech recognition. In: ICASSP ’86. International Conference on Acoustics Speech Signal Process, vol 11, pp 49–52
37. Peng H Mutual information Matlab Toolbox. https://www.mathworks.com/matlabcentral/ fileexchange/14888-mutual-information-computation
38. Peng L, Yang B, Chen Y (2015) Effective packet number for early stage internet traffic identification. Neurocomputing 156:252
39. WireShark Trace Traffic WireShark, 2015. [Online].https://www.wireshark.org/. [Toegang verkry: 0Jan-2015]
40. Introduction to NetMate Tool. [Online]. https://dan.arndt.ca/nims/calculating-flow-statistics-using-netmate/comment-page-1/
41. Makhoul J, Kubala F, Schwartz R, Weischedel R (1999) Performance measures for information extrac-tion. In: Proceedings DARPA Broadcast News Workshop, pp 249–252
![Table 2 Characteristics of NIMS data set [40]](https://thumb-us.123doks.com/thumbv2/123dok_us/350913.2538617/14.659.75.577.111.256/table-characteristics-of-nims-data-set.webp)