ABENGOA CASE
Origin, evolution and discussion of its situation
JULIA SALES ADELL – 20481148Q TUTOR: ANTONIO VICO MARTINEZ
4 t h C O U R S E O F F I N A N C E A N D A C C O U N T I N G D E G R E E 2 0 1 5 - 2 0 1 6
U N I V E R S I T A T J A U M E I
Abstract: The aim of this report is to analyse the key factors that have determined the current situation of the company Abengoa. Noting the various changes in management, changes in its financial structure and the circumstances of their environment the reader can be closer to explaining its almost bankruptcy.
1
INDEX
1. INTRODUCTION 4
2. HISTORY OF THE COMPANY 5
2.1 Founding period (1941-190) 5
2.2 National expansion and consolidation (1951-1960) 6
2.3 International expansion (1961-1970) 6
2.4 Continuous growth (1971-1990) 8
2.5 Innovation period (1991-2003) 10
2.6 International leadership stage (2004-2010) 15
3. ABENGOA TODAY (2010-2016) 19
3.1. Description of the Company nowadays 19
3.2. Identification of the sector’s characteristics 22
3.3. Economical and financial analysis 31
4. CONCLUSIONS 44
5. ANNEXES 45
2
INDEX OF FIGURES
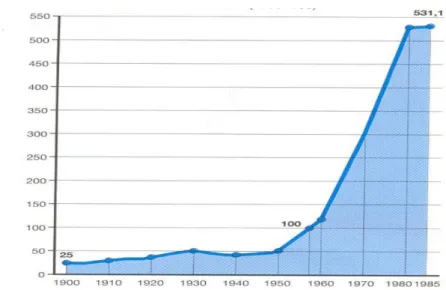
Figure 1: Industrial Production Index 1900 – 1985 (1985=100) 7
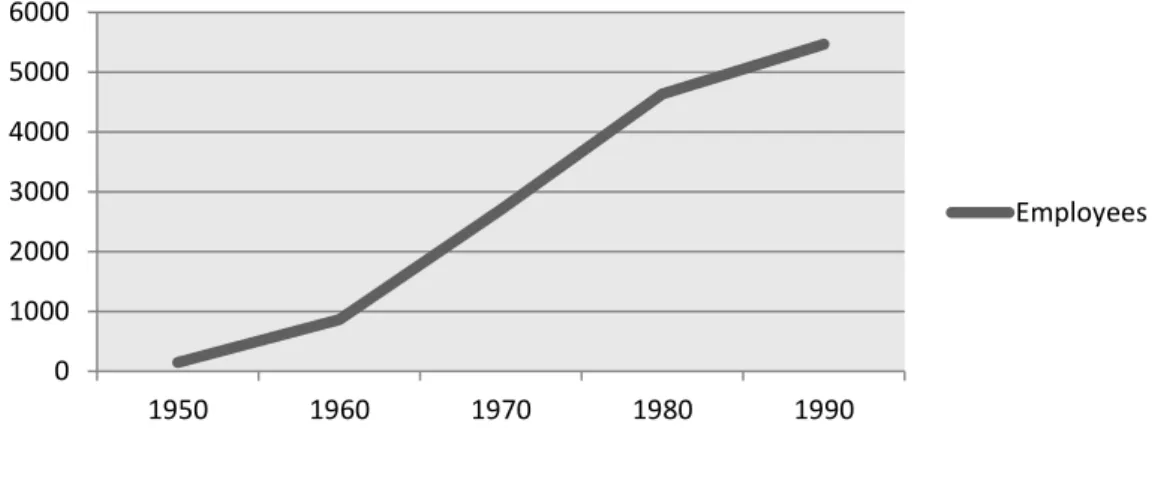
Figure 2: Evolution of the firm’s employees 1950-1990 9
Figure 3: Leverage rate 1994-2003 11
Figure 4: Evolution composition of debt 1994-2003 12
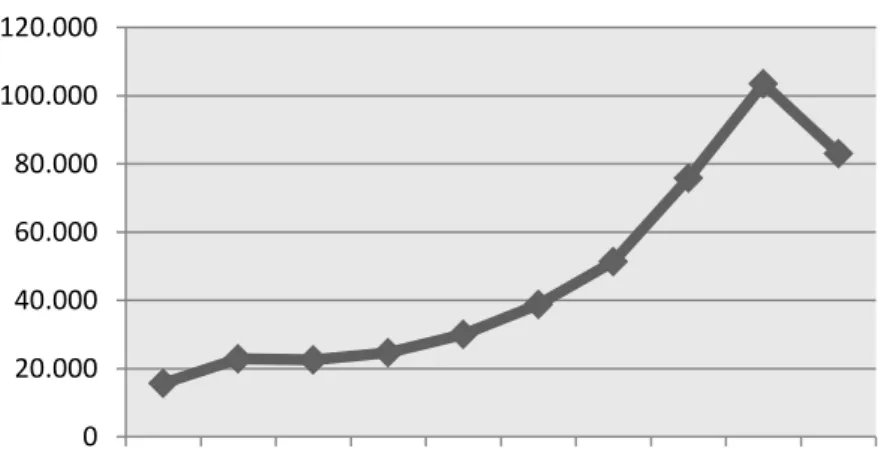
Figure 5: Evolution of the investment in PPE 1994-2003 13
Figure 6: Evolution of ROA 1994-2003 14
Figure 7: Financial leverage 15
Figure 8: Groups of business 17
Figure 9: Primary energy consumption in Spain in 2004 18
Figure 10: Distribution of the staff in the geographic area 20
Figure 11: Structure of Abengoa 21
Figure 12: Breakdown of operating incomes of Abengoa competitors 30
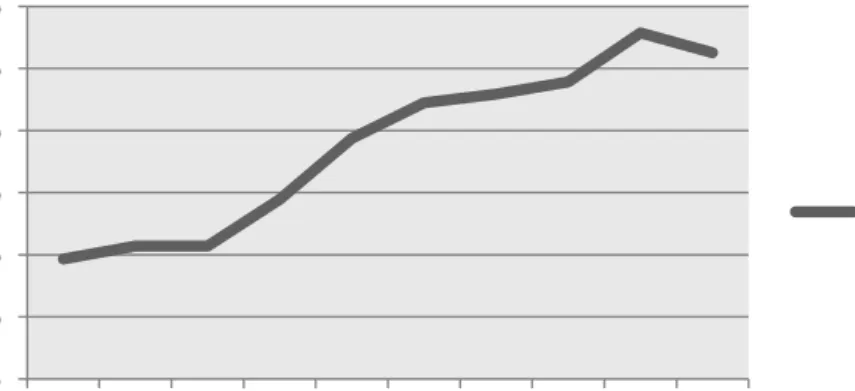
Figure 13: Evolution of the growth (2001-2014) 32
Figure 14: Balance Sheet magnitudes evolution (2010-2014) 33
Figure 15: Income Statement magnitudes evolution (2010-2014) 33
Figure 16: Evolution of ROA 37
Figure 17: Evolution of ROE 38
Figure 18: Financial cost 2010-2014 39
Figure 19: Margin of leverage 2010-2014 39
Figure 20: Balance Sheet 2014 40
3
INDEX OF TABLES
Table 1: ROE historical evolution 13
Table 2- International presence. Comparision 2009-2010 16
Table 3: Activities’ results of Abengoa 2014 22
Table 4: Strategic profile of a specific environment of Abengoa 26
Table 5: Strategic profile of the competitive environment of Abengoa 29
4
1. INTRODUCTION
Abengoa is a Spanish company founded in 1941 which is set in the manufacturing industry and grows until it becomes a worldwide reference in innovating technologies solutions for the growth in energy and environment.
When we hear about Abengoa in the last few months we remind the sentence “In the case it becomes efficient we would be speaking about the great arrangement with creditors in the history of Spain”. The news was on the media in November 2015 and it got several controversies about why this situation about bankruptcy in a firm which for more than 60 years had been working in an increase sector such as renewable energy with good results. Therefore the goal of this work is making a historical analysis of the company. Have a general view of the firm in order to know from what point it starts, what are its initial fundamentals and how it has develop the traditional business to the company today. This analysis focuses mainly on the economical ambit but it also emphasises on organizational and strategic changes reached during years.
The structure of this work is divided into several phases. The first one explains the historical evolution of the firm until the current situation. Once we know the history of the company and the different ways in which has been decanting the business management we arrived at the stage of deeper economic analysis covering the years 2010 to 2014. These are the key years that determine the mainly solvency and liquidity problems of the company. As it will be seen through the work, there is a clear business change at the beginning of the century due to the distancing to the traditional model company. At first Abengoa was financed by reinvestment of projects' profits but gradually it started to choose bank debt to finance its activity. The increasing indebtedness made the financial liability increased tenfold and it was the reason of the current problems. This is magnified knowing their presence in areas of clear government regulation, highly linked to economic fluctuations and political decisions, which created doubts investors and speculators. At this point the company announced at the end of November that it could enter into an arrangement with creditors. These conclusions will be introduced more closely in this work.
5
2. HISTORY OF THE COMPANY
2.1. Founding period (1941-1950)
The 4th of January 1941 Javier Benjumea Puigcerver and José Manuel Abaurre Fernández-Pasalagua, engineers of the Catholic High School of Arts and Science (ICAC), founded in Sevilla the Sociedad Abengoa S.L. with 180.000 pesetas (1.082 euros) with the support of friends and close relatives of the Seville aristocracy. The name of the company was born by the acronym of the first letter of the founders’ surname like Benjumea and others. The initial goal was create a five-amp-monophasic meter. But the growth experienced by the Spanish economy in the early twentieth century was abruptly interrupted during the Civil War and the Franco’s years. As José Luis García Delgado says (2015, pp. 24-25) it was a time of strong interventionism, autarchy and international isolation with a nationalist component that deteriorated the equipment and infrastructure destroyed during the war. It was not the most favourable situation to undertaken a project in manufacturing, due to shortages of materials so, Abengoa decided to change its initial goal.
Following this situation the company reoriented its activities to the sector of engineering, conducting technical and electrical projects. The Civil War had seriously affected industrial production, by physical destruction but also by disorganization in general, the fragmentation of markets, disruption of communications, lack of raw materials, work or energy. All it worsened by foreign military situation during Second Civil War. (Tortella Casares, 1994)
It can be said that Abengoa was born in a time full of opportunities to carry out projects to rebuild the destroyed industrial fabric. The company undertook numerous projects and technical studies and thus gradually diversified its activities and its geographic scope. Benjumea opted for a concentric growth that led him to settle in Andalusia during the 1940s. Then, sales exceeded 45 million pesetas in that moment (270.456 €).
6
2.2. National expansion and consolidation (1951-1960)
In the 50s the economic conditions were improving. Spain joined UNO, and Agreements were signed in the United States, we can see a certain process of opening and convergence. It is a period of economic growth and industrialization made by the National Institute of Industry which was created to enforce the industrial public sector and to enforce the private initiative which was stock at that moment.
The electrical sector started to spring after some years of restrictions made by frozen electrical tariffs and the stopping of its productive capacity. (Carreras & Tafunell, 2005) The change in the industrial policy, the availability of foreign exchange to import oil, the unified tariffs and the creation of an organisation to get the interchanges of energy between companies were some of the causes of the boom in this sector. Between 1949 and 1952 the electricity generation raised 94%. The prices of electricity had risen –always controlled by the government- which made private companies to get for this sector. The arising demand was being equilibrated with the arising of the supply, the built of new centrals and the improvement in the connexion of the nets. (Carreras & Tafunell, 2004, pp. 307-317) Abengoa made profit of this situation increasing the number of projects to develop.
The company became a Limited Company on March 20th in 1952. It was a decade of settling in the national territory carrying on projects whose sales were over 827 million of pesetas (4.940.371€), a very important figure for the industry at that moment. Moreover, after reinforcing the initial organizational model, it started to offer services to the navy, railway, cold, watering and automobile sectors.
2.3. International expansion (1961-1970)
At the end of 1959 the government approved the main measures of a liberalization and stabilization programme which opened the way towards an exterior opening and the integration of the economy in the international view. The Stabilization Plan had a main goal which was correcting the macroeconomic imbalances at that moment in order to line the Spanish economy with the countries in the occidental world and to free from former interventions. That reorientation in the economic policy besides the foundation of the European Economic Community or the European Union of payments among others, gave the monetary stability to the system which guaranteed more balance for the commerce and the international movements of capital and labour.
7 The company, inside the energetic sector, participated in different projects which we can stress the starting of the first Spanish nuclear central: José Cabrera set in Zorita, Guadalajara. As we can see in Figure 1 which represents the index of industrial productions from 1900 to 1985, it is between the period of the 60s and 70s when the industrial sector was its maximum growth point. Abengoa benefited of the opportunities in the iron, steel, chemical, miner and petrol sectors, as well as telecommunications and electronic sectors, which began to be important in the company.
Figure 1. Industrial Production Index 1900 – 1985 (1985=100)
Source: Carreras, A. : La industria, atraso y modernización
Operations began in the international market creating the first office in Teyma, Argentina, and carrying out projects in Colombia, Venezuela and Guatemala. In this period the sales of the company raised 4.880 million of pesetas (29.329.391€). Its size, which was getting bigger, was pushing to get a correctly internal organization which was able to arise the complex structure which gave way to six sectors of activity: energy, industry, transport, environment, telecommunication and electronic.
8
2.4. Continuous growth (1971-1990)
At the beginning of the decade of 1970 the production of the electrical energy had tripled its weight which was around 56.500 GWh with an installed potency of 17.925 MW. The generation structure had been modified lightly when the electric production failed from 84% in 1960 to 50% in 1970. Besides, the fuel-oil production rose. (Energía y sociedad, 2016)
This situation of apparently bonanza would be stuck by the crisis of oil in 1973 which had no effects in Spain until 1974 but it went on until 1983. Such recession was made by several factors from the sunk of international monetary system of Bretton Woods, the raising competence of the industrialized countries or the inefficacy of the European economies. (Carreras & Tafunell, 2004, pp. 367-378) The measures which government started at that moment weren’t enough to avoid that the price of petrol grew at the rhythm of the inflation which untied around the politic instability in the country, the Transition. The high dependency of the energetic sector in the country made the creation of the First National Energetic Plan (1978-1987) which was thought to soften the dependency of the Spanish companies with the petrol. Among its goals a new question about electronic system was found mainly in nuclear energy and coal.
Abengoa could make profit of this new business and took it inside its activities. It is now when they get a new project: the supplying an installation of the electrical net and assembly of the trains of Uninsa which would allow to doubling its capacity. It is also important the activities in the telecommunication sector. Such activities were supported by the boom of Telefonica at that moment in fully international spreading and main client of Abengoa. On the other hand we have to mention the great interest for environmental activities (wastes dumps and integral treatment of the water), and the control systems (electronic, informatics and communications used in areas such as traffic, space, electricity, petrol, gas, transport, weather, water or defence) as well as the cogeneration, renewable energy and distribution (López Mielgo & Lorenzo Fernández, 2011)
Referring to its international purpose, it bits for Latinoamerica although it starts modest projects in countries of North-Africa, such as Libia or Egypt as well as other European countries. In the decade of 80s Abengoa started to be present in a permanent way in Peru, Chile, Mexico, USA and China.
9 The international presence as well as the diversification of activities, different from traditional energetic business helped to diminish the minor activity of this. Besides, the company bet for the technological growth in a moment of scarce evolution of itself. The productivity of a country is determined by the capitalization (growing of the human and physical capital) and the technological process. This comprises concepts such as: the qualification of the labour force, the giving of physical capital by every worker, the advance of scientific knowledge and its application in the production, the importance of the investigation and development, etc (García Delgado, Myro Sánchez, Álvarez López, Verga Crespo, Alonso, & López Morale, 2015). In that moment Abengoa stood out by its efforts in these aspects because it programmed and installed the first computer and the first remote control and system of electronic protections, as well as the works in the intense training of its staff. The company bet for making better the policies of staff management searching for a correct and productive working atmosphere. We can also observe in Figure 2 how the staff multiplied year by year becoming 149 employees in 1950 to 5.468 at the beginning of 1990, even in the crisis periods.
Source: Data from Abengoa’s corporate website
The company was able to adapt to the current demands in market meanwhile it supported the effects of both crisis in the decade. The development of new technologies and innovation or the introduction of new activities to each business model as well as the policies of staff management searching a better working environment, were some of the factors that allowed the company to get sales of over 52.300 million of pesetas (314.906.303€). 0 1000 2000 3000 4000 5000 6000 1950 1960 1970 1980 1990
Figure 2. Evolution of the firm's employees 1950-1990
10
2.5. Innovation period (1991-2003)
The decade of the 90s picked up some circumstances, both inner and outer, which would condition the corporative strategy of Abengoa until that moment. In 1991 Javier Benjumea left as president of the company who had been for more than 50 years giving the power to his sons Javier and Felipe. Many changes happened which rolled around rethinking of the traditional business because the electrical sector, although it had a raising demand, it was at the end of an investor cycle with a regulatory system little predictable, highly fluctuations and prices sensitive to variations in the environment as well as in telecommunications. We have to add that its main client Telefonica was in the same situation ending its more aggressive investor cycle and all of it obstructed Abengoa to get the maximum benefit of all resources it disposed at the moment. Other reason which Benjumea brothers considered at the moment of business’ rethinking is the difficulty to handle in an efficient way the set of diversified and internationalized services.
It was in 1996 when the company made its first strategic plan, followed by the reorganization of its business lines and its organisational structure and the coming in November in the world of stock market. The general international scene was in a commercial expansion, the opening of the borders and the good economic relationship between countries. It is in 1995 when Commercial World Organization was created with the goal to liberalize trade. It was like a kind of platform where governments negotiated the commercial agreements resolved their differences and settled the fundamental juridical bases in the international commerce. This atmosphere was good for the business activity getting more and more exterior presence.
One of the other changes which benefited the business situation was the innovations in the financial system in the last years of the twenty century. We can stand out the removing of restrictions such as the regulation of the interest rates which difficulty the competence between banks, the failing of the barriers to entry in the foreign banks, the development of the alternative services for the users or the technological progress and communications allowing financial companies or no financial to offer bank products. (García Delgado, et al., 2015)
A set of improvements were disposed to companies: new instruments to finance some projects with a mayor grade of leverage and to reduce the necessities of money. This allowed the company to be far away from the traditional business which consisted
11 of reinvest the benefits got in its projects to finance some new ones. The benefit became from the difference between one and the others. Due to such evolution of the financial system, a mayor quantity of economic resources became to the approach of the companies in order to pay for its activity.
We can see the following Figure 3 in which we see this phenomenon in the Abengoa case. The company came from a ratio of payable notes to own sources from the 193.10% in 1994 to 525.37% in 2003. Its financial structure was changing, its liability represented in 2003 more than 50% of its financing. The debt ratio stands out by the impact which it has over the value of the company and we have to bear it in main when we consider the business strategy.
Source: Based on data of SABI
Figure 4 shows the composition of the financial structure. As we have said formerly the liabilities were the most important specially the current liabilities where the debts with credit institutions were more and more important. The financing following own resources represented a half of 22.87% to the whole of the financing. The reinvestment of the funds got by the projects was following behind and they preferred the external debt.
0,00% 100,00% 200,00% 300,00% 400,00% 500,00% 600,00% 1994 1995 1996 1997 1998 1999 2000 2001 2002 2003
Figure 3. Leverage rate 1994-2003
12
Source: Calculations based on data of SABI
We have to stand out that the change in the tendency to get financing is highly tied to the entry in sectors of high growth potential which required high initial inversions. The company redirected to provide two types of services. On the one hand, it kept the traditional services of engineering with seventy years of experience with an own know-how and a well-known international leadership. In this sense it limited to design, construction and maintenance these ones. On the other hand, integrated products get more and more importance, in which Abengoa assumed the responsibility of all value chain (promotion, inversion, building, maintenance and operation), with own technological support. In the firsts, the financing came through the client and in the seconds, which were based on vertical integration, the specific financing became important tied to the bank and the new services which were offered by them. (López Mielgo & Lorenzo Fernández, 2011)
The company bed for sectors in which they could extract more value of the activities. This was a stage of reconfiguration the own limits of the company. At that moment we can stand out the entry in business such as solar system energy or the production of bio-fuels. That is because the company was in a moment whose objective was to develop from the line of the conventional products to the range of distinct activities with mayor technological components. Figure 5 shows the evolution of the inversion in intangible assets during this period, most of it belong to research and development costs as well as concessions, patents, licences, trades and similar.
0 200.000 400.000 600.000 800.000 1.000.000 1.200.000 1.400.000 1994 1995 1996 1997 1998 1999 2000 2001 2002 2003
Figure 4. Evolution composition of debt 1994-2003
Own sources
Non-current liabilities Current liabilities
13
Source: Calculations based on data of SABI
This type of internal changes was accompanied at the same time by corporative operations, disinvestments and acquisitions purchases which facilitated the diversification and internationalization of the company.
This stage of growing and innovation translated in terms of profitability was the following:
Table 1: ROE historical evolution
1994 1995 1996 1997 1998 1999 2000 2001 2002 2003
ROE 2,87% 3,48% 9,45% 9,69% 10,55% 10,94% 11,15% 11,60% 12,85% 12,65%
Source: Calculations based on data of SABI
The profitability got by shareholders by the invested money during the period had been highly increased going by 2.87% in 1994 to a 12, 65% in 2003. The calculation of the ROE as we know makes reference to the quotient between net income and the shareholder’s equity, but following the strategic decomposition of this variable we can explain its tendency. That is to say, ROE has a direct relation with the profitability of the assets and the financial leverage of the company. The return on assets or ROA, is the relation between the earnings in a period and its total assets. The
0 20.000 40.000 60.000 80.000 100.000 120.000 1994 1995 1996 1997 1998 1999 2000 2001 2002 2003
Figure 5. Evolution of the investment in Property, Plant and Equipment 1994-2003
Property, plant and equipment
14 financial leverage is the product of the financial margin – relation between the gotten profitability and the financial cost that it concerns - and the financial leverage which makes reference to debts.
In the case of Abengoa in this period we can see that return on assets wasn’t specially affected, there is certain fluctuation during the first years but from 1997 to 2003 the variability follows a line around 5% without standing out, although like it was falling down.
Source: Calculations based on data of SABI
As the ROA doesn’t explain the growing of ROE we can find the answer in the financial leverage. Related to the boom of financial system in that age explained formerly, it isn’t strange that the financial leverage of Abengoa is a key parameter in the period. In the one hand because of the grade of leverage or debts as it is reflected in Figure 3 was very high and on the other hand, the margin which the company got in such debts was positive, that is to say, the profitability which they got by being in debt was m than the cost. That is that ROA was around 5.10% forwards to 4.25% of the financial cost. So they stuck to the idea that if ROA is bigger than the cost of financing the debts will be a positive factor and this will make the financial profitability bigger. Such positive leverage was a great help at that moment, because it was in consonance with the restructuration of its corporate strategy which required bigger capital expenditures as it increased its expansion and diversification.
0,00% 1,00% 2,00% 3,00% 4,00% 5,00% 6,00% 7,00% 8,00% 1994 1995 1996 1997 1998 1999 2000 2001 2002 2003 Figure 6. Evolution of ROA 1994-2003
15
Source: Calculations based on data of SABI
The company came to the end of the millennium with sales over 144.000 million of pesetas (865.457.431€). Good news for Abengoa and especially for the shareholders. Apart from the economic data we have to mention an inner fact especially important: the pass away of Javier Benjumea Puigcerver on the 4th January 2001 of 86 years old after being all his life in the management of the company. Benjumea had already delegated his powers to his children years ago but it continued being a relevant character in the company. It was at the moment of this event when arguments appear between brothers Javier and Felipe. But they got a solution when Felipe started to get the total control of the company whereas Javier concentrated on institutional tasks.
2.6. International leadership stage (2004-2010)
The second period of the millennium stands out for Abengoa by its international leadership. By several different projects set in different geographic localizations and it could increase its presence and to settle as a model company in the countries in which it is set up such as United States, India or China.
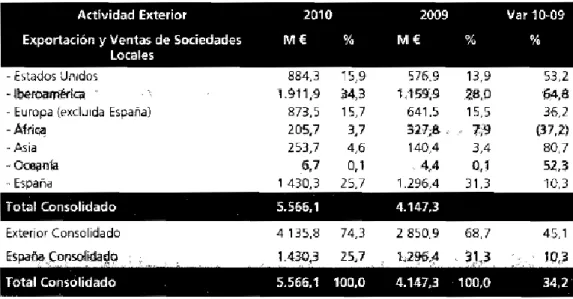
As the own company explains with it Management Report in 2010, the activity in the exterior increased during this stage both in volume and in diversification. Of the 556.1 million of euros of consolidated sales of the exercise, 4.135.8 M€ (34.3%) were
-6,00% -4,00% -2,00% 0,00% 2,00% 4,00% 6,00% 8,00% 10,00% 1994 1995 1996 1997 1998 1999 2000 2001 2002 2003 Figure 7. Financial leverage
16 from outer sales, 5.6 points per cent more than a year before. The activity in Spain was falling down going by 1.296.4M€ (31.3%) in 2009 to 1430.3M€ (25.7%) in the exercise in 2010. We can observe in Table 2 that respect to the outer Latin America concentrates the biggest company efforts follow by United States and Europe, although every time it spreads more and more in Asia and Africa.
Table 2- International presence. Comparision 2009-2010
Source: Abengoa Management Report 2010
Between the more outstanding performances of international character in the season we find the acquisition in 2006 of the German Group AB by 330M€, the acquisition in 2007 of hundred per hundred of the capital of the group of Dedini Agro, one of the biggest Brazilian companies of bioethanol and sugar, the acquisition in 2008 of the American company DTN Holding Company, Inc, the building in 2008 of four solar system panels (PS 20, Solnova 1, Solnova 3 and Solnova 4) and three firm of etanol (Rotterdam, India and Illinois) and another 7 new firms in 2010, among them.
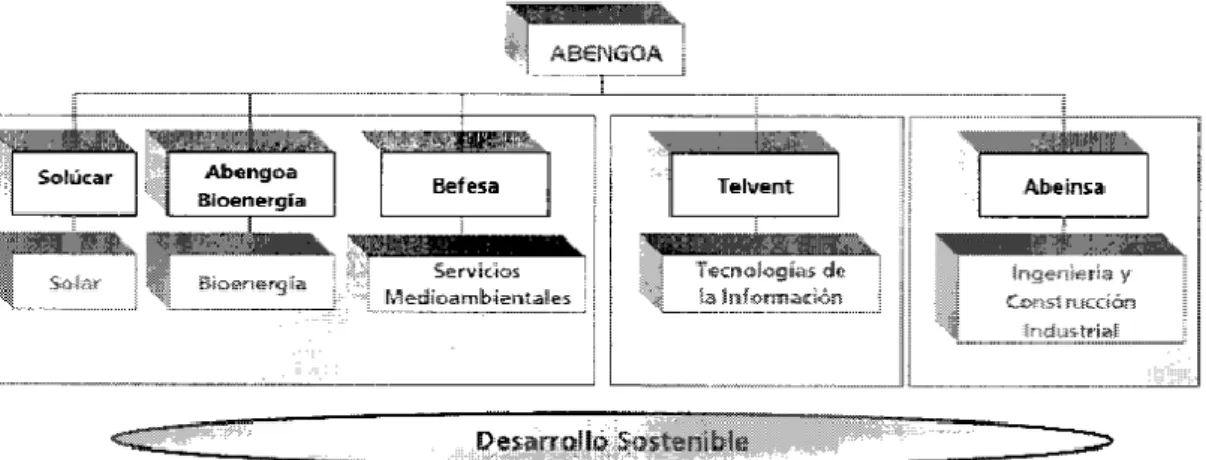
During this period the company, as technologic firm which have innovating solutions for the growing in the sectors of infrastructures, environment and energy, operates through five groups of business each one of them with its following heading society.
-Solúcar centred its activity in the promotion, design, building and development of electric power plants getting the sun as a source of energy.
17 -Abengoa Bioenergia, was dedicated to the production and developing of fuels for transport which used biomass as a raw material.
-Befesa Medio Ambiente was the heading in the environmental services whose main activity was industrial services and the building of environmental infrastructures developing recycling activities of aluminium, zinc, industrial wastes and environmental engineering.
-Telvent was making solution of high value added to the energetic traffic, transport and environment sectors.
At last, Abeinsa was the heading of the group of engineering and industrial building and was in charge of engineering, building and keeping of electrical infrastructures, mechanical, instrumental for several sectors, as well as promotion, building and exploitation of industrial, energetic and renewable firms, as well as turnkey nets and projects of telecommunications.
Figure 8 : Groups of business
Source: Annual Accounts of Abengoa 2006
It is true that the group, every time more presented in new markets and new areas of business, had a tendency to focus on energetic activities, water and wastes,
18 highly dependent of regulation and external factors. The company was following the tendencies of the moment which preceded hopeful future in these sectors.
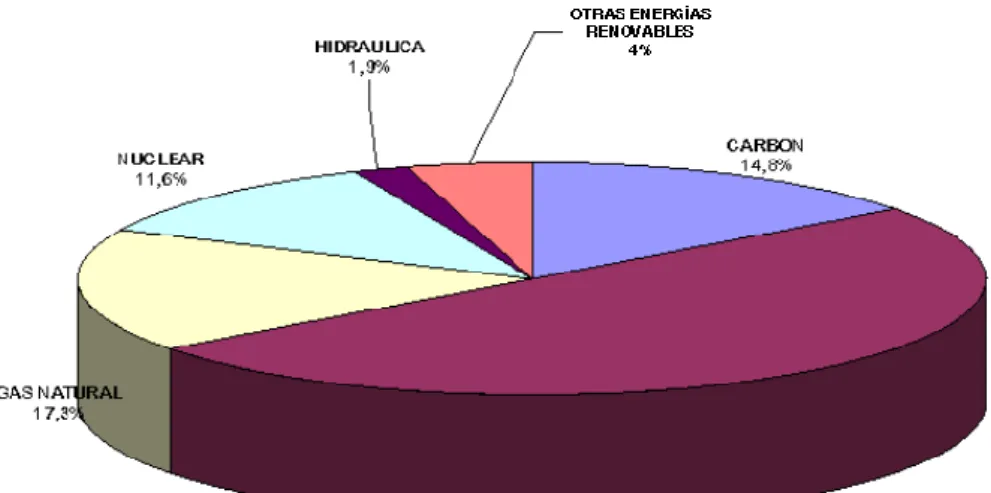
In 2004 the European Conference was being celebrated in Berlin whose main goal was that renewable energies supposed at 20% of total energy consumption for the year 2020. As we can observe in Figure 10 Spain had very low rates representing a 5.9% where the primary source of energy was petrol oil followed by natural gas, coal and nuclear energy.
Figure 9: Primary energy consumption in Spain in 2004
Source: Minetur
Starting by that dependency of oil Abengoa also paid attention in the statements of the american bank of inversion Goldman Sach forecast prices of tonne around 200 dollars. For this reason it bed for building solar panels, a project that nowadays has been affected by the low price of the tonne which pushes the grate fixed cost which the centrals have. As well as the water scarce in 2008 with grate necessities of desalinates. This entire atmosphere pointed to great opportunities of business and it was being financed thanks to financial entities which trusted on firm projects. The stage ended with the sold of 40% of Telvent with the purpose of focus on activity and strategy of the company in the sectors of energy and environment. Later it also sold other assets as Befesa.
The company apparently could solve the difficulties of financial crisis increasing its sales respect last year a 34% until 5.566M€ and the net income a 22% getting the 207M€.
19
3. ABENGOA TODAY (2010-2016)
The historical analysis made until the moment pretends to expose the backgrounds of one of the Spanish technological societies of major controversial in the last few months. Knowing its evolution can help us to understand its current situation with the following financial analysis which will be carried on.
The following part is the last stage analyses of the company with the goal of identify the changes which have been reflecting that something was happening in the company and which would carry the necessity of applying for the creditors contest. We can base on the following three parts:
3.1 Description of the company nowadays
3.2 Identification of the characteristics of the sectors in which it works 3.3 Economical and financial analysis
3.1. Description of the company nowadays
Abengoa closed the exercise of 2014 with a result of 121.877 million of euros. The company has evolved towards a business which bets for sustainable development and efficient management applying the experience in engineering to promote solutions towards new methods of energy from the sun, development of bio combustibles or drinking water production from the water in the sea.
As we exposed in the last Management Report of the annual accounts of 2014 and following each strategy of internationalization, the activity in the exterior at that moment represents about 88% of the consolidated sales, especially in United States and Mexico.
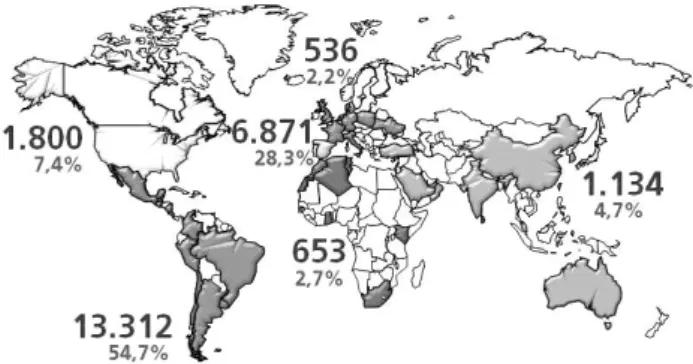
It has a rate of 27.181 employees all around the world of whom one third are in Spain whereas 75% works in foreign countries. Latino America was the main continent
20 in this labour force, as we can observe in Figure 11, who made reference of the distribution of the staff in the geographic area. The staff supposes an added value for the company who get trained constantly and its work in the company process. They are mainly distributed in engineers, diplomatist, assistants and professionals who are the base in the company activity, followed by workers, medium staff and bosses who supposes a 2,1% of the total staff.
Figure 10: Distribution of the staff in the geographic area
Source: Abengoa’s Management Report - 2014
From 2010 the company doesn’t have activities in its five groups of business mentioned before whether it evolutions according to NIFF to the current six operative segments which are the base to represent the financial information at the same time they include the three main activities of the company which are represented below.
21
Figure 11: Structure of Abengoa
Source: Compiled from 2014 Management Report
Engineering and Construction, it is the traditional activity of engineering in energy and water. The company specializes in turnkey projects such as solar panels, hybrid solar-gas plants, biofuels, hydraulic infrastructures including desalinates and electric transmission as well as activities related to the development thermosolar technology, water and electrical crops or others related to hydrogen.
Concession-type infrastructures. Abengoa has a great portfolio of proprietary concession assets which generate revenues that are governed by long term sales agreements with formats such as take-or-pay contracts, tariff contracts of power purchase agreements. In this part it also included the operation of electrical generation plants (solar, cogeneration or wind power) and desalinates as well as lines of transmission. This activity is formed by four segments:
-Solar: operation and maintenance of electrical power generation plants.
-Transmission: operation and maintenance of infrastructures of transmission lines of high tension.
-Water: operation and maintenance of generating installations, transport, treatment and developing of water, including desolation plants, treatment and purification of water.
ABENGOA
Engineering and construction 1) Engineering and construction Concession-type infrastructures 2) Solar 3) Transmission lines 4) Water5) Cogeneration and others
22 -Cogeneration and others: operation and maintenance of conventional electric centrals. -Industrial production. We can group the activity of bioenergy with the high technologic component. It is based on the production and development of biofuels mainly bioethanol for transport, which uses vegetal fibre, cereal, sugar cane and seeds as raw material.
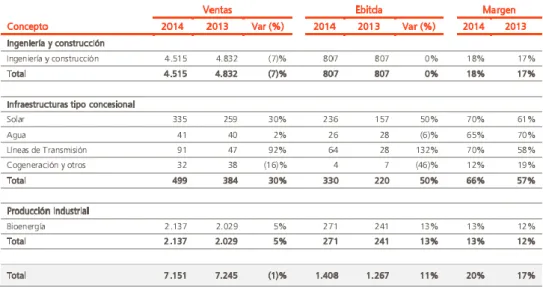
Table 3: Activities’ results of Abengoa 2014
Source: Abengoa, Management Report - 2014
Abengoa has centred its activities in the last decade especially in environment and energy sectors paying special attention to the renewal energies. As we can see in Table 1 the activity of engineering and construction concentrates most of its sales, representing a 63,14% of the total followed by Industrial production which supposes a 29,9%.
3.2 Identification of the characteristics of the sectors in which it works
It is fundamental to know the characteristics of the sector in which the firm operates as it allows us to get some basic notions referring to the level of competition being between companies, the level of innovation as well as the growth of itself. All of
23 them are key elements for the growth of the company and which will make influence in the conclusions and analysis done.
Abengoa S.A. works mainly in the sectors of energy and environment, which can be considered fundamental strategic sectors due to the growing worrying about the environment. In them energetic sources are used which came from available sources from nature such as sun, water, wind, vegetal biomass and animal. That is to say, renewable sources of unlimited way and with a minor impact unless pollutant than the use of fossil fuels in traditional energetic sector, as they can be oil and coal. From the European Union they defend the necessity of promoting the liberalization of the markets, the guaranty of the supply and the reduction of fuel emissions (Instituto para la Diversificación y Ahorro de la Energía, 2011) The necessity of supporting this kind of practices starts in the own characteristics of the energetic sector which can differ depending on the country but keeping general lines. In the case of Spain the consumption of primary energy and final energy is mainly based in using petrol and its derivatives and more and more natural gas. It stands out due to its high exterior energetic dependence due to the shortage of own resources necessary to satisfy the growing demand and the fixed price to the government regulation.
Next we present the strategic profile of a specific environment which in general lines can be stood out from the renewal energy sector and environment. This profile is an instrument of analysis that evaluates some factors which allows as observing those points in which the firms of the sector can found opportunities and threatens. It consist of defining the different dimensions of those variable keys, to evaluate its possible impact, in this case in a scale from one to four (very negative, negative, positive, very positive) and from this to determine the opportunities or potential threatens. In the case of the sector of the renewable energies and environment we have determine the following factors and the corresponding dimensions:
-Economic factors:
-Difficulties in accessing financing. As it was presented in the decade of 90s, Abengoa profited the growth of the financial system to get funds which the bank offered to finance its activity, but nowadays the lines of credit are remitted, which make the
24 access to resources difficult and the tendency to leverage has been reduced in the last few years.
-Barriers to entry. It is a sector which requires high initial disbursements to carry on the construction of big and expensive installations and it isn’t easy for the companies which are starting. This is a benefit for the companies already established in the sector. -The cost of renewable energies. We have to mention that the renewable energies depend on raw materials, the treatment of great majority depends both on the price of commodities negotiated in second markets and the inherent costs of all the process of transforming. But at the same time they came from primary resources which guaranties the supply and it is far from the problems associated to energetic dependence.
-Tecnological factors
-High investments in research and development. It is a sector in continuous evolution, growing an innovation as high inversions reflect in research and development respect to each business volume, with areas of great potential of growing such as the sea energy or geothermic. It is a fundamental aspect for the growth of competitive as well as the discovery of new materials on which we can work. For example, the perovskita which is more productive and economic than the silica, is the main element to get solar power and more and more scarce.
-High productivity. It is an intensive sector in human capital so there are high employment rates related to the rest of energetic sectors. Besides, the labour force is more productive.
-Legal factors
-Government regulation. The legislation differs depending on the country although it has a bigger tendency to international cooperation in this stuff. In the case of Spain we found the Article 9 of the Law 26/12/2013 which obliges to pay some auto consume rate from: tolls of net access, cost of services provision or cost of the electric system.
25 All of these accompanied by the obliged inscription in the register of administration of the electric energy, which difficulties the main development in this sector.
-Sociocultural factors
-Increase of the use of the renewable energies. There is a large number of population being aware of the sustainable practices and the use of renewable resources which makes that we can bed for this kind of companies.
-Environmental factors
-Environmental impact. As we have mentioned before the growing worrying about the sustainability of human practices and the defence of the environment suppose a positive factor for this sector aware of the climatic change. Besides, the level of pollution is greater reduced than produced by the use of fossil or nuclear energy. -Visual impact. It is one of the aspects less accepted by the ecologists who attack the visual effect that the installations in buildings caused.
26
Table 4: Strategic profile of a specific environment of Abengoa
FACTORs
Very
negative Negative Positive
Very positive
ECONÓMIC
Accessing financing
Barriers to entry
Cost of renewable energies
X TECNOLOGICAL Investments in research and development Productivity X LEGAL Government regulation SOCIOCULTURAL
Use of renewable energies X
ENVIRONMENTAL
Environmental impact
Visual impact
X
27 When we observe the strategic profile of the specific environment, we can say that Abengoa is found in a sector where it should pay attention to the access of the financing since the banks after the economic crisis in 2008 are more reluctant to loans especially for projects which need high payments and undetermined and uncertain payback. There are also the government rules which can be understood as a threaten in this surrounding since it is tie to stability and to the government of every country, which depending on its criteria and situation has the option of not lending facilities to this sectors.
Once we have analysed this part, we have to mention the strategic profile of the competitive environment with the purpose of knowing how the company is in respect to its competence. To do it we have the reference of Porter’s five forces analysis (Magretta, 2012), which starts in an integral analysis of five variables: the industry rivalry, the bargaining power of buyers, the bargaining power of the suppliers, the threat of substitutes and the threat of new entrants.
Industry rivalry. In this point we start with the general analysis of the price level, the difference between the products and the ease of change one trade to another. Regarding to differentiation of prices this variable cannot be interpreted as commerce strategic in general because it is quite limited by regulation. Buyers pay specially attention to the quality and the difference of the product since comparing allows them to choose between the different companies due to easiness of change from one company to another.
Bargaining power of buyers. In this case, Abengoa offers some services both to private big and medium companies, investors and clients of an institutional character. All of them public administration and grate investors are the ones with bigger powers of negotiation, both by size and volume of operation.
Bargaining power of the suppliers. When we came to this point we have to mention the cost of changing the supplier, the volume of purchases and the gotten technologies. The gotten technologies have a negative impact because they are expensive with continue changes and limited suppliers. In respect to the volume of purchases it is a
28 positive impact because when the acquired quantities are higher we can make profit of the economies of scale. And last, the costs of changing suppliers could determine no impact due to the grate offer of the suppliers of materials that a company with the same size of Abengoa can have.
Threat of substitutes. The existence of different products increases the propensity of customers to switch to alternatives. We make reference especially to the rest of energetic sources to which a buyer can fall back on: oil, coal, natural gas, nuclear energy, etc. All of them have a negative influence because they are one of the main sources of getting energy and big competitors of the nuclear energies.
Threat of new entrants. They are important in this point the level of experience, loyalty of the consumers, the barriers of entry and the governmental laws. Abengoa has more than 70 years of experience in engineering and construction. In these years it has been able to be loyal to its buyers which is a positive influence because it is a barrier for new competitors without this position. Nevertheless, the regulation stands out as a negative influence because they have to adapt to themselves whereas new competitors can start the activity.
29
Table 5: Strategic profile of the competitive environment of Abengoa
COMPETITIVE FORCES Negative
Impact No Impact Positive Impact INDUSTRY RIVALRY Price levels Differentiation products
Ease of brand switching
BARGAINING POWER OF BUYERS
Big companies Public administrations Particulars BARGAINING POWER OF SUPPLIERS Obtaining of technologies
Costs of supplier switching
Purchasing volumes THREAT OF SUBSTITUTES Oil Natural gas Nuclear energy Coal
THREAT OF NEW ENTRANTS
Experience level
Costumers loyalty
Regulation policy
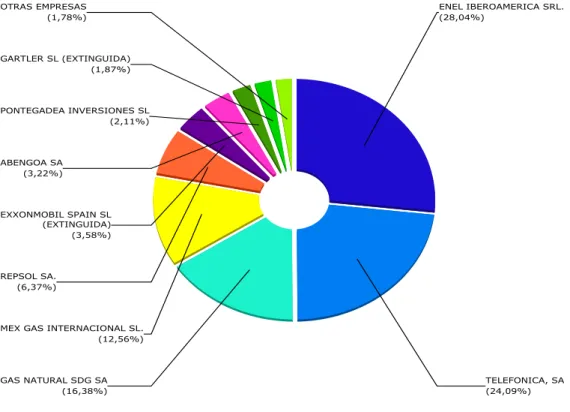
30 Another way to observing in a general way the state of the company related to its direct competitors is to analyse operating incomes comparing between them. A company in the competence does the same activity of ours and to know exactly that activity we base in the National Code of Economic Activities (NCEA) in which the main activity is enrolled. In the case of Abengoa SA, it is enrolled in the code 6420 – Activities of the holding societies, which has such operations: construction, promotion and works of civil building, restoration, improvement and keeping both in public and private, including every kind of industrial buildings, works or urbanization in general specially to the energetic sector and environment. Analysing the companies with the same code we have made a list of companies which we can see in Figure 12 where we have use the operating income to compare them. We can observe that Abengoa in this sense only represents a 3.22% of the total being in an intermediate position below big Spanish companies as ENEL Iberoamerica SRL or Telefonica SA, and above others as Pontegadea Inversiones SL or Gartler SL.
Figure 12: Breakdown of operating incomes of Abengoa competitors
31
3.3. Economical and financial analysis
The fourth part consists of the study and economic-financial analysis of the company in the last few years with the purpose of observes the determinants which came forecasting the situation of the company today.
Growing of the company
The first point to analyse makes reference to the growing rate which the company has been suffering in the last few years. This variable is often a fundamental aspect in the companies, both to determine the future actions and to explain the base of the company success, financial planning or the value of the company.
As Alfonso A. Rojo Ramirez (2011:116) explains, the majority of the entities address the issueof growing paying attention in the countable variables such as Net Income , the Result of the exercise, the Own sources, or the Invested Capital. In this case, we have chosen for the following analysis the percentage of variation in the Net Income of the last 14 years. As we can observe, the evolution of this variable has suffered big changes during the period, standing out the falling of the incomes in the exercises 2004, 2008 and the last few years because of the problems it has been having and the rise of the economic crisis. We have also considered interesting to show in the following Figure the evolution of the companies in the countries in which Abengoa has had a big presence in the last few years: Spain, United States and Mexico. To do it we have taken the annual growth rate of Gross Domestic Product (GDP) to the prices in the market of the local currency, to constant prices. In spite of little differences between the characteristics of every country, all of them have got a similar evolution around a 1.7% on average during the analysed phase whereas the company give the result of a medium variation of 14,35%. These differences can reflect that the company had growing rates superiors to the medium in the countries in which it operates.
When we came to this point we have to mention a sentence of Walsh (1994:174) “the growing of a company is good until a certain point but dangerous and fatal when it exceeded this level”. In some occasions bigger figures to the medium can reflect better company skills but in others they can suppose unbalanced growing , that is to say, a rhythm of growing superior to the once which can support the companies without risking their economic-financial position. The balanced growing starts in keeping a
32 balance financial structure and to do projects which generate resources by retaining benefits and not so much as external debts.
Source: Compiled from Eurostat data
1. Balance Sheet analysis
Annexe 1 shows the Balances Sheet of the company for the exercises 2010 to 2014. From this data we have made Figure 14 which shows the evolution of the more outstanding variables during the period. The variables with bigger changes are the current assets and the current liabilities which are nearly double in exercise 2013 to 2014. This arises when the optimized Plan of the financial structure of the Abengoa. It was through the initiatives such as reduction of its part in Abengoa Yeld (subsidiary company presented as an operative segment inside the activities of commercial concessions until the moment), the speeding of the sale of assets to Abengoa Yield or the creation of a joint venture with external partners for the investment in concessional assets in growing and building as they explained in their annual accounts. As a result of it we can observe the falling of intangible assets and tangible assets in last period, also backed by the exit of the perimeter of consolidation of several companies. Regarding to the falling of non-current liabilities it reposts to payment obligations which came to integrate current liabilities because it has inferior expirations by the year and restructuration and negotiations with the banks to improve the ratio of debt. On the other hand we have to mention an increase in the own funds which response to the
-10,00% -5,00% 0,00% 5,00% 10,00% 15,00% 20,00% 25,00% 30,00% 35,00% 40,00% 20012002200320042005200620072008200920102011201220132014
Figure 13: Evolution of the growth (2001-2014)
33 increase of non-controlling interests. And last, we have to see the negative tendency of the working capital.
Source: Compiled based on Annual Report - 2014
2. Income Statement
Starting in Annexe 1.2 we have made Figure 15 which is a general base to analyse the tendency in the more representative variables of the Profit and Loss Account in the company. We can observe the positive evolution which was happening in the turnover until 2012 and because from this exercise it starts to fall down which affect to the rest of the variables especially to the material costs which is the main cost for the company. Looking at financial costs in exercise 2014, they have increased due mainly to the increase of the interest developed by debts in the company.
Source: Compiled based on Annual Report - 2014
-4.000.000 -2.000.000 0 2.000.000 4.000.000 6.000.000 8.000.000 10.000.000 12.000.000 14.000.000 16.000.000 2010 2011 2012 2013 2014
Figure 14: Balance Sheet magnitudes evolution (2010-2014) Intangible assets Property, plant, equipment Current assets Own sources Non-current liabilities 0 2.000.000 4.000.000 6.000.000 8.000.000 10.000.000 2010 2011 2012 2013 2014
Figure 15: Income Statement magnitudes evolution (2010-2014) NOI RBE Staff costs Material costs Financial costs Amortization
34 3. Cash Flow Statement analysis
Once we have made the general analysis of Balance Sheet and Income Statement, it is interesting to analyse the Cash Flow Statement. The term of cash flow makes reference to the cash entering or leaving in the treasury, making far away from accrual basis. That is to say, as many economists claim, the cash movements of the company are a measure of the value of the richness of the company which in some occasions can be more valid than the benefit. This is due to the base of cash receipts and payments can be the main indicator for an economic and financial health in a company instead of using the benefits since they can be altered in different ways as José Ignacio Llorente Oliver (2010:316) claims. These ways are the accountancy of incomes and payments in different exercises than the exercises done, exaggerated provisions, high charges in bad years, buying and selling of supposed fictitious prices with affiliated companies which are not consolidated, fictitious sales, making the value of goods higher, etc. The Free Cash Flows starts in an order of the flows in three categories. -Cash Flow from operating activities: these are the ones made by activities which are the main source of incomes of the company. They make the Income Statement until the operating result on the one hand and the current assets and current liabilities on the other hand.
When we start from Annex 1.3, we can observe that Abengoa is during all the period in a situation of generating positive flows of cash in its exploitation. Although, in 2014 it has been reduced passing from 740.630 to 18.586, mainly due to the increase of paid interest and to changes in the current capital and other operating flows which counteract with the positive effect off the result adjustment.
The positive adjustment that has come from the adjustments in the result comes basically from the increase of the financial costs and variations in financial instruments.
The diminishing in nearly 240% experimented by the changes of the current capital comes from the increase of the current assets (generated by the held for sale and the uncollected revenues) having a negative effect bigger than the one produced by the unpaid expenses which generate a positive adjustment. That made a big decrease in the liquidity for the company.
With regard to the diminishing of epigraph 4 “Other cash flow from operating activities” comes from the raising of the interest payments.
35 For this notes we can use the following ratios, enclosed in Annexe 1.4.
Ratio 1 = (CF from operating activities / Net operating income) x 100 Ratio 2 = (CF from operating activities / EBITDA) x 100
In spite of the cash reductions named before the company presents positive ratios of Cash flows from operating activities in the sales and in EBITDA, although it has some oscillations due to the variability of the sales in the last few years.
-Cash Flow from operating activities to debt and equity stakeholders: defined by the General Accounting Plan as the “payments which have its origin in the purchase of other non-current assets, other assents non included in the effective and other current assets such as intangible assets, property, plant and equipment, investment property or financial investment, as well as the incomes from purchases coming from its sale or its amortization when it expires. These determine the capacity of the company, that is to say, the level and the composition of the non-current assets. For this we use Ratio 3: RATIO 3 = (Charges by investments / Payments by investments) x 100
The company focuses on investment in intangible assets and, in the second place, in property, plant and equipment. To get the payment of these investments Abengoa has had to sell other assets, concretely these disinvestments had financed a mean of 18% the purchase of the rest of the assets.
-Cash Flow for all debt and equity stakeholders: they are produced by getting own founds and by external founds with the main goal of financing the operating and the investments, besides they include the devolution of themselves. They make the financial resources with cost.
In this case, derived by the former situation the company has to access a financing with the import of 1.590.680 million of euros during 2014 coming mainly from debts with banks and capital increases.
From we have exposed above the economic-financial health in a company depends on itself generating enough founds from the operating activities to cover the investment
36 needs, the reimbursement of loans and the payment of dividends without having to fall back on external financing (JOSÉ IGNACIO LLORENTE OLIER)(2010:319). In the case of Abengoa, we can claim that the generation of the cash flow in the company depended of the external financing which has to reconsider the policy in charges an payments of the operations with the goal of reducing the financial expense which have been generating over the years.
4. Analysis of profitability
Another key variable of the accountant analysis is the profitability. When we take as reference the benefit, the results or the dividends to determine the health of a company it can, in some occasions, carry on distrust results. To use the profitability in any of its aspects can show the evolution of the company in a integrate way. It is a variable which is directly related to the decision which managers take and it makes reference to the gotten profit in based to the invested sources. To get a determined profitability is tied to a risk which must be taken into account. The level of risk which a company has to assume will depend on an aversion to itself and off the profitability which it wants to get due to the direct relation between both variables.
Next, we can see two measures of profitability which will be good to make the following analysis starting from concepts of different benefits. Therefore, let’s introduce both concepts which will be included in the posterior calculations.
On the one hand, we find the profit for the shareholder, which makes reference to the increase of the gotten capital during the exercise and the cash flow given to the partners either in a dividend way or the purchase of the own shares and dismissing the emission of own shares. By the time we make the Balance Sheet analysiswe can use the benefit of the exercise to come closer to the concept of benefit for the shareholder since this countable benefit doesn’t include dividends, capital increases, dismissing of capital, emission of debt or its refund.
On the other hand, we have to pay attention to the concept of economic benefit; it is the result of adding the increasing in the gotten asset during the exercise and the cash flow given to the shareholders and creditors of the company. To arrive to this variable starting from the benefit of the exercise of the continuous operations we only have to add the financial expenses gotten after the taxes.
37 Starting from these two measures of benefits we arrive at two ways of measuring the profitability.
Firstly we have to analyze the ROA which measures the return which the company is able to generate with the whole of goods and rights which make part of the assets without taking into account the way in which these are financed. (Muñoz Merchante, 2009)
ROA = Net income + Financial expenses*(1-t) / Mean Assets
Source: Compiled by author
As we can observe, this figure has been decreasing since 2010. One way of discompose ROA to know to what such decreasing is due, it is multiplying and dividing the anterior formula for the operating incomes, in a way that the profitability of the assets will be equal to the margin by the rotation.
ROA = (Net income + Financial expenses*(1-t) / OI) * (OI / Mean Assets) MARGIN ROTATION
As we reflect the calculations in the Annex 1.4., we can observe that the rotation dismisses because the mean asset increases and the operating incomes falls off, whereas the margin increases slightly mainly due to the increase of the financial expenses. This is, in the last few years Abengoa got a major earnings per monetary unit sold and at the same time it was reducing the number of time that the sales were equal to the assets value. At the end of 2014 the company was getting a 9.85% of the margin, that is to say, 9.85 cents of the benefit by unit sold, nearly one point over in 2010. Although the sales in this period are 31% of the assets value, in 2010 they were 41%. (Aragó Manzana & Cabedo Semper, 2003)
0,00% 1,00% 2,00% 3,00% 4,00% 2010 2011 2012 2013 2014
Figure 16: Evolution of ROA
38
Table 6: Decomposition of ROA in margin and turnover
On the other hand, if we start with the benefit for the shareholders we get the financial profitability ROE which reflexes the benefit of the exercise in percentage above the mean net asset which represents the investment of the shareholders.
ROE = Net income / Mean Net Asset
Source: Compiled by author
As we can observe the return on equity was also dismissing in 2010. To analyze accurately this evolution we can proceed to discompose ROE in its more outstanding determiners, this is because the ROE is directly related to the profitability of the assets and the financial leverage.
ROE = ROA + Mean Liabilities x ( ROA – Financial Cost) Net Asset Mean
GRADE OF LEVERAGE MARGIN OF LEVERAGE FINANCIAL LEVERAGE
Decomposition of0 ROA in margin and turnover
Margin 9,85% 8,42% 7,85% 8,96% 8,57%
Turnover 0,31 0,37 0,41 0,41 0,44
Verification ROA = Margin x Turnover 3,10% 3,09% 3,23% 3,65% 3,76%
Variation in ROA 0,00% -0,14% -0,42% -0,11% Variation in Margin 1,44% 0,56% -1,10% 0,39% Variation in Turnover -0,05 -0,04 0,00 -0,03 Margin Efect ME 0,53% 0,23% -0,45% 0,17% Turnover Effect TE -0,45% -0,35% 0,03% -0,26% Total Effect TE -0,08% -0,02% 0,00% -0,01% Variation ROA = ME + TE + TE 0,00% -0,14% -0,42% -0,11% 0,00% 5,00% 10,00% 15,00% 20,00% 2010 2011 2012 2013 2014
Figure 17: Evolution of ROE
39 On the one hand, the dismissing of the ROE is due to the reduction of the profitability in assets but besides the effect of the fall of ROE is mayor due to the dismissing of the financial leverage. As we can observe in the calculations done in Annex 1.4 the grate of leverage has been kept in similar levels since the dismissing of the financial leverage comes from the leverage margin. This change in the tendency that we can observe in the graphics is due to the difference between the profitability we can get out of the assets and the cost of financing themselves was minor. Moreover the financial cost hast an increasing tendency.
0 0,01 0,02 0,03 0,04
Figure 18: Financial cost 2010-2014 CF Lineal (CF) 0 0,005 0,01 0,015 0,02 20 10 20 11 20 12 20 13 20 14
Figure 19: Margin of leverage 2010-2014 Margin of leverage ROE ANALYSIS ROE 6,35% 5,96% 9,64% 10,68% 18,43%
Decomposition of ROE in ROA and financial leverage
CF 2,744% 2,812% 2,595% 2,911% 2,175%
Grade of leverage 9,222 10,195 10,057 9,479 9,267
Margin of leverage 0,353% 0,281% 0,637% 0,741% 1,583%
Financial leverage (FL) 3,25% 2,86% 6,41% 7,03% 14,67%
Verification: ROE = ROA+ FL 6,35% 5,96% 9,64% 10,68% 18,43%
Decomposition of ROE in RNOA
Net Operating Assets 12.176.477 11.051.677 11.045.088 9.625.787 7.681.808
RNOA 6,10% 5,58% 6,17% 6,95% 6,79%
Financial liabilities > Financial assets
GIF (when FL > FA) 0,060394277 0,05498423 0,05504898 0,06143624 0,04124606 Grade of leverage of RNOA 4,365061492 4,93440895 5,2088536 4,63999747 4,37540463
Margin of leverage 0,06% 0,08% 0,67% 0,80% 2,66%
Verification: ROE=RNOA + (Grade of leverage x Margen of leverage)6,35% 5,96% 9,64% 10,68% 18,43%
WORKING CAPITAL -140.157 -1.195.551 -939.889 36.835 31.480
% Own financing 10,48% 8,95% 8,91% 9,19% 9,94%
% External long term financing 34,69% 55,88% 58,41% 54,07% 52,40%
% External short term financing 54,82% 35,17% 32,68% 36,75% 37,66%
Strategic decomposition of ROE
Margin after financial expenses 1,98% 1,45% 2,12% 2,50% 4,09%
Rotation 0,31 0,37 0,41 0,41 0,44
Indebtness 10,22 11,20 11,06 10,48 10,27
40 Some authors claim that the countable analysis also difference between operative results and financial results. Starting from Balance Sheet integrated in Annex 1.1. we can make Figure 16 which makes reference to the Balance Sheet but discomposing between operative and financial accounts. As we can observe, the asset is financed nearly a 50% with financial liability.
Instead of determining the profitability in the assets, we calculate the profitability of the net operative assets, we can observe that the tendency to fall keeps but starting from superior levels. In 2014 ROA was a 3.76%, whereas RNOA was double around the 6.79%. So we can presume that the financial structure which the company has been having as we have mentioned was conditioning profitability.
Figure 21: Evolution of ROA and RNOA
Source: Compiled by author Financial Assets Financial Liabilities Operative Assets Operating Liabilities Equity 0 5.000.000 10.000.000 15.000.000 20.000.000 25.000.000 30.000.000 ASSETS LIABILITIES+EQUITY
Figure 20: Balance Sheet 2014
Equity Operative Financial 0,00% 1,00% 2,00% 3,00% 4,00% 5,00% 6,00% 7,00% 8,00% 2010 2011 2012 2013 2014 RNOA ROA