Wright State University Wright State University
CORE Scholar
CORE Scholar
Browse all Theses and Dissertations Theses and Dissertations 2011
Role Of Hyperglycemia and Aldosterone on Renal ACE2 aND
Role Of Hyperglycemia and Aldosterone on Renal ACE2 aND
Albuminuria in db/db Mice
Albuminuria in db/db Mice
Harshita ChodavarapuWright State University
Follow this and additional works at: https://corescholar.libraries.wright.edu/etd_all Part of the Pharmacology, Toxicology and Environmental Health Commons
Repository Citation Repository Citation
Chodavarapu, Harshita, "Role Of Hyperglycemia and Aldosterone on Renal ACE2 aND Albuminuria in db/ db Mice" (2011). Browse all Theses and Dissertations. 500.
https://corescholar.libraries.wright.edu/etd_all/500
This Thesis is brought to you for free and open access by the Theses and Dissertations at CORE Scholar. It has been accepted for inclusion in Browse all Theses and Dissertations by an authorized administrator of CORE Scholar. For more information, please contact library-corescholar@wright.edu.
ROLE OF HYPERGLYCEMIA AND
ALDOSTERONE ON RENAL ACE2 AND
ALBUMINURIA IN
db/db
MICE
A thesis submitted in partial fulfillment of the requirements for the degree of
Master of Science
By
HARSHITA CHODAVARAPU
B. Pharm, St. Peter’s Institute of Pharmaceutical Sciences, Andhra Pradesh, India 2009
2011
ii
WRIGHT STATE UNIVERSITY SCHOOL OF GRADUATE STUDIES
Date: September 6, 2011 I HEREBY RECOMMEND THAT THE THESIS PREPARED UNDER MY SUPERVISION BY Harshita Chodavarapu ENTITLED “Role Of Hyperglycemia And Aldosterone On Renal ACE2 And Albuminuria In db/db Mice” BE ACCEPTED IN PARTIAL FULFILLMENT OF THE REQUIREMENTS FOR THE DEGREE OF Master Of Science.
Khalid M.Elased, R.Ph., Ph.D. Thesis Director
Mariana Morris, Ph.D., Chair Department of Pharmacology and Toxicology
Committee on Final Examination
Khalid M. Elased, R.Ph., Ph.D.
Mariana Morris, Ph.D.
Mauricio DiFulvio, Ph.D.
Andrew T. Hsu, Ph.D.
iii
ABSTRACT
Chodavarapu, Harshita. M.S., Department of Pharmacology and Toxicology, Wright State University, 2011. Role of Hyperglycemia and Aldosterone on Renal ACE2 and Albuminuria in
db/db Mice.
Diabetic nephropathy (DN) is one of the microvascular complications of type II diabetes
and a leading cause for the development of end stage renal disease. Renin angiotensin system
(RAS) plays a pivotal role in the development and progression of diabetic nephropathy.
Hyperglycemia activates RAS and increases tissue and circulating levels of angiotensin II (Ang
II) and aldosterone. A new component of RAS, angiotensin converting enzyme 2 (ACE2), has
been shown to be renoprotective in early stages of diabetes. The aim of this study is to test the
hypothesis that strict glycemic control using rosiglitazone or treatment with mineralocorticoid
receptor (MR) antagonist, spironolactone would impart renoprotection in db/db mice via upregulation of renal ACE2. Lean control and db/db mice were fed either rosiglitazone or spironolactone for 10 weeks. Diabetic db/db mice demonstrated hyperglycemia and early onset of microalbuminuria compared to lean control mice. Moreover, elevation in plasma aldosterone
levels of db/db mice supports the role of aldosterone in mediating renal injury. Western blot analysis revealed an increase in renal and urinary ACE2 expression of db/db mice. In addition, there was a significant increase in renal and urinary ACE2 activity in db/db mice compared to lean controls. Further, renal mineralocorticoid receptor (MR) and neprilysin (NEP) protein
expression increased and decreased respectively in db/db mice compared to controls.
Immunohistochemistry demonstrated decreased renal NEP protein expression in db/db mice compared to controls. Periodic acid Schiff stained renal sections of db/db mice showed
iv
glomerular basement membrane thickening and mild mesangial expansion than that of lean
control mice.
Chronic rosiglitazone treatment normalized the blood glucose levels and improved glucose
tolerance in db/db mice but did not alter the increased plasma aldosterone levels. In contrast, chronic treatment with spironolactone significantly increased plasma aldosterone levels in lean
control and db/db mice without altering blood glucose levels. Urinary albumin excretion rate decreased significantly in rosiglitazone and spironolactone treated db/db mice. However, both rosiglitazone and spironolactone decreased renal ACE2 protein expression and enzyme activity
in db/db mice. In addition, urinary ACE2 excretion and enzyme activity were also decreased after treatment with rosiglitazone. Although spironolactone showed no effect on renal MR
expression, rosiglitazone significantly decreased the renal MR expression in db/db mice. In addition, rosiglitazone treatment significantly increased renal NEP protein expression in db/db
mice.
In conclusion, rosiglitazone and spironolactone attenuate albuminuria and impart renal protection
independent of ACE2. Upregulation of renal NEP suggests the involvement of alternative Ang
(1-7) forming enzyme apart from ACE2 in the renoprotection mediated by rosiglitazone. These
v
TABLE OF CONTENTS Page
1. INTRODUCTION………. 1
Diabetes……….. 1
Renin angiotensin system and diabetes……….. 2
Renin angiotensin system (RAS)………... 3
Angiotensin II (Ang II)……….. 4
Angiotensin II receptors……… 4
Angiotensin (1-7) (Ang 1-7) forming enzymes……… 5
Ang (1-7)……….. 5
Angiotensin converting enzyme 2 (ACE2)……….. 6
Neprilysin (NEP)……….. 7
Aldosterone………. 7
Mineralocorticoid receptors (MR)……….... 9
MR blockers………. 9
Diabetic nephropathy……….. 10
Animal models of diabetic nephropathy……… 11
Renoprotection of ACE2……….……… 12
Urinary biomarkers………. 13
Albuminuria………... 14
Urinary RAS……….. 14
Other urinary biomarkers………... 15
Thiazolidinediones……….. 15
Renoprotection of thiazolidinediones……….... 16
2. HYPOTHESIS AND SPECIFIC AIMS……….. 18
3. MATERIALS AND METHODS……….. 19
Chronic treatment with rosiglitazone and spironolactone………... 19
vi
Western blot analysis………... 20
Immunohistochemistry………... 21
Measurement of blood glucose levels……… 22
Glucose tolerance test………. 22
Plasma hormone and lipids measurement……….. 22
Plasma aldosterone levels measurement……… 23
ACE2 activity………. 23
Urine collection……….. 23
Urinary albumin assay……… 23
Urinary creatinine assay………. 24
Statistical analysis……….. 25
4. RESULTS……….. 61
General physiologic, metabolic and body composition parameters………... 61
Plasma hormone and lipid parameters……… 62
Assessment of renal function……….. 63
Plasma aldosterone levels measurement……… 63
Enzyme activities measurement………. 64
Renal protein expression of ACE2, NEP and MR………. 64
Effect of rosiglitazone ………... 64
Effect of spironolactone………. 68
Immunohistochemistry of renal sections……… 71
Western blot of urine……….. 71
5. DISCUSSION………. 72
6. CONCLUSION……….. 83
7. APPENDICES……… 85
vii
LIST OF FIGURES Page
1. Effect of rosiglitazone on blood glucose………... 30
2. Effect of rosiglitazone on body weight………... 31
3. Effect of rosiglitazone on food intake………... 32
4. Effect of rosiglitazone on water intake……… 33
5. Effect of rosiglitazone on absolute body fat……… 34
6. Effect of rosiglitazone on absolute lean mass….……… 35
7. Effect of rosiglitazone on total body water….……… 36
8. Effect of spironolactone on blood glucose……….. 37
9. Effect of spironolactone on body weight………. 38
10. Effect of spironolactone on food intake……….. 39
11. Effect of spironolactone on water intake………... 40
12. Effect of spironolactone on absolute body fat………... 41
13. Effect of spironolactone on absolute lean mass….………... 42
14. Effect of spironolactone on total body water….………... 43
15. Plasma aldosterone levels at 16 weeks……… 44
16. Renal ACE2 activity at 16 weeks……… 45
17. Urinary ACE2 activity at 14 weeks………... 45
18. Effect of rosiglitazone on glucose tolerance in control and db/db mice... 46
19. Effect of rosiglitazone on urinary glucose excretion………... 47
20. Effect of spironolactone on urinary glucose excretion……… 47
21. Effect of rosiglitazone on urinary albumin excretion……….. 48
22. Effect of spironolactone on urinary albumin excretion………... 49
23. Effect of rosiglitazone on urinary total protein excretion………... 50
24. Effect of spironolactone on urinary total protein excretion………. 50
viii
26. Effect of spironolactone on plasma aldosterone levels………... 51
27. Effect of rosiglitazone on renal ACE2 activity………... 52
28. Effect of spironolactone on renal ACE2 activity……… 52
29. Effect of rosiglitazone on urinary ACE2 activity……… 53
30. Effect of spironolactone on urinary ACE2 activity………... 53
31. Renal NEP and MR protein expression at 16 weeks……….. 54
32. Effect of rosiglitazone on renal NEP and MR protein expression……….. 55
33. Effect of rosiglitazone on renal ACE2 protein expression……….. 56
34. Effect of spironolactone on renal ACE2 and MR protein expression…………. 57
35. Effect of rosiglitazone on urinary ACE2 excretion………... 58
36. Immunohistochemistry for NEP in renal tissue sections………... 59
ix
LIST OF TABLES Page
1. Age dependent changes in metabolic parameters of lean control and db/db
diabetic mice………... 26 2. Age dependent changes in renal function parameters of lean control and db/db
diabetic mice ………….………... 27 3. Effect of rosiglitazone on plasma hormone and lipid parameters in lean
control and db/db diabetic mice………... 28 4. Effect of spironolactone on plasma hormone and lipid parameters in lean
control and db/db diabetic mice………...………... 29
1
1. INTRODUCTION
Diabetes
Diabetes mellitus is a metabolic disorder resulting in disturbances of carbohydrate, fat and
protein metabolisms caused by a relative or complete lack of insulin or a defect in the normal
actions of insulin. According to the International Diabetes Federation, approximately 194 million
people were suffering from type II diabetes in 2003 (Matheson et al., 2010). This worldwide
epidemic is estimated to reach 366 million people by 2030 (Hayashi et al., 2010). In the United
States alone, 25.8 million people are suffering from diabetes (Zhang, 2011). The economic cost
of diabetes is estimated to reach $490 billion by 2030 (Farag & Gaballa, 2011). Type II diabetes
is considered to be the most common form of diabetes and accounts for 90-95% of the people
with the disease (Ettaro et al., 2004). There are several risk factors such as family history,
obesity, hypertension and dyslipidemia contributing to the development of type II diabetes
(Bindom & Lazartigues, 2009). Type II diabetes leads to the development of many long-term
macrovascular and microvascular complications. Macrovascular complications include
cardiovascular and cerebrovascular diseases whereas microvascular include nephropathy,
retinopathy and neuropathy (Massi-Benedetti, 2002). Diabetic subjects are more prone to the risk
of development of heart disease and stroke compared to non-diabetic subjects (Haffner et al.,
1998).
Diabetes mellitus can be classified into three types. Type I diabetes, also known as insulin
dependent diabetes mellitus (IDDM) or juvenile onset diabetes, is a chronic metabolic disorder caused by β-cell destruction that leads to insulin deficiency. It requires insulin treatment constantly. Type II diabetes is characterized by relative resistance to insulin and dysfunction of
2
the β-cells in the pancreatic islets of Langerhans. The third type, gestational diabetes mellitus, occurs during pregnancy (Massi-Benedetti, 2002).
Renin angiotensin system and diabetes
Renin angiotensin system (RAS) is activated in diabetic human subjects as well as experimental
animals. An increase in extracellular glucose stimulates angiotensinogen gene expression in rat
proximal tubules by generating reactive oxygen species (Hsieh et al., 2002). The glucose
response element present on the angiotensinogen gene promoter region of tubular cells is also
responsible for the increased angiotensinogen gene and angiotensin II (Ang II) secretion induced
by high glucose concentration (Zhang et al., 2002). Ang II and angiotensin converting enzyme
(ACE) are involved in the initiation and progression of several diabetic complications such as
retinopathy, nephropathy, hypertension and cardiovascular disease (Ribeiro-Oliveira, Jr. et al.,
2008). Clinical trials showed that the blockade of RAS with angiotensin converting enzyme
inhibitors (ACEIs) and angiotensin type 1 receptor blockers (ARBs) decreasesthe cases of
diabetes mellitus (Filipiak, 2010). Ang II is responsible for the development of endothelial cell
dysfunction, insulin resistance, inflammation and several proliferative effects (Watanabe et al.,
2005). Augmentation of renal Ang II levels leads to the development of diabetic nephropathy
which progresses into end stage renal disease (Giacchetti et al., 2005). ACEIs or ARBs increase
renal plasma flow and glomerular filtration rate in type I diabetic patients (Hollenberg et al.,
2003). Blockade of the Ang II type 1 receptor (AT1R) augmented renal plasma flow and
suppressed filtration fraction in the type II diabetic patients suggesting that a RAS blockade
improves intrarenal hemodynamics (Fliser et al., 2005). Many studies have shown that Ang II via
the AT1R signaling pathway induces insulin resistance which can be reversed by a RAS
3
Renin-Angiotensin System (RAS) enzyme cascade
Modified from (George et al., 2010)
Renin angiotensin system (RAS)
The renin angiotensin system plays a crucial role in blood pressure regulation and electrolyte
balance (de et al., 2000). RAS is not only found in circulation but also expressed in tissues like
brain, kidney, pancreas, adipocytes and other organs (Campbell, 1987; Campbell, 1987; Leung &
Chappell, 2003; Campbell, 1987; Kershaw & Flier, 2004). The RAS cascade consists of many
enzymatic reactions and begins with the formation of angiotensin I (Ang I) from hepatic protein
angiotensinogen (AGT) via renin (Peach, 1977). Ang I is further converted by ACE, a peptidyl
dipeptidase that belongs to gluzincin family of metalloproteases, into Ang II (Guy et al., 2003).
4
vasoconstrictor Ang II which is biologically active (Elased et al., 2006). ACE also cleaves
bradykinin, vasodilator, at two C-terminal dipeptides and inactivates it (Guy et al., 2003).
Angiotensin II (Ang II)
Ang II is an octapeptide which is responsible for the blood volume regulation and vascular
resistance. Ang II is not only produced in the circulation but also in tissues like brain, kidney,
heart and blood vessels (de et al., 2000). Studies have shown that there is a dose dependent
increase in the renal blood flow and glomerular filtration rate upon administration of Ang II
exogenously (Paul et al., 2006; Yamamoto et al., 2001). Progressive augmentation of intrarenal
Ang II causes proteinuria and damage to the glomerular filtration barrier (Hoffmann et al., 2004;
Whaley-Connell et al., 2006). It has been suggested that, in the circulating RAS, plasma Ang II
production is widely dependent on the generation of renin from the kidney, whereas in the
vascular tissues, ACE and other peptidases regulate the production of Ang II (Miyazaki & Takai,
2006).
Angiotensin II receptors
Ang II acts through two major receptor subtypes, AT1R and Ang II type 2 receptor (AT2R)
(Chen et al., 2003). Two subtypes of the AT1R, AT1A and AT1B have been identified in rats
(Iwai & Inagami, 1992) and mice (Sasamura et al., 1992). The mouse AT1R genes AT1a and
AT1b map to different chromosomes: 13 and 3 respectively (MacTaggart et al., 1997). Virtually
all of the known physiological and pathophysiological actions ofAng II such as regulation of
arterial blood pressure, electrolyte and water balance, thirst, hormone secretion and renal
function are mediated through AT1 receptor, in cardiovascular, renal, neuronal, endocrine,
hepatic and other target cells (de et al., 2000). Smooth muscle contraction, neuronal activation,
5
are considered to be part of the cellular responses induced by AT1R signaling systems (de et al.,
2000). AT1 and AT2 receptors are primarily expressed in blood vessels, heart, kidney, adrenal
glands and liver of humans (Ribeiro-Oliveira, Jr. et al., 2008). In the kidney AT1 receptors are
primarily localized in the proximal tubules, thick ascending loop of Henley, glomeruli, arteries
and juxtaglomerular cells (Tufro-McReddie et al., 1993). Apart from the known beneficial
physiological functions, AT1 receptors also exhibit some pathological functions such as
activation of growth factor receptors, reactive oxygen species generation, vasoconstriction and
other inflammatory responses upon activation by Ang II (Hunyady & Catt, 2006). In contrary,
AT2 receptors stimulates the formation of bradykinin and nitric oxide, thereby mediating effects
opposite to the ones of AT1 receptors (Siragy & Carey, 1999).
Angiotensin (1-7) (Ang 1-7) forming enzymes
Ang (1-7)
Ang (1-7), a heptapeptide, is formed from Ang II by the action of ACE2 or from Ang I by the
action of neutral endopeptidase (NEP) and propyl endopeptidase (PEP) and is further degraded
to Ang (1-5) by ACE (Donoghue et al., 2000; Tipnis et al., 2000; Chappell et al., 2004; Rice et
al., 2004). The peptide is not only found in the circulation but also in many tissues like heart,
kidney, blood vessels, liver and is considered to be a potential target for the development of new
drug because of its opposing effects on Ang II induced actions (Chappell, 2007; Santos &
Ferreira, 2007; Simoes e Silva AC et al., 2006). Mas, a G-protein coupled receptor, binds Ang
(1-7) and modifies the intracellular signaling of AT1R upon activation by Ang II (Bohlen und et
6
A study involving transgenic rats overexpressing human ACE2 demonstrated an improvement in
the endothelial function and decreased Ang II induced vasoconstriction which may be either due
to the increase in Ang (1-7) or decrease in the oxidative stress caused by Ang II (Rentzsch et al.,
2008). Another study showed that chronic treatment of streptozotocin-treated spontaneously
hypertensive rats with Ang (1-7) demonstrated an improvement in renal function and endothelial
function of the renal artery by attenuating NADPH dependent oxidative stress (Benter et al.,
2008). These findings suggest that the ACE2-Ang (1-7)-Mas axis can be considered a potential
new therapeutic target for cardiovascular and renal protection (Rabelo et al., 2011).
Angiotensin converting enzyme 2 (ACE2)
ACE2 was discovered by two independent groups in 2000 and shares 42% homology with the
catalytic domain of ACE (Tipnis et al., 2000). It is a type I transmembrane glycoprotein
consisting of 805 amino acids with a molecular weight of 120KDa (Imai et al., 2010). It is
primarily distributed in heart, kidney (proximal tubular epithelium), testis and endothelial cells
(Donoghue et al., 2003). It is found to a lesser extent in vascular smooth muscle cells (Burrell et
al., 2004). ACE2 has also been identified in gastrointestinal tract, brain and lungs (Harmer et al.,
2002). It cleaves a single C-terminal peptide of Ang II to form a vasodilator peptide Ang (1-7)
(Tipnis et al., 2000; Vickers et al., 2002). It also catalyses the cleavage of single residue from
Ang I to form Ang (1-9) (Donoghue et al., 2000). Attenuation of ACE2 by SARS-CoV infection
leads to the development of severe lung failure in SARS suggesting a protective role of ACE2 in
SARS pathogenesis (Kuba et al., 2005). C-terminal domain of ACE2 has 48% sequence identity
with a non catalytic protein, collectrin that plays a role in pancreatic beta-cell proliferation and
insulin exocytosis (Akpinar et al., 2005; Fukui et al., 2005). ACE2 attenuates atherosclerosis and
7
stress via Ang (1-7) (Lovren et al., 2008). In the rat kidney, ACE2 mRNA is expressed in all
segments of the nephron except ascending loop of Henley with a higher expression in proximal
tubules and inner collecting ducts (Li et al., 2005). Moreover, identification of Mas receptor in
the rat proximal tubular cells indicates that ACE2 might mediate production of Ang (1-7) and
thus inhibit the effects of locally generated Ang II (Su et al., 2006).
Neprilysin
Neprilysin or neutral endopeptidase belongs to the M13 family of zinc-containing
metallopeptidases and is involved in the metabolism of several biologically active peptides (Rose
et al., 2002). It degrades Ang I and forms a vasodilator peptide Ang (1-7) (Igic & Behnia, 2007).
It was first identified in the brush border of proximal tubule and is known to hydrolyze the
insulin B chain (Kerr & Kenny, 1974). It hydrolyzes many biologically active peptides such as
tachykinins, bradykinin and natriuretic peptide into their inactive forms (Matsas et al., 1983;
Gafford et al., 1983; Kenny & Stephenson, 1988; Schwartz et al., 1990). Neprilysin inhibitors are
also used as therapeutic agents in the field of cardiovascular disease (Bralet & Schwartz, 2001)
and ACE2 expressed in the podocytes play a role in the formation of vasodilator peptide Ang
(1-7) (Velez et al., 200(1-7).
Aldosterone
Aldosterone was the first physiological mineralocorticoid hormone discovered more than 50
years ago (SIMPSON et al., 1953). Aldosterone is synthesized in the adrenal cortex from its
precursor deoxycorticosterone and was initially called electrocortin (Funder, 2010). Plasma
aldosterone levels are regulated by the body fluid volume and plasma Na+ and K+ levels (Funder, 2010). Drop in body fluid volume causes angiotensin II to mediate aldosterone secretion
8
angiotensinogen knockout and wild type mice independent of angiotensin II (Funder, 2010;
Okubo et al., 1997). Studies show that apart from the adrenal cortex, aldosterone can also be
synthesized locally in other organs like brain, heart, blood vessels and kidney (Kang & Cha,
2009).
Aldosterone is also involved in the pathogenesis of cardiovascular, renal and metabolic diseases
(Takeda, 2009). There is an increase in the aldosterone synthesis during essential hypertension
(Takeda, 2009). Chronic treatment with ACEIs and/or ARBs in the cardiovascular (CVD) or
renal diseases is only partially effective due to a mechanism called aldosterone escape
phenomenon in which aldosterone levels were initially decreased upon treatment with ACEIs
and/or ARBs but increased with progression of treatment (Sato & Saruta, 2003; Bomback &
Klemmer, 2007). Incidence of cardiovascular disease is higher in patients with primary
aldosteronism than in patients with essential hypertension suggesting that aldosterone plays an
important role in the pathogenesis of cardiovascular and renal disease independent of blood
pressure (Milliez et al., 2005). As the plasma aldosterone levels rise urinary protein excretion
rate increases and glomerular filtration rate (GFR) decreases contributing to chronic kidney
disease (CKD) (Bianchi et al., 2005; Quinkler et al., 2005). According to PAPY study (primary
aldosteronism prevalence in Italy), essential hypertensive patients with normal plasma
aldosterone levels have lesser urinary albumin excretion rate compared to those with
hyperaldosteronism (Rossi et al., 2006). Aldosterone is also known to increase oxidative stress
by activation of NADPH oxidase enzyme and attenuation of glucose-6-phosphate dehydrogenase
activity, mechanisms proposed to contribute to kidney injury (Leopold et al., 2007; Grossmann
9
Mineralocorticoid receptors (MR)
Mineralocorticoid receptors are nuclear steroid receptors which demonstrate genomic effects
such as regulation of transcription of epithelial sodium channel, serum glucocorticoid- induced
protein kinase 1(sgk1) and non genomic effects such as extracellular regulated
kinase/mitogen-activated protein kinase pathways (Odermatt & Atanasov, 2009; Grossmann & Gekle, 2009).
Aldosterone plays a major role in electrolyte and blood pressure regulation and mediates its
effects through activation of mineralocorticoid receptor (MR) (Nishiyama et al., 2010a). The
level of glucocorticoids such as cortisol and corticosterone are much higher in the circulation
compared to aldosterone (Funder, 2010). Interestingly, glucocorticoids and mineralocorticoids
have equal affinity for MR compared to aldosterone (Krozowski & Funder, 1983). In order to
prevent the activation of MR by cortisol in humans or corticosterone in rats, an enzyme called
11-β hydroxysteroid dehydrogenase converts cortisol to cortisone and corticosterone to 11
dehydrocorticosterone in rats, enabling the activation of MR by aldosterone only (Edwards et al.,
1988; Funder et al., 1988). However, in vivo studies showed that MRs in some tissues like kidney is more sensitive to aldosterone than those located in the heart (Edwards et al., 1988).
MR blockers
MR activation by aldosterone and cortisol can be blocked by MR blockers such as eplerenone
and spironolactone (Tirosh et al., 2010). MR blockers are used in the treatment of hypertension
as they reduce morbidity and mortality in patients with heart failure (Nishiyama et al., 2010a).
Antihypertensive effects of MR blockers are mediated through several pathways especially by
preventing the activation of MR through aldosterone, potassium reabsorption and decrease of
body fluid levels (Nishiyama et al., 2010a). Combination therapy of MR blockers with ACEIs
10
carried on CKD patients (Chrysostomou et al., 2006). Spironolactone, a non selective MR
blocker when coupled with ACEIs decreased albuminuria in patients with diabetic nephropathy
(Sato et al., 2003). Spironolactone blocks MRs in STZ induced diabetic rats and prevents renal
fibrosis seen in early diabetic kidney injury (Fujisawa et al., 2004). Some studies have shown
that spironolactone treatment increases nitric oxide bioactivity and improves endothelial
dysfunction in patients with congestive heart failure (Farquharson & Struthers, 2000). However,
due to its adverse effects such as gynecomastia, a more potent and selective MR antagonist,
eplerenone was developed (Takeda, 2009). Eplerenone, a selective antagonist of
mineralocorticoid receptor is as equipotent as enalapril, an ACEI, in the treatment of
hypertension and more potent in reducing albuminuria (Williams et al., 2004). Eplerenone when
used in combination with ACEIs/ARBs is effective in reducing albuminuria in type II diabetic
nephropathy patients (Sato et al., 2003). There was a phenomenal decrease in the blood pressure
in Japanese patients treated with eplerenone compared to other anti-hypertensive agents such as ARBs, ACEIs, β-blockers or calcium blockers given either individually or in combination (Nishiyama et al., 2010a).
Diabetic nephropathy
Diabetic nephropathy is one of the microvascular complications of type II diabetes and a leading
cause for the development of end stage renal disease (Gurley & Coffman, 2010). Albuminuria,
hypertension and impaired renal function are the characteristics of diabetic nephropathy. Strict
controls of blood pressure, glycemia as well as therapeutic approaches aimed at blocking the
RAS are strategies known to improve symptoms of diabetic nephropathy (Tan et al., 2010).
Molecular and structural abnormalities in the podocyte slit diaphragm of the glomerular
11
proliferation and thickening of glomerular basement membrane (Ziyadeh & Wolf, 2008;
Langham et al., 2002). Ang II plays a key role in the pathogenesis and progression of diabetic
kidney injury via depletion of glomerular nephrin and increase in glomerular pore size (Bichu et
al., 2009). Thus, blockade of Ang II is considered crucial in the treatment of diabetic
nephropathy. Blockade of RAS with ACEIs and ARBs imparts renoprotection via
anti-inflammatory and anti-fibrotic mechanisms (Hauser & Horl, 2001). ACEIs usually reduce the
formation of Ang II from ACE, as a result effects of Ang II such as vasoconstriction, increased
cell growth, progressive glomerular sclerosis can be decreased (Tan et al., 2010). ARBs, on the
other hand block AT1R through which Ang II exerts its effects and stimulates AT2R mediating
effects opposite to AT1R (Burns, 2000). Due to the inadequate sensitivity and specificity of the
methods used to diagnose diabetic nephropathy there is a need for the identification of
noninvasive and early biomarkers to diagnose and treat this disease (Wu et al., 2010).
Animal models of diabetic nephropathy
Limited progress has been made in understanding the factors that contribute to the development
of diabetic nephropathy. Hence, development of an ideal animal model which mimics the human
disease is essential for a better understanding. In the year 2005, Animal Models of Diabetic
Complications Consortium (AMDCC) published the phenotyping standards and validation
criteria for the available murine models of diabetic nephropathy (Breyer et al., 2005). According
to AMDCC, criteria for mouse model of diabetic nephropathy includes greater than 50% decline
in the GFR, greater than 10 fold increase in the albuminuria compared to controls, advanced
mesangial matrix expansion and thickening of glomerular basement membrane by more than
50% over baseline tubulointerstitial fibrosis (Brosius, III et al., 2009). There are several mouse
12
model for type II diabetes. These mice have a mutation deletion in the leptin receptor which
makes them more susceptible to diabetic complications (Sharma et al., 2003). Albuminuria,
mesangial matrix expansion and podocyte loss leads to the development of diabetic nephropathy
in these mice (Brosius, III et al., 2009; Sharma et al., 2003; Susztak et al., 2006). Thus, they pose
to be a good model for studying the early changes of diabetic nephropathy. Another mouse
model for diabetic nephropathy is the type I diabetic OVE26 mouse that is characterized by increased expression of calmodulin in pancreatic β cells (Xu et al., 2010). Similar to db/db mice,
these mice also demonstrate increased albumin excretion, decreased podocyte number and
increased mesangial matrix. However, due to some limitations, they can only be used for
studying the advanced features of diabetic nephropathy (Reiniger et al., 2010). One of the major
mouse models for diabetic nephropathy is eNOS deficient db/db or eNOS-/-db/db mouse
characterized by type II diabetes, hypertension, obesity, albuminuria and mesangial expansion
(Zhao et al., 2006a; Mohan et al., 2008). Any abnormality in NO production plays a major role in
renal injury (Komers & Anderson, 2003; Prabhakar, 2005). Similarly, two independent groups
generated type I diabetic mouse model with deficiency in eNOS activity by injecting high and
multiple low doses of streptozotocin (STZ) (Nakagawa et al., 2007) eNOS-/- diabetic mice depicted a 10- fold increase in albuminuria with low dose STZ and 40 fold increase in
albuminuria with high dose STZ. Similarly, various other murine models such as AKITA, BTBR
ob/ob mice were developed for a better predictability of the factors that contribute to diabetic nephropathy (Alpers & Hudkins, 2011).
Renoprotection of ACE2
In type II diabetic patients, kidney disease is often associated with attenuation in renal ACE2
13
glomerulus of diabetic mice whereas ACE was increased compared to control mice (Ye et al.,
2006). Administration of ACE2 inhibitor MLN – 4760 increased albuminuria, glomerular
mesangial matrix expansion and fibronectin deposition in glomerulus of db/db and STZ mice (Ye et al., 2006; Soler et al., 2007). Ang II dependent blood pressure increased substantially in
ACE2 - deficient mice than in wild type mice (Gurley et al., 2006). Treatment with MLN-4760,
decreased renal cortical ACE2 activity in a mouse model of CKD (5/6 nephrectomy or 5/6 Nx
mice) (Dilauro et al., 2010). In mice lacking ACE2, glomerulosclerosis is associated with
impairment in the glomerular filtration barrier which further increases the urinary albumin
excretion (Oudit et al., 2006). Human recombinant ACE2 improved kidney function in type 1
diabetic AKITA mice by suppressing the Ang II induced activation of NADPH oxidase activity
(Oudit et al., 2010).
Urinary biomarkers
Urine is one of the clinical samples used as a tool for the identification of biomarkers in the
diagnosis and prognosis of disease because of its ready availability, simple and non invasive
collection (Thongboonkerd, 2008). Urine is produced by glomerulus after filtration of plasma
and most of it is reabsorbed by the renal tubule (Decramer et al., 2008). Thus, only a small
portion of it exits through the kidney (Decramer et al., 2008). Urine is a reservoir of many
proteins and peptides which are stable and less complex (Wu et al., 2010). The changes in kidney
and urogenital tract functions can be assessed by the amount and composition of these proteins in
urine (Wu et al., 2010). Renal damage, oxidative stress, low grade inflammation and endothelial
stress are the three main conditions responsible for the presence of biomarkers related to diabetes
14
Albuminuria
Markers for diabetic nephropathy in the urine are a result of kidney damage, oxidative stress or
inflammation and vascular damage (Matheson et al., 2010). Microalbuminuria was used as a
marker for the diagnosis of diabetic nephropathy. Glomerulus of the kidney filters certain
amount of low molecular weight proteins such as albumin from the plasma but most of it is
reabsorbed back (Barratt & Topham, 2007). Microalbuminuria is a condition where the amount
of albumin excreted per day is 30-300mg/day, which is not a detectable range (Barratt &
Topham, 2007). Macroalbuminuria is a condition where the amount of albumin excreted exceeds
300mg/day (Matheson et al., 2010). The kidney has already undergone significant damage by the
time its detected (Barratt & Topham, 2007).
Urinary RAS
Intrarenal RAS plays a significant role in the pathogenesis of diabetic nephropathy (Kobori et al.,
2007). Angiotensinogen (AGT), a substrate of renin, is present in high concentrations in the
urine of hypertensive patients and is formed in the proximal tubules of the kidney (Kobori et al.,
2009). Thus, this AGT could be used as a urinary marker to assess intrarenal RAS status in
hypertensive patients (Kobori et al., 2009). Furthermore there was a positive correlation between
urinary albumin, serum creatinine, sodium excretion and urinary AGT (Kobori et al., 2008).
There is also an elevation of urinary AGT in chronic kidney disease (Kobori et al., 2008). All
these observations make it a good urinary biomarker for determination of the severity of CKD
15
Other urinary biomarkers
Many new biomarkers in urine were discovered of which fatty acid binding protein 1 (FABP1) is
one example (Noiri et al., 2009).
Adiponectin is a protein hormone exclusively produced in adipocytes with insulin sensitizing,
anti inflammatory and anti atherosclerotic effects (Kadowaki & Yamauchi, 2005). Diabetes
induced stress in the glomerular capillaries causes adiponectin to shed off from the endothelial
surface into the urine (von Eynatten et al., 2009). Thus it can be used as a urinary biomarker for
indicating the vascular damage in type 2 diabetes (von Eynatten et al., 2009).
Another biomarker of kidney disease is the pigment epithelium derived factor, a serine protease
inhibitor used for detection of diabetic nephropathy (Chen et al., 2010).
Thiazolidinediones
Thiazolidinediones (TZDs) are synthetic ligands which have high affinity towards subunit of Peroxisome proliferator activated receptor (PPAR) and are clinically used to increase insulin sensitivity in type II diabetic patients (Weatherford et al., 2007). PPAR is a ligand activated transcription factor known to be involved in causing inflammation, cancer, Alzheimer’s disease, diabetes and cardiovascular diseases such as hypertension and atherosclerosis (Weatherford et
al., 2007). They are found mainly in adipose tissue cells but are also found in vascular
endothelial cells, vascular smooth muscle cells, macrophages, renal glomerular and tubular cells
(Sarafidis & Bakris, 2006). Apart from strict glycemic control PPAR agonists also control blood pressure by directly acting on the blood vessel (Weatherford et al., 2007). Studies showed that
PPAR decreased Ang II induced elevation of blood pressure in rats, improved endothelial function in double- transgenic mice and caused down regulation of AT1 receptor gene
16
expression in vascular smooth muscles (Diep et al., 2002; Ryan et al., 2004; Sugawara et al.,
2001).
Renoprotection of thiazolidinediones
Association between metabolic syndrome and insulin resistance coupled with elevated urinary
albumin excretion has been known and studied for the past many years (Sarafidis et al., 2006).
Apart from their insulin sensitizing properties, TZDs also showed attenuation of blood pressure
and triglycerides as well as redistribution of body fat from the central component (Lebovitz &
Banerji, 2001; Stolar & Chilton, 2003). Accumulating evidence suggests that TZDs exhibit
renoprotective effects. Chronic treatment with rosiglitazone in patients with type II diabetes and
hypertension reduced urinary albumin excretion by 30% and 60% in patients with type II
diabetes and microalbuminuria respectively (Pistrosch et al., 2005; Sarafidis et al., 2005). The
mechanism of action of renoprotective effects of TZDs is not clear. Reduction in blood glucose
and elevated insulin levels, inhibition of tubular and glomerular cell proliferation, reduction of
TGF-β, blood pressure (BP) attenuation, reduction in oxidative stress in the kidney and
prevention of the activation of the RAS are some of the effects of TZDs contributing to the
attenuation of urinary albumin excretion (UAE) and renal injury (Sarafidis & Bakris, 2006).
According to many In vitro studies, TZDs especially rosiglitazone, decreased production of Ang I and II from human subcutaneous adipocytes and also attenuated expression of both AT1R
mRNA and protein expression in vascular smooth muscle cells (Takeda et al., 2000; Harte et al.,
2005; Sugawara et al., 2001). There are not many lines of evidence demonstrating the beneficial
effects of rosiglitazone on RAS blockade in vivo. Rosiglitazone and pioglitazone inhibited the detrimental effects of Ang II infusion such as endothelial dysfunction, development of
17
show beneficial effects on the vasculature by improving endothelial function and reducing
inflammation (Campia et al., 2006). However, recently safety of TZDs was questioned because
of the claims that they increased myocardial infarction (Nissen & Wolski, 2007). Rosiglitazone
increase tissue insulin sensitivity and is shown to be protective against worsening of nephropathy
and hypertension in diabetes. Mechanisms underlying protection at the renal level is not fully
elucidated. One of goal of the present study is to investigate the effect of normalizing
18
2. HYPOTHESIS AND SPECIFIC AIMS
2.1. Hypothesis
Increase of plasma aldosterone levels in db/db mice downregulates renal ACE2 and contributes to development of albuminuria. Treatment with MR blockers and/or strict glycemic control will
correct this imbalance and protect against albuminuria.
2.2. Specific aims
1. To test the hypothesis that hyperglycemia increases plasma aldosterone levels in db/db mice which leads to albuminuria and this could be corrected by normalizing blood glucose levels
with the antidiabetic medication rosiglitazone, or by giving MR antagonist spironolactone.
2. To test the hypothesis that spironolactone ameliorates albuminuria in db/db mice through increase in renal ACE2.
3. To test the hypothesis that strict glycemic control using rosiglitazone imparts renal protection
19
3. MATERIALS AND METHODS
Animals
Male (5-6 wk) db/db diabetic mice with background strain C57BL/KsJ (BKS.Cg-Dock7m +/+ Leprdb/J) and their age-matched non-diabetic lean control mice (db/m) were purchased from Jackson Laboratories (Bar Harbor, ME). Mice were housed individually at room temperature
(22C) in a 12:12 hour light/dark cycle. db/db mice serve as a good model for type II diabetes. These mice have point mutation in the diabetic (db) gene that encodes for a point mutation in the leptin receptor gene leading to abnormal splicing and defective signaling of the adipocyte-
derived hormone leptin (Chen et al., 1996). All experimental protocols were approved by WSU
animal care and use committee.
3.1. Chronic Treatment With Rosiglitazone And Spironolactone
Five week old db/db and their age-matched lean control mice were randomly assigned to
rosiglitazone (LKT laboratories, Inc. St. Paul, MN, USA) and spironolactone (Sigma Aldrich, St.
Louis, MO) treatment. Each group consisted of 7-8 mice. Remaining mice from db/db and control groups were provided with normal chow. Rosiglitazone group was given 20 mg/kg/day
rosiglitazone mixed in food pellets for 10 weeks. Spironolactone group received 100 mg/kg/day
spironolactone mixed in food pellets for 10 weeks. To determine the changes in physiologic and
metabolic parameters in treated and untreated groups both in normal and disease states, mice
were regularly monitored for blood glucose, body weight, food intake, water intake and urine
output over a duration of 8 weeks. After 10 weeks of treatment, mice were euthanized by
decapitation and trunk blood was collected in ice-chilled heparinized tubes. Blood was
centrifuged at 10,000 x g for 10 minutes at 4° C. Plasma was separated, aliquoted and stored at
20 3.2. Body composition measurement
Body composition was measured using an ECHO MRI absolute body composition analyzer
(Houston, TX, USA). After the instrument was calibrated, the body weight of the mouse was
measured. Then the mouse was placed in a clear plastic cylinder and held in position with a
plastic plunger to avoid any movements. This setup was placed inside the instrument and the
measurements were taken. At the end of the measurement the mouse was placed back in its cage.
3.3. Western blot analysis
Mice were sacrificed by decapitation and kidneys were quickly removed and homogenized on
ice in phosphate buffered saline (PBS) containing protease inhibitor (Complete lysis M, Roche
diagnostics, Mannheim, Germany). Tissue homogenates were centrifuged at 10,000 x g for 10
min at 4° C to remove cellular debris. Total protein content was determined in supernatant using
BSA as a standard and BioRad reagent (BioRad, Hercules, CA). Fifty microliters (µl) of tissue
lysate was added to 50 µl sample loading buffer (8% SDS, 125 mmol/L Tris-HCl, pH-6.8, 20%
glycerol, 0.02% bromophenol blue, 100 mmol/L dithiothreitol) and boiled for 10 minutes.
Protein (50-100µg) was loaded into the wells of a 10% SDS-PAGE gel and separated by
electrophoresis for 1 hour. Proteins on gel were then transferred (Bio-Rad transfer apparatus,
Hercules, CA) to a 0.2 µm PVDF membrane (Millipore, MA). The membrane was blocked for 1
hour with 10% non-fat milk in 10 mM Tris buffered saline with Tween 20 (TBS-T) at room
temperature (RT). For analysis of MR, NEP and ACE2 membranes were probed over night at
4°C with rabbit anti-MR antibodies (1:250, Santa Cruz, CA), goat anti-NEP (1:500, R&D, MN)
and goat anti-ACE2 (1:1000, R&D, MN) respectively. Primary antibodies were diluted in 5%
21
minutes at RT. The membrane was then incubated with diluted horse radish peroxidase
conjugated to donkey anti-rabbit (dilution 1:20000 in TBS-T, Jackson Immunoresearch, PA),
donkey anti goat (1:2000 in TBS-T, R&D) or donkey anti-mouse (dilution 1:40000 in TBS-T,
Jackson immunoresearch, PA) secondary antibodies at RT for 1hour. The membrane was washed
3 times for 3 minutes using TBS-T buffer. Blots were detected using supersignal
chemiluminescent substrate and visualized by exposing the membrane for 1 minute using a
Fujifilm image analyzer (LAS 3000, image Quant, Sunnyvale, CA).The relative amounts of proteins of interest were determined by normalizing to β-actin. Western blot images were quantified using Image Quant TL software using β-actin as an internal loading control.
3.4. Immunohistochemistry
Mice were injected with Euthasol-130mg/ml (0.05ml/40g mouse).They were perfused
transcardially with ice cold PBS to flush out the blood and then with 4% Paraformaldehyde for
10 min. Paraffin sections were deparafinized by washing in xylene for 5 min and subsequent
hydration with 100%, 95%, 70%, 50% and 30% ethanol for 5min each. Sections were then rinsed
with distilled H2O and PBS. Rinsed sections were transferred to water bath containing 10mM
sodium citrate and boiled for 30 minutes. Boiled sections were blocked using 3% normal horse
serum (diluted in PBS containing 0.1% Triton-X) for 1hour at 4oC. Primary antibodies MR (1:250, Santacruz, CA), NEP (1:500, R&D, MN) and ACE2 (1:500, R&D, MN) were diluted in
3% normal horse serum and sections were incubated in diluted primary antibodies overnight at
4oC. The sections were then washed with PBS three times and incubated with their respective CY3 secondary antibodies (Jackson Immunoresearch, PA) for 2 hours at 4oC. MR was incubated with donkey anti - rabbit secondary antibody conjugated with CY3 fluorescent dye and ACE2,
22
NEP were incubated with donkey anti - goat secondary antibody conjugated with CY3 fluorescent dye. Slides were air dried and mounted using a vectashield mounting medium
(Vector, Burlingame, CA). Images were taken using a fluorescence microscope (Optronics,
Goleta, CA).
3.5. Measurement of blood glucose levels
FreeStyle® Blood Glucose Test Strips and FreeStyle Lite® Blood Glucose Monitoring System
(Abbott, CA) was used to determine blood glucose levels on a drop of tail blood collected
between 10 am and midday, or at intervals thereafter as indicated. A cut was made at the tip of
the tail to draw blood samples for measurement. Values were expressed in mg/dL.
3.6. Glucose tolerance test
In order to study the glucose handling in mice, an intra-peritoneal glucose tolerance test was
performed. Mice were fasted overnight for 16 hours. Fasting blood glucose levels were measured
after the end of the fasting period. Mice were then injected with 1.5 gm/kg glucose dissolved in
water. Blood samples were drawn at 0, 15, 30, 45, 60, 90 and 120 minutes and diluted in 300µl
water and 25µl lysis buffer. Glucose concentration was determined using glucose
oxidase/peroxidase reagent kit (Sigma, St. Louis, MO).
3.7. Plasma hormone and lipids measurement
Plasma samples from the treated and untreated db/db diabetic mice and their age matched lean control mice were collected and analyzed for insulin, glucose, adiponectin, cholesterol and
23 3.8. Plasma aldosterone levels measurement
Plasma aldosterone levels were measured using an aldosterone ELISA immune assay kit
purchased from Alpco diagnostics (Salem, NH). Absorption was read at 450nm using FusionR Packard plate reader.
3.9. ACE2 activity
ACE2 activity was measured using the substrate Mca-APK-Dnp. It involves the principle of
emission of fluorescence from the Mca substrate (quenched by Dnp group) upon cleavage by
ACE2. After cleavage fluorescence was detected at excitation: 328 nm and Emission: 393nm
(FusionR Packard plate reader). ACE2 activity was measured in presence of 10mM lisinopril (ACE inhibitor), to prevent any interference from ACE. Four microliters (32-40 µg protein) of
kidney lysate or 5-20 µl (40-60 µg protein) of urine sample were incubated with substrate in a
buffer (50mM Tris, 5mM ZnCl2, 150mM NaCl2 and 10µM lisinopril). The plate was read at 0, 1,
2, 3, 4 and 8 hours. The results were expressed as pmoles/hr/µg protein of cleaved substrate.
3.10.Urine collection
Mice were put in metabolic cages for 24 hours collection of urine with free access to food and
water. A total of 20 µl of protease inhibitor (Roche Diagnostics, IN) was added to each sample
during the 24 hours collection. Urine samples were centrifuged at 10,000 x g for 3 minutes at 4°
C to remove debris. Urine samples were then aliqouted and stored at -80° C for later use.
3.11. Urinary albumin assay
To monitor kidney function, quantitative estimation of urinary albumin was performed using a
kit purchased from the Bethyl Laboratories (Montgomery, TX). A 96 well plate was coated with
24
hour at RT. After incubation, the antibody solution was aspired from each well and washed with
wash buffer (250 μl, TBS-T) 4 times. Blocking buffer (Tris buffered saline with 1% BSA, 200 μl) was added to each well and the plate was incubated overnight at 4˚C. The next day, plate was washed 4X with TBS-T Standards were diluted according to the kit’s protocol. Urine samples
(1μl) were diluted with 500 µl of conjugate buffer and 100 μl of diluted urine samples and
standards were added to each well and incubated at RT for 1 hour. Plate was washed 4X with
TBS-T. Diluted HRP conjugated secondary antibody (1:35000 in conjugate buffer, 100 µl) was
added to each well and incubated for 1 hour at RT. Wells were then washed 4X with TBS-T.
Equal volumes of TMB substrate A and substrate B (KPL, Gaithersburg, MD) were mixed and
100 μl of this substrate mix was added to each well and incubated in dark for about 30 minutes.
The reaction was stopped by adding 2N H2SO4 (100 μl) to each well. Plate was finally read at
450 nm in FusionR Packard plate reader.
3.12. Urinary creatinine assay
Urinary creatinine assay was performed using a kit purchased from Quidel (San Diego, CA). The
excretion rate of creatinine in a normal individual is relatively constant. Thus, urinary creatinine
levels are useful in detecting renal disease and estimating the extent of impairment of renal
function. The assay is based on modified Jaffe reaction where alkaline picrate forms a colored
solution in presence of creatinine. Samples and standards were diluted 1:40 with distilled water.
Fifty microliters of diluted samples and standards were added to 96 well plate followed by addition of 150 μl of color reagent (7 mL picric acid + 1 mL 1N NaOH). This mixture was incubated for 30 minutes at RT. Plate was read at 490 nm (FusionR Packard plate reader). The
intensity of the color produced is directly proportional to the amount of creatinine present in the
25 3.13.Statistical analysis
Statistical analysis was performed using Graph pad prism 5.01 and statistica software (v.10). All
data were expressed as mean ± SEM. The differences in blood glucose, body weight, food
intake, water intake, absolute body fat, lean mass and total body water were assessed by repeated
measures two-way ANOVA followed by Bonferroni’s multiple comparison test. For more than
two groups one-way and two-way ANOVAs were used. Unpaired student’s t-test was used to
evaluate the differences between two groups. A value of p<0.05 was considered statistically
26
Table 1: Age dependent changes in metabolic parameters of lean control and db/db diabetic mice.
Mice strain Lean control db/db Lean control db/db Lean control db/db
Age (weeks) 6 6 9 9 12 12 Group size (n) 7 6 7 6 7 6 Body weight (g) 22.1±0.7 32.2±1.1* 25.1±0.5 40.9±0.7* 27.1±0.4 40.3±0.6* Blood glucose (mg/dL) 117.8±3.2 348.2±29.9* 124.8±4.7 463.8±37.9* 135.3±3.2 575.6±20.2* Food intake (g/day/mouse) 3.4±0.2 6.3±0.8* 7.3±0.2 12.7±0.4* 3.5±0.1 6.8±0.8* Water intake (ml/day/mouse) 8.1±0.2 15.4±3.1 8.8±0.6 30.7±2.1* 6.4±0.3 31.4±3.7*
Absolute body fat (g) ND ND 4.2±0.3 22.0±0.7* 5.1±0.5 21.3±0.4*
Absolute lean mass (g) ND ND 18.5±0.3# 16.0±0.8 18.5±0.2# 15.6±0.4 Total body water (g) ND ND 15.5±0.3# 13.6±0.3 15.7±0.2# 13.5±0.3
Values represent mean±SEM. *p<0.05 Vs age-matched lean control mice and # p<0.05 Vs age-matched db/db mice were considered statistically significant. ND means not determined.
27
Table 2: Age dependent changes in renal function parameters of lean control and db/db diabetic mice.
Values represent mean±SEM. *p<0.05 Vs age-matched lean control mice were considered statistically significant.
Mice strain Lean control db/db Lean control db/db Lean control db/db
Age (weeks) 5 5 10 10 14 14
Group size (n) 9 9 6 6 6 6
Albumin (mg/day) 0.1±0.004 0.2±0.01* 0.09±0.02 1.3±0.02* 0.05±0.005 1.5±0.04*
Total protein excretion
(mg/day) 2.7±0.1 1.2±0.1 4.5±0.7 21.4±3.0* 4.6±0.5 27.0±3.0*
28
Table 3: Effect of rosiglitazone on plasma hormone and lipid parameters in lean control and db/db diabetic mice.
Values represent mean±SEM *p<0.05 Vs age-matched db/db mice and # p<0.05 Vs age-matched lean control mice were considered statistically significant.
Mice strain Lean control Lean + rosiglitazone db/db db/db + rosiglitazone
Age (weeks) 16 18 16 16 Duration (weeks) 10 13 10 10 Group size (n) 7 7 7 8 Plasma Insulin (ng/ml) 1.73±0.2 1.2±0.3 5.9±1.7# 4.3±0.4 Plasma adiponectin (µg/ml) 2.0±0.06 5.5±0.40# 1.4±0.1# 9.1±1.5* Plasma leptin (ng/ml) 4.0±0.4 7.1±0.9 14.6±1.4# 38.1±3.7* Plasma glucagon (ng/ml) 0.07±0.01 0.06±0.01 0.4±0.05# 0.2±0.03* Plasma triglyceride (mg/dl) 94.5±5.07 74.9±6.2 274.0±24.7# 65.9±6.7* Plasma cholesterol (mg/dl) 110.3±3.95 76.1±2.25 136.9±6.3# 158.6±8.9
29
Table 4: Effect of spironolactone on plasma hormone and lipid parameters in lean control and db/db diabetic mice.
Mice strain Lean control Lean + spironolactone db/db db/db + spironolactone
Age (weeks) 16 16 16 16 Duration (weeks) 10 10 10 10 Group size (n) 7 7 7 7 Plasma Insulin (ng/ml) 1.7±0.2 1.7±0.06 5.9±1.7# 2.1±0.6* Plasma adiponectin (µg/ml) 2.0±0.1 1.7±0.1 1.4±0.1# 1.2±0.1 Plasma leptin (ng/ml) 4.0±0.4 4.9±0.4 14.6±1.4# 14.7±1.4 Plasma glucagon (ng/ml) 0.07±0.01 0.08±0.01 0.4±0.05# 0.5±0.07 Plasma triglyceride (mg/dl) 94.5±5.1 126.9±7.7 274.0±24.7# 179.2±21.1* Plasma cholesterol (mg/dl) 110.3±4.0 114.6±2.7 136.9±6.3# 154±9.9
Values represent mean±SEM. *p<0.05 Vs age-matched db/db mice and # p<0.05 Vs age-matched lean control mice were considered statistically significant.
30
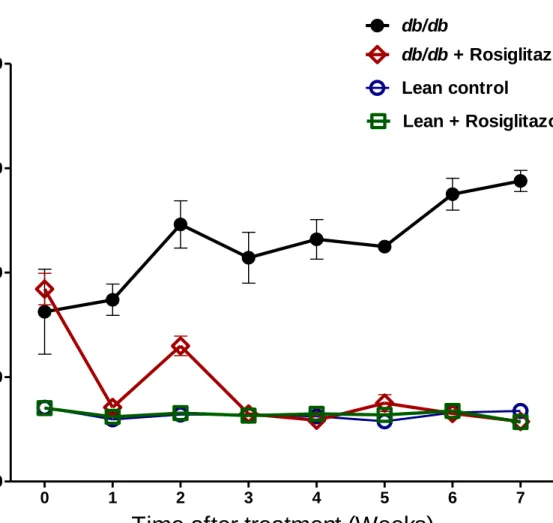
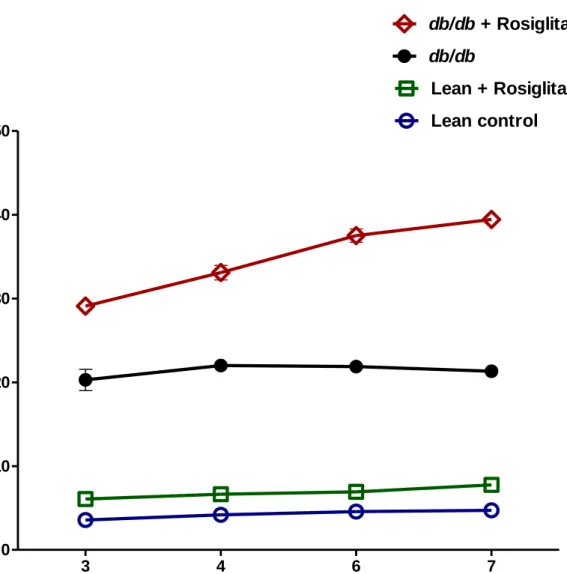
Figure 1: Blood glucose levels in lean control mice (n=7), lean + rosiglitazone mice (n=7),
db/db mice (n=6), db/db + rosiglitazone mice (n=8) at 0-7 weeks during rosiglitazone treatment. Repeated measures two-way ANOVA using a Bonferroni’s posthoc test showed that treatment
caused a significant decrease in blood glucose levels of db/db + rosiglitazone mice [F (3, 54) = 176.04], p<0.0001. Similarly duration of treatment showed a significant decrease in blood glucose levels of db/db + rosiglitazone mice [F (21, 54) = 16.34], P<0.0001. Data are represented as mean±SEM of group size (n=6-8).
0 1 2 3 4 5 6 7 0 200 400 600 800 Lean control db/db db/db+ Rosiglitazone Lean + Rosiglitazone
Time after treatment (Weeks)
B
lo
o
d
g
lu
c
o
s
e
(
m
g
/d
L
)
31
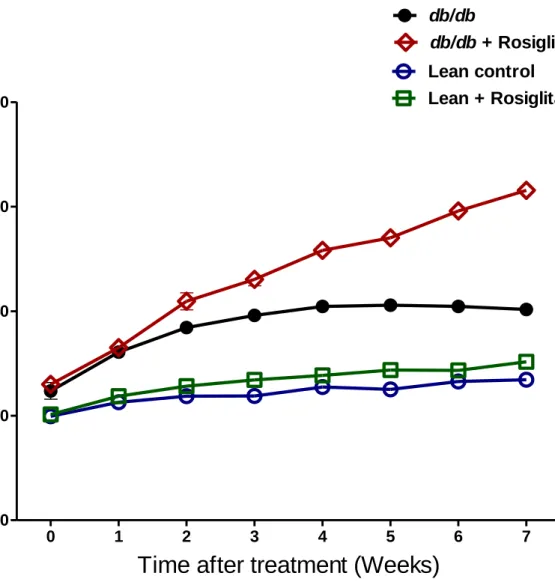
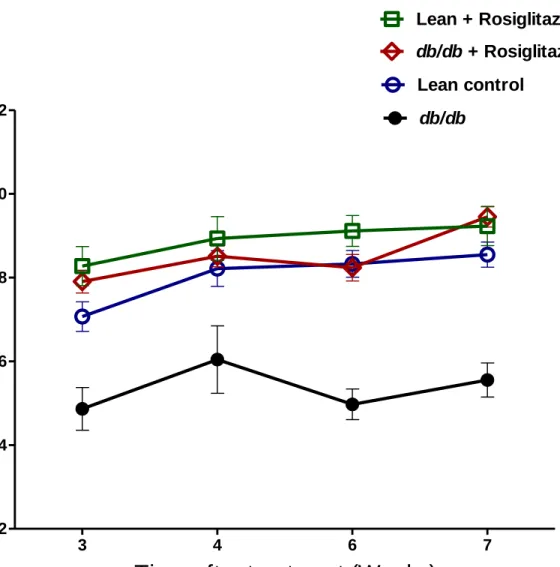
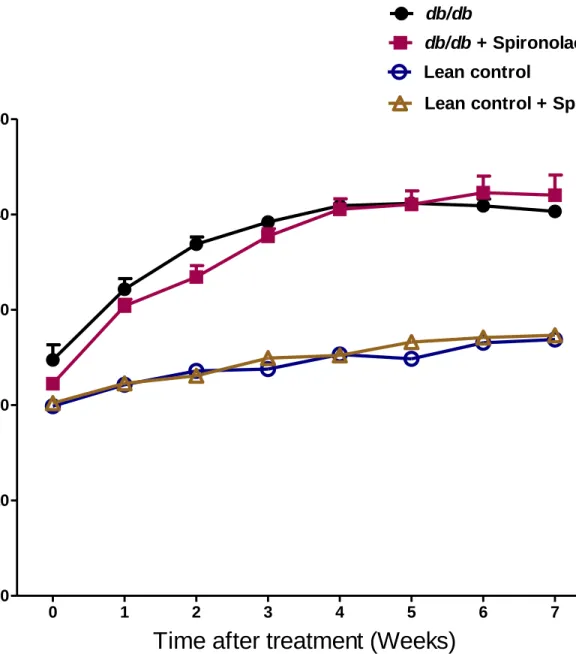
Figure 2: Body weights measurement in lean control mice (n=7), lean + rosiglitazone mice
(n=7), db/db mice (n=6), db/db + rosiglitazone mice (n=8) at 0-7 weeks during rosiglitazone treatment. Repeated measures two-way ANOVA using Bonferroni’s posthoc test showed that
treatment resulted in a significant increase in body w eights of db/db + rosiglitazone mice [F (3, 54) = 306.03], p<0.0001. Similarly duration of treatment showed a significant increase in body weights of db/db + rosiglitazone mice [F (21, 54) = 67.55], p<0.0001. Data are represented as mean±SEM of group size (n=6-8).
0 1 2 3 4 5 6 7 0 20 40 60 80 Lean control db/db db/db + Rosiglitazone Lean + Rosiglitazone
Time after treatment (Weeks)
B
o
d
y
w
e
ig
h
t
(g
m
s
)
32
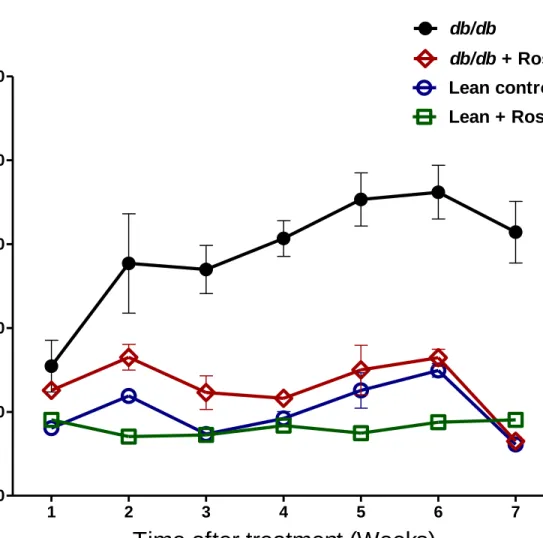
Figure 3: Food intake measurement in lean control mice (n=7), lean + rosiglitazone mice (n=7),
db/db mice (n=6), db/db + rosiglitazone mice (n=8) at 1-7 weeks during rosiglitazone treatment. Repeated measures two-way ANOVA using a Bonferroni’s posthoc test showed that treatment
had no effect on food intake of db/db + rosiglitazone mice. Similarly duration of treatment showed no effect on food intake of db/db + rosiglitazone mice. Data are represented as mean±SEM of group size (n=6-8).
1 2 3 4 5 6 7 0 5 10 15 Lean control db/db db/db + Rosiglitazone Lean + Rosiglitazone
Time after treatment (Weeks)
F
o
o
d
i
n
ta
ke
(
g
m
/d
a
y
/m
o
u
s
e
)
33
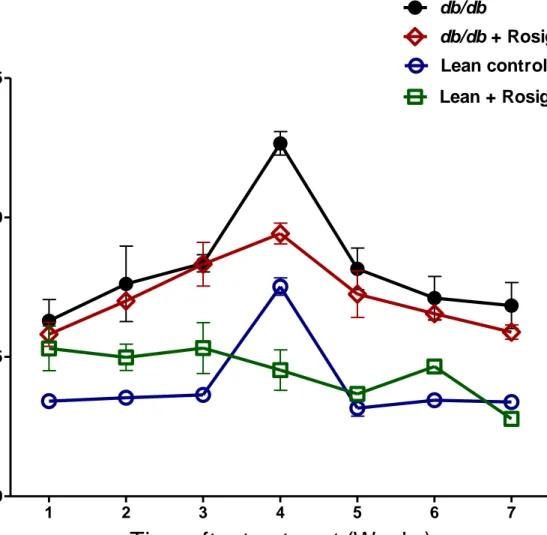
Figure 4: Water intake measurement in lean control mice (n=7), lean + rosiglitazone mice (n=7),
db/db mice (n=6), db/db + rosiglitazone mice (n=8) at 1-7 weeks during rosiglitazone treatment. Repeated measures two-way ANOVA using a Bonferroni’s posthoc test showed that treatment
significantly decreased water intake of db/db + rosiglitazone mice [F (3, 144) = 93.733],
p<0.0001. Similarly duration of treatment showed significant decrease in water intake of db/db + rosiglitazone mice [F (18, 144) = 5.492], p<0.0001. Data are represented as mean±SEM of group size (n=6-8). 1 2 3 4 5 6 7 0 10 20 30 40 50 Lean control db/db db/db + Rosiglitazone Lean + Rosiglitazone
Time after treatment (Weeks)
W
a
te
r
in
ta
ke
(
g
m
/d
a
y
/m
o
u
s
e
)
34
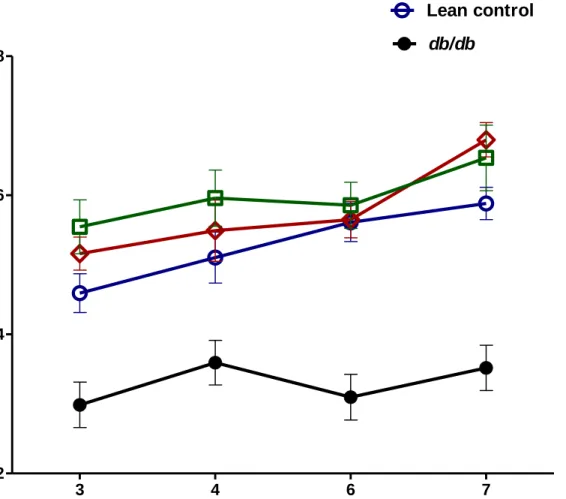
Figure 5: Absolute body fat measurement in lean control mice (n=7), lean + rosiglitazone mice
(n=7), db/db mice (n=7), db/db + rosiglitazone mice (n=8) at 3-7 weeks during rosiglitazone treatment. Repeated measures two-way ANOVA using a Bonferroni’s posthoc test showed that
treatment showed significant increase in absolute body fat of lean + rosiglitazone and db/db + rosiglitazone mice [F (3, 63) = 985.20], p<0.0001. However duration of treatment showed no effect on absolute body fat of lean + rosiglitazone but increased absolute body fat of db/db + rosiglitazone mice [F (9,63) = 15.75], p<0.0001. Data are represented as mean±SEM of group size (n=7-8). 3 4 6 7 0 10 20 30 40 50 Lean control db/db db/db + Rosiglitazone Lean + Rosiglitazone
Time after treatment (Weeks)
A
b
s
o
lu
te
b
o
d
y
f
a
t
(g
m
s
/m
o
u
s
e
)
35
Figure 6: Absolute lean mass measurement in lean control mice (n=7), lean + rosiglitazone mice
(n=7), db/db mice (n=6), db/db + rosiglitazone mice (n=8) at 3-7 weeks during rosiglitazone treatment. Repeated measures two-way ANOVA using a Bonferroni’s posthoc test showed that
treatment resulted in a significant increase in absolute lean mass of db/db + rosiglitazone mice [F (3,63) = 39.90], p<0.0001. However, duration of treatment showed no effect on absolute lean mass of db/db + rosiglitazone mice. Data are represented as mean±SEM of group size (n=6-8).
3 4 6 7 12 14 16 18 20 22 Lean control db/db db/db + Rosiglitazone Lean + Rosiglitazone
Time after treatment (Weeks)
A
b
s
o
lu
te
le
a
n
m
a
s
s
(
g
m
s
/m
o
u
s
e
)
36
Figure 7: Total body water measurement in lean control mice (n=7), lean + rosiglitazone mice
(n=7), db/db mice (n=6), db/db + rosiglitazone mice (n=8) at 3-7 weeks during rosiglitazone treatment. Repeated measures two-way ANOVA using a Bonferroni’s posthoc test showed that
treatment caused significant increase in total body water of db/db + rosiglitazone mice [F (3,60) = 24.47], p<0.0001. However, duration of treatment showed no effect on total body water of
db/db + rosiglitazone mice. Data are represented as mean±SEM of group size (n=6-8).
3 4 6 7 12 14 16 18 Lean control db/db db/db + Rosiglitazone Lean + Rosiglitazone
Time after treatment (Weeks)
T
o
ta
l b
o
d
y
w
a
te
r
(g
m
s
/m
o
u
s
e
)
37
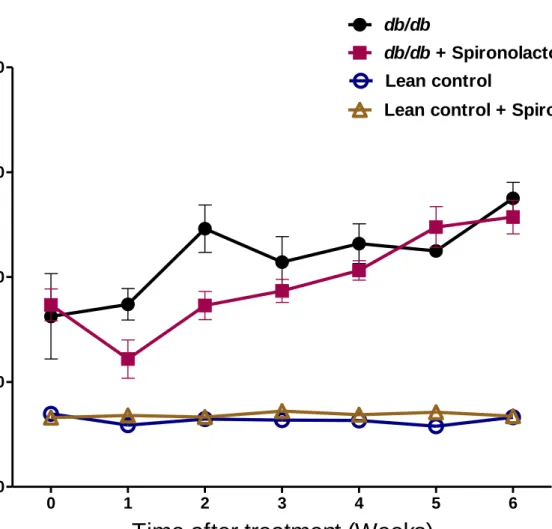
Figure 8: Blood glucose levels in lean control mice (n=7), lean + spironolactone mice (n=7),
db/db mice (n=6), db/db + spironolactone mice (n=8) at 0-7 weeks during spironolactone treatment. Repeated measures two-way ANOVA using a Bonferroni’s posthoc test showed that
treatment had no effect on blood glucose of db/db + spironolactone mice. Similarly duration of treatment showed no effect on blood glucose of db/db + spironolactone mice. Data are
represented as mean±SEM of group size (n=6-8).
0 1 2 3 4 5 6 0 200 400 600 800 Lean control
Lean control + Spironolactone db/db
db/db + Spironolactone
Time after treatment (Weeks)
B
lo
o
d
g
lu
c
o
s
e
(
m
g
/d
L
)
38
Figure 9: Body weight measurement in lean control mice (n=7), lean + spironolactone mice
(n=7), db/db mice (n=6), db/db + spironolactone mice (n=8) at 0-7 weeks during spironolactone treatment. Repeated measures two-way ANOVA using a Bonferroni’s posthoc test showed that
treatment had no effect on body weights of db/db + spironolactone mice. Similarly duration of treatment showed no effect on body weights of db/db + spironolactone mice. Data are
represented as mean±SEM of group size (n=6-8).
0 1 2 3 4 5 6 7 0 10 20 30 40 50 Lean control
Lean control + Spironolactone db/db
db/db + Spironolactone
Time after treatment (Weeks)
B
o
d
y
w
e
ig
h
t
(g
m
s
)
39 .
Figure 10: Food intake measurement in lean control mice (n=7), lean + spironolactone mice
(n=7), db/db mice (n=6), db/db + spironolactone mice (n=8) at 1-7 weeks during spironolactone treatment. Repeated measures two-way ANOVA using a Bonferroni’s posthoc test showed that
treatment had significant increase in food intake of lean + spironolactone and db/db +
spironolactone mice [F (3,100) = 72.663], p<0.0001. However duration of treatment showed no effect on food intake of lean + spironolactone and db/db + spironolactone mice. Data are represented as mean±SEM of group size (n=6-8).
1 2 3 4 5 6
0 5 10
15 Lean control
Lean control + Spironolactone db/db
db/db + Spironolactone
Time after treatment (Weeks)
F
o
o
d
i
n
ta
ke
(
g
m
/d
a
y
/m
o
u
s
e
)
40
Figure 11: Water intake measurement in lean control mice (n=7), lean + spironolactone mice
(n=7), db/db mice (n=6), db/db + spironolactone mice (n=8) at 1-7 weeks during spironolactone treatment. Repeated measures two-way ANOVA using a Bonferroni’s posthoc test showed no
effect on water intake of lean + spironolactone and db/db + spironolactone mice. Similarly duration of treatment showed no effect on food intake of lean + spironolactone and db/db + spironolactone mice. Data are represented as mean±SEM of group size (n=6-8).
1 2 3 4 5 6 0 10 20 30 40 50 Lean control
Lean control + Spironolactone db/db
db/db + Spironolactone
Time after treatment (Weeks)
W
a
te
r
in
ta
ke
(
g
m
/d
a
y
/m
o
u
s
e
)
41
Figure 12: Absolute body fat measurement in lean control mice (n=7), db/db mice (n=6), db/db
+ spironolactone mice (n=8) at 4-7 weeks during spironolactone treatment. Repeated measures
two-way ANOVA using a Bonferroni’s posthoc test showed no effect on absolute body fat of
db/db + spironolactone mice. Similarly duration of treatment showed no effect on absolute body fat of db/db + spironolactone mice. Data are represented as mean±SEM of group size (n=6-8).
4 6 7 0 10 20 30 Lean control db/db db/db + Spironolactone
Time after treatment (Weeks)
A
b
s
o
lu
te
b
o
d
y
f
a
t
(g
m
s
/m
o
u
s
e
)
42
Figure 13: Absolute lean mass measurement in lean control mice (n=7), db/db mice (n=6), db/db
+ spironolactone mice (n=8) at 4-7 weeks during spironolactone treatment. Repeated measures
two-way ANOVA using a Bonferroni’s posthoc test showed no effect on absolute lean mass of
db/db + spironolactone mice. Similarly duration of treatment showed no effect on absolute lean mass of db/db + spironolactone mice. Data are represented as mean±SEM of group size (n=6-8).
4 6 7 14 16 18 20 Lean control db/db db/db + Spironolactone
Time after treatment (Weeks)
A
b
s
o
lu
te
le
a
n
m
a
s
s
(
g
m
s
/m
o
u
s
e
)
43
Figure 14: Total body water measurement in lean control mice (n=6), db/db mice (n=6), db/db +
spironolactone mice (n=8) at 4-7 weeks during spironolactone treatment. Repeated measures
two-way ANOVA using a Bonferroni’s posthoc test showed no effect on total body water of
db/db