WORKING PAPER SERIES
Regional Competition in US Banking –
Trends and Determinants
Alexander Erler/Horst Gischer/Bernhard Herz
Impressum (§ 5 TMG
)
Herausgeber:Otto-von-Guericke-Universität Magdeburg Fakultät für Wirtschaftswissenschaft DFS Dekan
Verantwortlich für diese Ausgabe:
Otto-von-Guericke-Universität Magdeburg Fakultät für Wirtschaftswissenschaft Postfach 4120 39016 Magdeburg Germany http://www.Gww.PWHVEF/femm
Bezug über den Herausgeber ISSN 1615-4274
Regional Competition in US Banking – Trends and Determinants
Alexander Erler
Horst Gischer
Bernhard Herz*
University of Bayreuth University of MagdeburgUniversity of Bayreuth
Abstract
Competition in the US banking industry as measured by the Lerner Index has on average increased substantially during the last decade. At the same time, regional differences in competition on the state level have decreased considerably. Based on a dynamic panel framework we find that these developments are mainly driven by industry specific factors such as the costs to income ratio. The empirical evidence indicates that inefficiency and the Lerner index are significant negatively correlated. Macroeconomic conditions appear to have supported these trends in competition, however, to a somewhat lesser extent.
Keywords: competition, US banking, efficiency, regional markets
JEL-classification: D40, G21, L19
*corresponding author: University of Bayreuth, Department of Business, Economics and Law, 95440 Bayreuth, Germany: [email protected]
1 Introduction
The intensity of competition in the banking industry of large economies such as the US and the European Union (EU) does not only change over time, it might also be characterized by considerable differences on the regional level. As measured e.g. by the Lerner index as a standard gauge of competition intensity the degree of competition in the US banking industry has increased considerably during the last decade. Simultaneously, regional differences seem to have become smaller during that time period (see figure 1). More specifically, the Lerner index for the US banking industry on average declined from 0.54 to 0.43 between 2004 and 2013, indicating more intense competition. At the same time the standard deviation of the Lerner index on the state level declined from 0.065 to 0.015, implying more homogeneity in regional banking competition in the US.
Figure 1: Regional Lerner Indices in the US Banking Industry (2004-2013)1
It remains an open question whether the overall increase in and the regional levelling of competition have been driven by the same underlying factors. As a possible factor innovations and improvements in information technology could have increased competitive pressure in all regional banking markets. Specifically, online banking has increased competition in retail markets nationwide with low competition markets possibly being affected to a larger extent, thereby inducing a convergence process and more homogeneity in regional US banking markets.
A careful investigation of regional competition in US banking might be helpful for a number of reasons. Due to the close interaction between banks and their regional environments an adequate banking and competition policy has to take into account the specific regional economic developments, e.g. on the level of the federal states. The local banking industry is of vital importance for lending to private and corporate customers as well as for providing other financial services and, therefore ultimately regional economic development. From an international perspective, the currently emerging European Banking Union could possibly learn a number of lessons from US regulation with its long tradition of a strong central regulator, the Federal Deposit Insurance Corporation (FDIC), and at the same time wide heterogeneity with respect to economic conditions and banking regulation on the state level. Finally, analyzing economic developments in the banking industry on a more disaggregated, regional level broadens the data base thereby possibly improving the quality of the empirical analysis.
So far there exists only little work with a regional perspective on competition in banking markets. The literature has basically concentrated on analyzing either the level of competition in a particular national banking industry or differences between international banking systems based on cross-country comparisons. In this vast literature Fernando de Guevara/Maudos (2007) and Fernando de Guevara et al. (2007) among others investigate determinants of
market power on a national level using fixed effects panel models as well as frontier cost functions, an approach also applied by Koetter/Vins (2008), Carbó et al. (2009) and
Coccorese (2014). Ayadi et al. (2009) control for both level effects and dynamics, combining fixed effects panel results with GMM-estimators for dynamic panel data. Liu et al. (2010), Beck et al. (2011), and Weill (2013) focus on heterogeneity of competition in the EU. Koetter et al. (2012) and Pruteanu-Podpiera (2016) test for the quiet life hypothesis focusing on efficiency arguments. Risk and stability problems are addressed by Zigraiova/Havranek (2015) and Bushmann et al. (2016) while Gischer et al. (2015) reveal a significant underestimation of market power in previous studies due to an inappropriate method of calculating the Lerner index.
Common to these studies is their focus on the level (and the causes) of nationwide competition in the banking industry for a given time rather than explicitly looking into developments over time. Accordingly, the cross country studies focus on identifying
significant differences in the levels of competition for a given period under observation. This literature (more or less) ignores fundamental differences in the organization of national banking systems. Looking at highly aggregate figures only, regional or local characteristics cannot be controlled for.
Consequently, relatively little is still known about the determinants of competition on the regional level. Only few studies are dealing with intra-national structural problems or regional competition. Based on the Panzar-Rosse approach Gischer/Stiele (2009) investigate role and performance of Sparkassen in Germany and reveal an empirically weak relationship between bank size and competitive conditions. For the US, the spectrum of current studies is also rather limited, see Stiroh/Strahan (2003), Bos et al. (2009), Yildirim/Mohanty (2010), and Bolt/Humphrey (2012) for an overview.
Obviously, these studies and other empirical work provide numerous interesting insights for understanding competition in the banking industry. However, by not controlling for specific regional characteristics these studies neglect a potentially important source of information. Hence, we put particular effort on incorporating regional characteristics in our analysis. As our simple descriptive measures indicate (see section 2), competition on the regional level can differ substantially, while we also observe a considerable process of convergence in
competition intensity over time.
Our analysis aims to identify the economic factors that have over the last decade increased competition in the US banking industry on the aggregate level while mitigating regional differences in competition. We differentiate between variables on the microeconomic bank related level and macroeconomic factors which determine the economic environment in the banking industry. Special attention is given to specific structural changes possibly initiated by the financial crisis.
Our empirical analysis indicates that the convergence of regional competition started well before the financial crisis and continued afterwards, but at a somewhat slower pace. Furthermore, the observed adjustments in the regional markets appear to have been almost solely driven by bank specific factors. In contrast, macroeconomic measures seem to have been of lesser importance only.
Our paper is organized as follows. The next section presents a brief descriptive overview of structural changes in US regional banking since the early 2000s and discusses the suitability of the Lerner index as a measure of competition intensity. Section 3 presents some stylized facts and explores methodological issues. Section 4 discusses the empirical results of our panel analyses, section 5 concludes.
2 Regional Competition and Lerner index
We follow the intermediation hypothesis for the banking firm2, using the Lerner index as a
proxy for the intensity of competition. The Lerner index (LI) can be derived from an usual profit maximization condition using the Amoroso-Robinson relation and is given by
ܮܫ ൌ ܲ െ ܯܥܲ
with P denoting market price and MC marginal costs of production. The Lerner index can be used as an indicator of market power on the firm as well as the industry level. Perfect
competition implies “price equals marginal costs” in equilibrium, implying a numerator in (1) and thus a Lerner index of zero. The larger the market power of a firm, the more it is able to increase market price above marginal production costs resulting in higher profits and a higher Lerner index. In the limit the index converges to one.
Obviously, the Lerner index is a non-linear function of P and non-metrically scaled. Hence, only the limits can be interpreted in a straightforward manner: A LI value of zero indicates perfect competition, a value of one points to a monopoly. As a consequence, the values of the index can only be compared in a cross section or over time if the fundamental economic conditions of the underlying markets are fairly similar. Further questions arise when the Lerner index approach is applied to banking markets, among others: What is the relevant product? How can prices and marginal costs be measured adequately?
Firstly, according to the intermediation approach, we assume that the relevant marketable products of a bank are loans. Interest income can then be regarded as banks’ revenues from the production of loans and, accordingly, the average interest rate for loans might be
2 See Sealey/Lindley (1977) for a detailed treatment and Molyneux et.al. (1994), Bikker/Groeneveld (2000), or Bikker/Haaf (2002) for discussion and application. As the intermediation approach takes loan making as the main service of a bank and deposits as factors of production, it is most appropriate for the Lerner approach with its single market view.
considered as the market price P, as is the standard practice in most empirical studies.3
Secondly, marginal costs of loan production are extremely difficult to determine. A
commonly used approach is based on translogarithmic cost functions with the drawback that a number of very restrictive assumptions have to be made, e.g. identical business models, exogenous constant prices on factor markets, and perfect competition. Since we are particularly interested in illustrating the competitive framework of banks, using the cost function approach would lead to a severe methodological problem as the degree of
competition is measured based on the assumption of perfect competition. Instead we follow Braemer et al. (2013) and use interest expenses as costs proxy, avoiding these problems since interest expenses can directly be measured without any specific assumptions on the
underlying market model. Accordingly, the numerator of equation (1) equals banks’ net interest income. Calculated in relation to total assets, it is identical to banks’ net interest margin.
ܮܫ ൌ ሺ݅݊ݐ݁ݎ݁ݏݐ݅݊ܿ݉݁ ݐݐ݈ܽܽݏݏ݁ݏݐݏሻ െ ሺ݅݊ݐ݁ݎ݁ݏݐ݁ݔ݁݊ݏ݁ݏ ݐݐ݈ܽܽݏݏ݁ݏݐݏሻΤ ݅݊ݐ݁ݎ݁ݏݐ݅݊ܿ݉݁ ݐݐ݈ܽܽݏݏ݁ݏݐݏΤ Τ ൌ݅݊ݐ݁ݎ݁ݏݐ݅݊ܿ݉݁ െ ݅݊ݐ݁ݎ݁ݏݐ݁ݔ݁݊ݏ݁ݏ݅݊ݐ݁ݎ݁ݏݐ݅݊ܿ݉݁
From equation (2) it is evident, that the Lerner index is sensitive to changes in the level of interest rates. It seems reasonable to assume that bank interest rates are (highly) correlated with markets rates, e.g. the average loan rate (interest income/total assets) moves in accordance with the general interest rate level. Hence, a given banks’ net interest margin implies different Lerner index values depending on the level of market rates. The lower the interest rate the larger the index is for a given net interest margin. Since this effect is statistical of nature and independent of banks’ market power we also use a modified version
3 Gischer et al. (2015) show that the market price P is systematically underestimated when using balance sheet total as denominator for interest income to calculate the average interest rate. The correct denominator should be “interest bearing assets” instead, however, most of the accessible data sources do not provide appropriate information.
of the Lerner index that adjusts the conventional Lerner index for changes in the general level of interest rates to check for the robustness of our empirical results.4
3 Data and methodology
3.1. Some stylized facts
Based on disaggregated FDIC data for commercial banks5 we find that in year 2004, the
starting point of our analysis, the degree of competition as measured by the Lerner Indices seems to be quite heterogeneous on the state level (see Figure 2 with darker colors indicating more intense competition). Competition appears to be more intense in the north-eastern states and less intensive in the south-western states with a wide range of index values spreading from the District of Columbia (0.72) to New Hampshire (0.54). The unweighted arithmetic mean of these state-level Lerner Indices is 0.56, standard deviation 0.065. The situation is quite different in 2013 (see figure 3). Competition in the banking industry seems to have increased and is much more homogenous with a mean of the Lerner index of 0.42 and a standard deviation of 0.015 only. The extreme values range from Utah (0.37) to Maine (0.45).
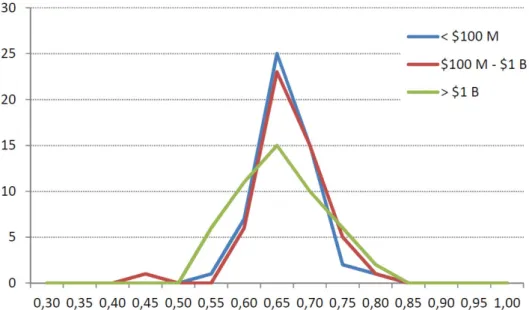
Interestingly, bank size does not seem to be relevant for the intensity of competition on the regional level. As an illustration figure 4 depicts the distribution of regional Lerner Indices for the 50 US states with respect to bank size in year 2004. While the regional Lerner Indices of large institutions with a balance sheet total of more than $1 billion are spread somewhat wider compared to small and medium sized banks, the mean of the Lerner index distribution of the three banking groups is almost identical. This feature holds in a similar way in the subsequent years.
4 See Appendix 1 for formal derivation. 5 https://www.fdic.gov/bank/statistical/
Figure 2: Lerner Index for US States in 2004
Figure 4: Regional Distribution of Lerner Index for Different Bank Sizes (2004, US states)
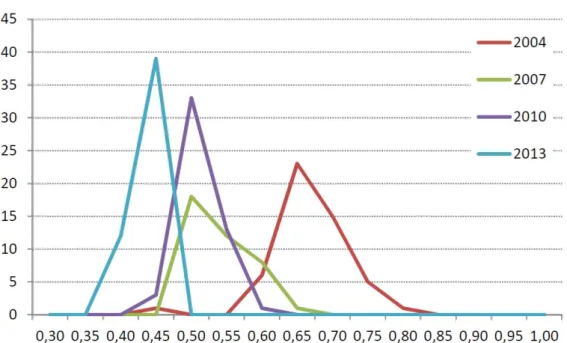
While the Lerner Indices of the different banking groups are very similar for a given point in time the level and regional heterogeneity of competition has changed considerably over time (see also figure 1) Since 2004 the variance of the state-level Lerner index of e.g. medium sized banks has decreased considerably and at the same time the left-hand shift of the
distributions indicates the increased competition (figure 5). These findings also hold for small and large banks.
Taken together the stylized facts indicate that competition on US banking markets has increased over the last decade, while during the same time a process of regional convergence has made regional banking markets more homogeneous with respect to competition.
Figure 5: Lerner Index Distribution for Medium Sized Banks
3.2 Model specification
The empirical analysis of competition in US regional banking markets is based on a dynamic panel approach that evaluates the dynamic evolution of competition by explicitly taking into account the persistence of the Lerner index.6 Standard economic theory implies that prices
converge to marginal costs as competition in a market increases, i.e. the index converges to zero in the limit. Accordingly, smaller values of the index indicate a higher degree of
competition in the banking system. As the values of the Lerner index are bounded between 0 and 1 the functional form does not appear to be linear. The use of a logistic transformation of the Lerner index is a natural way of taking into account such a constraint.7 The standard
logistic transformation is symmetric, and has a maximal slope at a Lerner index equal 0.50.
6 Our sample of 50 states and the federal district covers the years from 2004 to 2013. Data are taken from the Federal Deposit Insurance Company (FDIC) “Historical Statistics on Banking” Database and from the Federal Reserve Bank of St. Louis “FRED” Database.
Our benchmark equation is given by:
݈݁ݎ݊݁ݎ݅ݐ ൌ ߙ݆݈݁ݎ݊݁ݎ݅ݐെ݆
݆ ൌͳ
ߚͳݔ݅ݐ ߚʹݓ݅ݐ ݒ݅ ߤݐ ߳݅ݐ
where lernerit denotes the Lerner index in state i in year t, xit is a vector of exogenous
variables, wit is a vector of predetermined or endogenous variables, and it is an i.i.d. error
term. Additionally, we control for time-constant but cross-sectional varying effects (vi) as well
as time-varying but cross-sectional constant effects ( ). The cross-section effects can be removed by taking first differences. However, the use of appropriate instruments is necessary to address endogeneity caused by differencing.8 We follow Arellano/Bond (1991) as well as
Arellano/Bover (1995) and Blundell/Bond (1998) and estimate our model using difference GMM and system GMM. The applied estimation techniques use moment conditions either for the model in differences (difference GMM), or for the model both in differences and in levels (system GMM). The instruments for the regression in differences are the lagged values of the explanatory variables and the instruments for the regression in levels are the lagged
differences of the respective variables. In order to avoid instrument proliferation (see
Roodman 2009), we set the maximum lag to 1 period in case of difference GMM. For system GMM we collapse the instrument matrix and set the maximum lag to 3 periods. Furthermore, the Windmeijer (2005) finite sample correction for standard errors is applied.
We follow the literature and introduce most commonly used indicators to account for financial market features such as banking density, loan demand, banking concentration, size of banking system, risk, specialization, and efficiency. To control for macroeconomic environment, we add real growth and inflation to the list of exogenous variables.
8 As our model also allows for time specific effects, we eliminate these effects by subtracting the means of each variable for each period. As the employed empirical framework assumes cross-sectional independence, the removing of these time effects is a simple way to mitigate potential dependencies due to common factors (see Levin et al. 2002, p. 13).
We expect a positive effect of real growth on market power and thus the Lerner index. Higher gdp growth induces increasing income which should enhance potential borrowers’ willingness to pay and to demand loans. Hence, banks’ ability to raise loan interest rates should improve. Inflation, as measured by the GDP deflator, is likely to simultaneously lessen loan demand and intensify banks’ costs pressure, implying decreasing relative market power.
Total assets per capita might be considered a proxy for the availability of bank services. We expect a positive impact of banking density on competition, i.e. a negative effect on the Lerner index. To control for demand effects on competition the ratio of total assets to GDP incorporates the relative importance of the banking industry on state level and should proxy the elasticity of aggregate loan demand. The higher the ratio the more difficult it is for a bank to “sell” additional loans. While higher interest rate concessions might induce additional loan demand they also lower interest margins and thus the Lerner index. Hence, the expected sign of the coefficient should be negative. As an alternative theoretical point of view, it might be argued that a lower ratio of total assets to GDP indicates a greater importance of non-banking financing and more competition in the financial sector. Thus, a negative positive relationship between total assets to GDP and the Lerner index might be expected (see, e.g., Fungáová et al., 2010).
Banking concentration in terms of assets of the three largest banks relative to total assets indicates the (non) availability of alternative suppliers within the banking system. A higher concentration is expected to increase market power, therefore the impact on the Lerner index is expected to be positive.
Credit risk is proxied by the ratio of non-performing loans to total loans. A high ratio of non-performing loans can only be maintained if realized profits are substantial, a situation that is most likely in the presence of persistent market power.9 We thus expect a positive coefficient.
Risk aversion of the banking system should be captured by the ratio of total equity capital to total assets. Banks that are better endowed with more capital relative to their assets can take greater risks. A high equity ratio can provide a solid buffer against unexpected loan losses but has to be remunerated by appropriate dividend payments. As long as loan interest rates are sensitive to risk, the ratio of total equity capital to total assets should have a positive effect on both the interest rate margin of banks as well as their market power.
The size of the banking system is included to capture possible cost advantages (economies of scale) and is measured by the log of total assets. We expect positive scale effects to increase competition, hence, the sign of the coefficient should be negative.
To proxy default risk we include bank reserves, i.e. loan loss reserves to total loans. Since reserves reduce net profits only profitable institutions are capable of holding sufficient loan loss reserves. As in the case of risk aversion a positive impact of this variable on the Lerner index is expected.
The potential impact of specialization on market power is captured by taking fee income into account. This indicator is used as in recent years non-interest income has become relatively more important due to an unprecedented low interest rate environment. It is not uncommon for banks to try to compensate decreasing interest margins in the loan market at least partly by intensifying fee income inducing services. Since we define the Lerner index for the loan market only, higher fee income might reflect lower market power in the loan making business implying a negative coefficient.
9 We do not discuss the question whether a higher ratio of nonperforming loans to total loans is part of the business strategy of banks since higher returns can only be realized by accepting higher risk. Our focus is rather a bank’s ability to compensate loan losses than its willingness to do so.
Likewise, inefficiency – defined as the costs to income ratio – might be an important factor in determining market power. For instance, lower operating costs imply increased operating efficiency that in turn enables banks to acquire market shares as well as income. The associated improvement in market power again implies a negative coefficient.
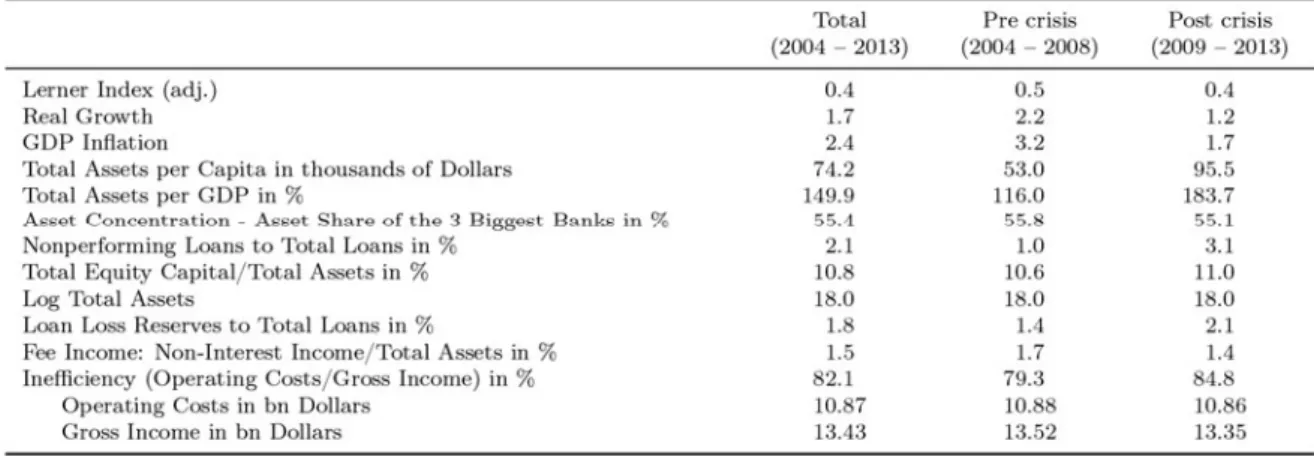
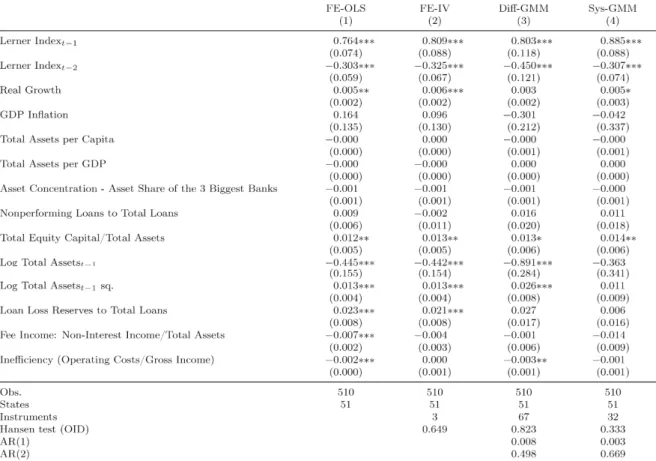
4 Empirical results
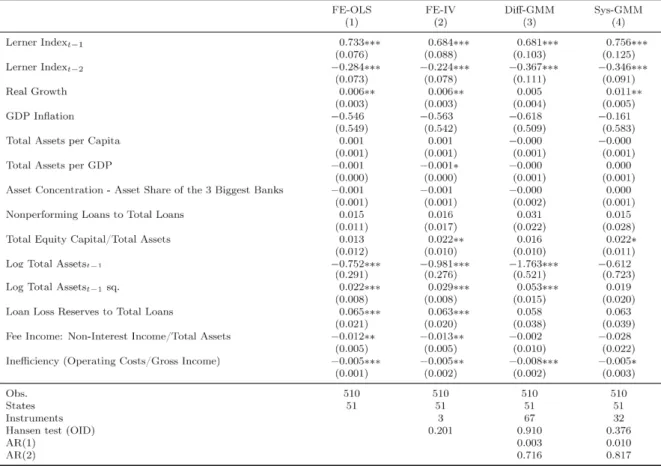
Table 1 depicts mean values of the variables of interest, with table 2 and 3 presenting the empirical results for our estimation period 2004-2013. As dependent variable we use the unadjusted Lerner index (table 2) as well as the adjusted Lerner index (table 3) to account for interest rate level effects due to the unparalleled period of very low interest rates following the financial crisis. In a first step, we provide results from basic econometric procedures, i.e. the regression models of column 1 and 2 use a fixed effects estimator (FE) in both tables. However, this specification might be subject to endogeneity issues. In particular, inefficiency and the Lerner index could be simultaneously determined. Therefore, in column 2 we use
an instrumental variable panel estimator with fixed effects and treat inefficiency as
endogenous. In addition, the fixed effects estimator of column 1 and 2 might be biased and inconsistent due to the inclusion of lagged dependent variables. Therefore, in column 3 the Arellano/Bond (1991) difference GMM estimator is applied. Furthermore, the specification treats inefficiency, fee income, size and nonperforming loans as endogenous. As the difference GMM estimator might potentially suffer from small sample bias, we lastly use the
Arellano/Bover (1995) and Blundell/Bond (1998) system GMM estimator in column 4. Though, this estimator seems to be appropriate if one is willing to accept a mild stationarity assumption. Precisely, stationary individual specific means have to be uncorrelated with
deviations from the long-run mean. However, one could argue that a highly competitive banking system adjusts faster to potential shocks than a banking system where banks enjoy higher margins. In such a case the stationarity assumption appears to be too restrictive. In order to consider all the potential estimation issues mentioned above, we focus only on those estimation results which seem to be more or less robust across all the four different
specifications.
In general, the results show that real growth has a positive and significant impact on market power. In times of positive economic growth, which – as one would expected – might be accompanied by an increase in demand for bank loans, banks seem to face higher relative margins. Thus, competition is likely to decrease.
In terms of risk aversion, total equity capital to total assets seems to be associated with a statistically significant positive impact on market power. Banks that in relative terms have a broader equity base available are better able to carry unexpected loan losses. Hence, greater risks can be taken, which in turn enables banks to enjoy higher margins.
Furthermore, the size of the banking system – captured by log total assets – seems to have a significantly negative impact on market power. The results indicate that a larger banking system is associated with a higher degree of competition, i.e. a growing banking system tends
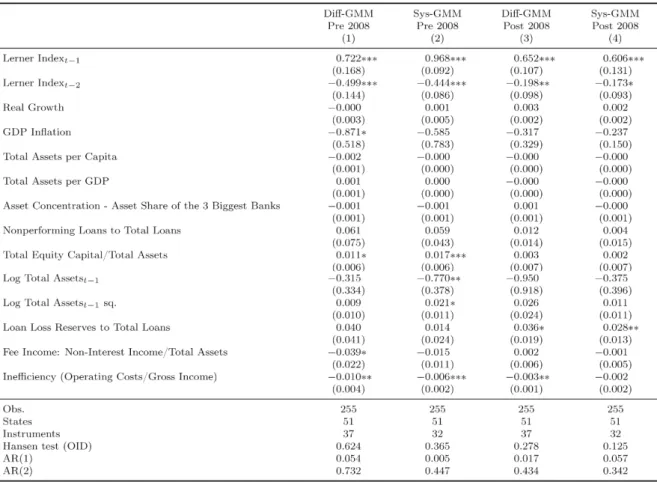
Table 4: Determinants of Competition pre and post Financial Crisis (Lerner index unadjusted)
to intensify competition among banks for a given demand. However, as the estimated
coefficient on size squared shows a positive sign, the relationship between market power and size appears to be nonlinear.10
Concerning potential default risks, the loan loss reserves to total loans indicator seems to be positively related to market power, at least in case of the “simple” fixed effects estimations in columns 1 and 2.
Inefficiency is associated with a negative and significant contribution to the Lerner index, i.e. efficiency and market power are significantly positive correlated. Lower operating costs and thus improved operating efficiency enables banks to acquire market shares as well as income. As the underlying data indicate (see table 1) operating costs have, on average, increased to a larger extent than gross income, our finding is in accordance with the observation that inefficiency leads to higher competiveness in the banking system.
When using the adjusted instead of the unadjusted Lerner index as dependent variable, the results remain qualitatively unchanged (see table 3).
To check for the effect of the financial crisis on the structural changes of competition in the US banking markets we distinguish in our analysis between pre- and post-2008 estimations (see tables 4 and 5). These empirical results indicate that the overall results are fairly robust. In particular, an increase in efficiency is associated with an increase in market power as measured by the Lerner index.
Table 5: Determinants of Competition pre and post Financial Crisis (Lerner index adjusted)
5 Conclusions
Stylized facts indicated that US banking industry has undergone substantial structural changes since the beginning of the 2000s, namely competition has increased considerably while the so far substantial regional differences in competition have levelled off. While the literature on banking competition so far has mainly focused on analysis on the national level we use a more disaggregated view. The main idea of this approach is to mitigate the problem of not sufficiently taking into account differences in the business models of financial institutions and to better account for additional information on regional characteristics. By using state level
data we aggregate banks that are more likely to operate under comparable conditions and are more likely to have similar service portfolios. While the level of regional competition differed considerably in the early 2000s we find that competitive conditions on the state level
converged over our observation period. Additionally, the speed of the structural changes seem to have slowed down after the financial crises.
To identify the driving factors behind these processes, we applied different panel models using commonly employed bank related variables and macroeconomic indicators. To account for potential effects of the financial crisis we distinguished pre and post crisis periods. Our findings indicate that the key variables driving the intensified competition are bank related, e.g. cost to income ratio and the size of the banking sector. A minor impact on the value of the Lerner index can be diagnosed for total assets per GDP as a proxy for loan demand. While the empirical results are quite similar for pre and post periods of the financial crisis, it is worth noting that the absolute values of all significant coefficients are lower in the sub period after the financial crisis than before. Thus, it seems that the financial crisis has not substantially changed the continual structural change in the US banking industry.
Our findings appear to be in line with intuitive, economically reasonable conjectures on an increase in competition on regional markets. The ongoing consolidation and the impact of the financial crisis might have induced lower margins as well as less market power. The
economic downturn in the follow up of the financial crisis reduced aggregated private demand considerably. As private and corporate credit demand declined, competition for a smaller share of more or less riskless borrowers intensified.
A further potentially important factor might be regulatory changes, which we have not explicitly integrated into our empirical analysis so far. Intensified regulation e.g. might have triggered our findings that increased efforts to reduce inefficiency resulted in stronger
competition in regional banking markets. Further research is necessary to evaluate the impact of regulation measures on competitive conditions in a more systematic and consistent way.
References
Arellano, M., and S. Bond. 1991. “Some tests of specification for panel data: Monte carlo evidence and an application to employment equations.” Review of Economic Studies 58 (2): 277–297.
Arellano, M., and O. Bover. 1995. “Another look at the instrumental variable estimation of error component models.” Journal of Econometrics 68 (1): 29–51.
Ayadi, R., R. H. Schmidt, and S. C. Valverde. 2009. “Investigating Diversity in the Banking Sector in Europe – The Performance and Role of Savings Banks.”Brussels:Center for European Policy Studies.
Beck, T., O. de Jonghe, and G. Schepens. 2011. “Bank Competition and Stability: Cross-Country Heterogeneity.”European Banking Center Discussion Paper 2011-019.
Bikker, J. A., and J. M. Groeneveld. 2000. “Competition and Concentration in the EU Banking Industry.” Kredit und Kapital 33: 62-98.
Bikker J. A., and K. Haaf. 2002. “Competition, Concentration and Their Relationship: An Empirical Analysis of the Banking Industry.” Journal of Banking and Finance 26: 2191– 2214.
Blundell, R., and S. Bond. 1998. “Initial conditions and moment restrictions in dynamic panel data models.” Journal of Econometrics 87 (1): 115–143.
Bolt, W., and D. Humphrey. 2012. “A Frontier Measure of U.S. Banking Competition.”De Nederlandsche Bank Working Paper 359.
Bos, J. W. A., I. Chan, J. W. Kolari, and J. Yuan. 2009. “A Fallacy of Division: The Failure of Market Concentration as a Measure of Competition in U.S. Banking.” Utrecht School of Economics, Tjalling C. Koopmans Research Institute, Discussion Paper Series 09-33.
Braemer, P., H. Gischer, T. Richter, and M. Weiss. 2013. “Competition in Banks’ Lending Business and its Interference with ECB Monetary Policy.” Journal of International Financial Markets, Institutions and Money, 25, 144-162.
Bushmann, R.M., B. E. Hendricks, and C. D. Williams. 2016. “Bank Competition:
Measurement, Decision-Making, and Risk-Taking.” Journal of Accounting Research 54 (3): 777-826.
Carbó, S., D. Humphrey, J. Maudos, and P. Molyneux. 2009. “Cross-Country Comparisons of Competition and Pricing Power in European Banking.” Journal of International Money and Finance 28 (1): 115-134.
Claessens, S., and L. Laeven. 2004. “What Drives Bank Competition? Some International Evidence.” Journal of Money, Credit and Banking 36 (3): 563–583.
Coccorese, P. 2014. “Estimating the Lerner index for the banking industry: a stochastic frontier approach.” Applied Financial Economics 24 (2): 73-88.
Federal Deposit Insurance Corporation. Bank Data & Statistics, https://www.fdic.gov/bank/statistical/
Fernández de Guevara, J., J. Maudos, and F. Pérez. 2005. “Market Power in European Banking Sectors.” Journal of Financial Services Research 27 (2): 109–137.
Fernández de Guevara, J., J. Maudos, and F. Pérez. 2007.“Integration and Competition in the European Financial Markets.” Journal of International Money and Finance 26: 26-45.
Fernández de Guevara, J., and J. Maudos. 2007. “Explanatory Factors of Market Power in the Banking System.” The Manchester School 75: 275-296.
Fungáová, Z., L. Solanko, and L. Weill. 2010. “Market power in the Russian banking industry.” LaRGE Working Paper2010-09, University of Strasbourg.
Gischer, H., and P. Reichling. 2010. “The German Banking System and the Financial Crisis.” In: The Financial and Economic Crisis: An International Perspective, edited by B. Gup, 69-78, Cheltenham/Northampton.
Gischer, H., and M. Stiele. 2009. “Competition Tests with a Non-Structural Model: The Panzar-Rosse Method Applied to Germany's Savings Banks.” German Economic Review 10: 50-70.
Gischer, H., H. Müller, and T. Richter. 2015.“How to Measure the Market Power of Banks in the Lending Business Accurately: A Segment-based Adjustment of the Lerner Index.”
Applied Economics 47: 4475-4483.
Koetter, M., and O. Vins. 2008. “The Quiet Life Hypothesis in Banking – Evidence from German Savings Banks.”Finance and Accounting Working Paper Series190.
Koetter, M., J. W. Kolari, and L. Spierdijk.2012. “Enjoying the Quiet Life under
Deregulation? Evidence from Adjusted Lerner Indices for U.S. Banks.” Review of Economics and Statistics 94 (2): 462-480.
Lerner, A. 1934. “The Concept of Monopoly and the Measurement of Monopoly Power.” Review of Economic Studies 1: 157-175.
Levin, A., C.-F. Lin, and C.-S. J. Chu. 2002. “Unit root tests in panel data: asymptotic and finite-sample properties.” Journal of Econometrics 108 (1): 1–24.
Liu, H., and P. Molyneux. 2010.“Measuring Competition and Stability: Recent Evidence for European Banking.”Bangor Business School Working Paper 57.
Molyneux, P.,D. M. Lloyd-Williams and J. Thornton.1994. “Competitive Conditions in European Banking.” Journal of Banking and Finance 18: 445-459.
Pruteanu-Podpiera, A., L. Weill, and F. Schobert.2016. “Banking Competition and Efficiency: A Micro-Data Analysis on the Czech Banking Industry”, in: Global Banking Crisis and Emerging Markets, edited by J. C. Brada, and P. Wachtel, 52-74, Houndmills, Basingstoke: Palgrave Macmillan.
Roodman, D. 2009a. “How to do xtabond2: An introduction to difference and system GMM in Stata.” Stata Journal 9 (1): 86–136.
Roodman, D. 2009b. “A note on the theme of too many instruments.” Oxford Bulletin of Economics and Statistics 71 (1): 135–158.
Sealey, C., and J. Lindley. 1977. “Inputs, Outputs, and the Theory of Production and Cost of Depository Financial Institutions.” Journal of Finance 32: 1251-1266.
Stiroh, K., and P. Strahan. 2003. “Competitive Dynamics of Deregulation: Evidence from U.S. Banking.” Journal of Money, Credit, and Banking 35: 801-828.
Weill, L. 2013. “Bank Competition in the EU: How Has it Evolved?” Journal of International Financial Markets, Institutions & Money 26: 100-112.
Windmeijer, F. 2005. “A finite sample correction for the variance of linear efficient two-step GMM estimators.” Journal of Econometrics 126 (1): 25–51.
Yildirim, H., and S. Mohanty. 2010. “Geographic Deregulation and Competition in the U.S. Banking Industry.” Financial Markets, Institutions, and Instruments 19: 63-94.
Zigraiova, D., and T. Havranek. 2015. “Bank Competition and Financial Stability: Much Ado About Nothing?” William Davidson Institute Working Paper 187: 1-40.
Appendix 1
By construction the Lerner Index as used in our analysis of the banking industry is sensitive to changes in the level of the interest rate, independently of the underlying situation of the banks.
Assume 0 0 0 0 P MC L P − = ͕ 1 1 1 1 P MC L P − = and
(
) (
)
! 0 0 1 1 P −MC = P−MCimplying a constant net interest margin. Let us assume that an increase of the overall interest rate level affects prices and marginal cost identically, hence net interest margins are
unchanged, that is 1 0 P = + ΔP iand MC1=MC0+ Δi yields
(
0) (
0)
0 0 0 0 1 0 0 1 P i MC i P MC P MC L P i P i P + Δ − + Δ − − = = = + Δ + Δ ͘Although net profits remain constant, the indicator decreases due to an exogenous increase of the interest rate level rather than tightened competition. However, the Lerner value keeps
unchanged if L1 is corrected by multiplying 1
0 P
P ͘Hence, the nominal Lerner values are adjusted through extension by the interest rate level of the respective period relative to the base period.
Otto von Guericke University Magdeburg Faculty of Economics and Management
P.O. Box 4120 | 39016 Magdeburg | Germany
Tel.: +49 (0) 3 91 / 67-1 85 84 Fax: +49 (0) 3 91 / 67-1 21 20 www.ww.uni-magdeburg.dewww.fww.ovgu.de/femm