ERIC FOUH, MONIKA AKBAR, AND CLIFFORD A. SHAFFER Department of Computer Science
Virginia Tech Blacksburg, VA 24061
Computer Science core instruction attempts to provide a detailed understanding of dy-namic processes such as the working of an algorithm or the flow of information between computing entities. Such dynamic processes are not well explained by static media such as text and images, and are difficult to convey in lecture. We survey the history of visuali-zation in CS education, focusing on artifacts that have a documented positive educational assessment. We discuss how changes in computing technology have affected the devel-opment and uptake of such visualization artifacts in CS education, and how recent tech-nology changes are leading to progress in developing online hypertextbooks.
KEYWORDS: Algorithm visualization, data structure visualization, program visualiza-tion, eTextbooks, hypertextbooks.
Computer Science instruction has a duel nature. On one hand, CS students constantly build artifacts of the practice. Creating software at small and medium scale is done from early in the first course. This is so ingrained in the culture that students often express that something is wrong with any early CS course that is not programming intensive. Students from most other disciplines would be fortunate to get a fraction of the hands-on experi-ence that is normal for CS instruction. However, this is only half of the story. CS students must also learn a body of knowledge. Most of this core knowledge relates to abstractions. One cannot see or touch an algorithm or data structure, let alone the higher-order con-cepts that relate these algorithms and data structures to the underpinning theories of the discipline. To make the situation worse, much of the content involves the detailed work-ings of dynamic processes. Particularly at the intermediate stage (between when students have properly learned the basic concept of “algorithm” or “recipe” for computation in the first year, and when they begin courses on specific sub-areas of CS that come in the Jun-ior and SenJun-ior years), students spend significant time learning about dynamic processes. Sorting algorithms, search algorithms, the data structures that support them, and the anal-ysis techniques used to assess their quality are the bread-and-butter of sophomore-level computer science. Even the more “concrete” aspects of CS instruction such as program-ming languages and computer architecture require an understanding of the dynamic flows of information that take place within the computer.
Dynamic process is extremely difficult to convey using static presentation media such as text and images in a textbook. During lecture instructors typically draw on the board, trying to illustrate dynamic process through words and constant changes to the di-agrams. Most students have a hard time understanding such explanations at a detailed level. For this reason, there has long been great interest among CS instructors in the use of animation and visualization to convey dynamic concepts. With the ready availability and potential for educational use of our own fundamental artifact—the computer—it is natural to expect that CS educators would turn to using computers in hopes of finding new ways to convey our own discipline’s core knowledge. In this paper we discuss the use of Algorithm Visualization (AV) and Program Visualization (PV) for CS education.
Early use of Algorithm Visualization
AV has a long history in CS education, dating from the 1981 video ``Sorting out Sorting'' (Baecker and Sherman, 1981) and the BALSA system (Brown and Sedgewick, 1985). Since then, hundreds of AVs have been implemented and provided free to educators, and hundreds of papers have been written about them (AlgoViz.org Bibliography 2011). Good AVs bring algorithms to life by graphically representing their various states and animating the transitions between those states. They illustrate data structures in natural, abstract ways instead of focusing on memory addresses and function calls.
Early systems, such as Balsa (Brown and Sedgewick, 1985), Tango (Stasko, 1990), XTango (Stasko, 1992), Samba (Stasko, 1997), and Polka (Stasko, 2001) suffered from the fact that their implementation technology was not easy to disseminate to a broad audience. This has often been a problem with earlier educational software. MIT’s Project Athena (Champine, 1991) sought not only to provide interactive courseware, but also to solve issues of dissemination through the X Windows display system (Gettys et al.,
1989). Many of the AV systems of the late 1980s and early 1990s were built on X Win-dows for this reason. However, the fact that many institutions did not have access to suf-ficiently powerful workstations to run X Windows in an educational laboratory setting made access to this courseware difficult.
The first significant attempt to assess the pedagogical effects of algorithm visuali-zation was conducted by Hundhausen et al. (2002). They performed a meta-study of 24 prior small-scale experiments related to AV. They found that 11 of those experiments showed a “statistically significant difference between the performance of a group of stu-dents using AV technology and another group of stustu-dents using an alternative AV tech-nology or no AV techtech-nology at all”. Ten showed a nonsignificant result, two showed a significant result but the AV’s contribution was uncertain, and one showed a significant result where the AV appeared to reduce learning. Measuring the educational gain was found to be difficult due to lack of agreement on the type of knowledge being measured. Some experiments involving AV technology measure conceptual or declarative knowledge (comprehension of the concepts of an algorithm) as well as procedural knowledge (internalization of the step-by-step behavior and data manipulation of an algo-rithm). AVs in these studies were found to give the most significant results when measur-ing only the procedural knowledge.
AV systems reviewed in (Hundhausen et al., 2002) had mixed results in regard to their pedagogical effectiveness. Use of XTango (Stasko et al., 1993) did not result in a statistical difference in post-test accuracy between students taught only by the textbook and those using textbook and the visualization tool. Another experiment involving XTango and Polka (Byrne et al., 1999) as lecture aides resulted in better ability to predict the next step of the algorithm for students who viewed the animation in comparison to ones who only used the textbook. On programming accuracy, students who constructed and viewed algorithm animations using Balsa II (Brown, 1988) and Polka (Kann et al., 1997) outperformed learners who did not use them. We note that the AV systems under study were all of the pre-Java variety, and the studies were conducted at a time when stu-dent access to computers (and especially to the AVs being used) would come only in a computer lab setting.
Perhaps the most significant findings of the Hundhausen et al. (2002) meta-study are that 1) How students use AV, rather than what they see, has the greatest impact on educational effectiveness; and 2) AV technology is effective when the technology is used to actively engage students in the process. This view that engagement is key has had enormous impact on subsequent AV development.
Algorithm Visualization in the Internet Era
Much changed in the mid 1990s with the advent of the World Wide Web and the Internet as we know it. In large part due to the widespread availability of Java, and to a lesser ex-tent of JavaScript and Flash, AVs soon become available to many more instructors and students. At about the same time, more and more students gained access to their own computers on campus. During the late 1990s and early 2000s, a whole new crop of AV development systems based on Java came into being, and the older X Windows-based AV systems lost what little traction they had with the educational community.
Examples of the newer systems written in Java include JSamba (Stasko, 1998); JAWAA (Pierson and Rodger, 1998); JHAVÉ (Naps et al., 2000); ANIMAL (Rossling et al., 2000); and TRAKLA2 (Korhonen et al., 2003). One unifying feature of these systems is that they are intended to be complete toolkits for building AVs. This followed in the tradition of the pre-Java systems, which offered a programming framework for would-be AV developers. While the pre-Java systems were not easy to develop in, they at least made the development process feasible for those willing to invest considerable effort. In contrast, some of the Java-based development systems (such as JAWAA) focused partic-ularly on making it easy for instructors to develop visualizations, albeit without much support for interactivity.
A key change that coincided with the use of Java was the advent of collections of AVs independent of any proposed AV development system. Java granted an AV devel-oper independence from any given devel-operating system or similar constraints, and the Inter-net allowed the software to be easily distributed. This changed how developers viewed their role. While JHAVE and ANIMAL follow the tradition of providing a “system”, their AV content is also significant. Many other projects have developed AVs as a stand-alone package with no pretensions of providing an AV system to be used by other devel-opers. Examples of significant pre-packaged collections include Data Structure Navigator (DSN) (Dittrich et al., 2001), Interactive Data Structure Visualization (IDSV) (Jarc, 1999), Algorithms in Action (Stern, 2001), Data Structure Visualization (Galles, 2006), and TRAKLA2 (Korhonen et al., 2003).
Another effect of the Java revolution was the advent of one-off AV development by students and/or instructors. Building an AV is a great way for a student to learn Java, something that they found attractive in the late 1990s. Unfortunately, most of these stu-dent-built AVs were poor in terms of pedagogical value (Shaffer et al., 2010). Fortunate-ly, a number of particularly well-regarded AVs were also developed, usually as part of a sustained effort over several years to create individual Java applets to present specific lessons. Examples include Binary Treesome (Gustafson et al., 2011), JFLAP (Rodger, 2008), University of Maryland’s Spatial Index Demos (Brabec and Samet, 2003), and Virginia Tech’s Algorithm Visualizations (2011).
The Impact of Engagement
The early-to-mid 2000’s saw a series of influential Working Group reports conducted as part of the annual ACM ITiCSE conference (Naps et al., 2002, Naps et al., 2003, Rossling et al., 2006). Naps, et al. (2002) extended the conclusions of Hundhausen, et al. (2002) regarding the need for AVs to engage the learner in an active way. Their report defined a taxonomy that specifies the level and the type of engagement at which AVs can involve learners. They defined six engagement categories.
• No Viewing indicates cases where no AV is used.
• Viewing involves both watching the AV execution and directing the pace of the AV. • Responding involves answering questions about the visualization being viewed. • Changing asks the learner to provide input data to the AV to direct its actions. • When Constructing, students build their own visualization of the algorithm. • Presenting asks the learners to tell about the AV and gather feedback.
This taxonomy imposes a hierarchy in the learner engagement that is closely related to the Bloom Hierarchy (Bloom and Krathwohl, 1956).
Urquiza-Fuentes and Velázquez-Iturbide (2009) performed a new meta-study to evaluate AVs in regard to their pedagogical significance. Their evaluation focused on ar-eas where some educational benefit has been perceived. The educational benefit was measured against the taxonomy defined by Naps, et al. (2002). They found that Viewing does not increase the learning benefit compared to No Viewing. This is consistent with the prior findings of Hundhausen, et al. (2002). Unfortunately, Shaffer et al. (2010) report that most AVs are still at the Viewing level.
Urquiza-Fuentes and Velázquez-Iturbide found that students interacting at the Re-sponding level with an AV have significantly better knowledge acquisition than those using AVs with only Viewing features. The Changing level has better acquisition results than the Responding level. Constructing an AV improves the learning outcomes more than Changing (though at a significantly greater cost in time and effort). The Presenting level has better acquisition results than Constructing.
Among the successful AVs, Urquiza-Fuentes and Velázquez-Iturbide cite specific examples from various larger AV systems. JHAVÉ (Naps et al., 2000) AVs consist of a graphical interface plus textual information about the algorithm and some questions for the learners. JSamba (Stasko, 1998) lets learners and instructors use a scripting language to customize the representation of data structures. TRAKLA2 (Korhonen et al., 2003) includes exercises where the learner demonstrates proficiency in a step-by-step execution of the algorithm, assessing the knowledge of the learner by asking him to predict the next step of the algorithm. Alice (Cooper et al., 2000) allows the learner to visualize objects in a 3D virtual world. jGRASP (Hendrix et al., 2004) lets instructors develop specific visu-alizations to satisfy an objective (how they want the learners to see the objects).
Urquiza-Fuentes and Velázquez-Iturbide note that an element typically found in successful AVs is “narrative content and textual explanations.” Integrating an explanation with the steps of the visualization improves learning at the Viewing engagement level. “Feedback on student action” is a feature at the Responding engagement level, where the student is actually engaged by demonstrating their proficiency with the knowledge. “Ex-tra time using the AV” can be achieved when the students are asked to construct or to customize an AV (the Constructing engagement level). Good AVs also provide advanced features like a more versatile interface to manipulate and direct aspects of the visualiza-tion (often required to support the Responding level and above).
Myller et al. (2009) investigated the impact of engagement on collaborative learn-ing. They extended the engagement taxonomy of Naps et al. (2002) to better capture the differences between student behaviors. They added four engagement levels, including Controlled Viewing and Entering Input, falling between the original levels of Viewing and Responding. They claim that their extended engagement taxonomy (EET) can also be used to guide successful collaboration among students when using visualization tools. To probe their claim, Myller et al. (2009) conducted an experiment in which students were asked to work in pairs during lab session. The students interacted with the program visu-alization tools BlueJ (Sanders et al., 2001) and Jeliot (Levy et al., 2003) at different EET levels. They observed and recorded all students’ communication during the experiments. They found that EET levels are positively correlated with the amount of interaction.
In-teraction is one of the essential ingredients for a successful computer-supported collabo-ration along with coordination and motivation (Meier et al., 2007).
Some Selected Visualization Artifacts
In this section we describe in some detail several visualizations or systems that have sup-ported documented pedagogical improvements. We selected that showed a statistically significant difference in student's performance before and after using the visualization systems under a controlled experiment, typically because they engaged learners at levels of the taxonomy above Viewing.
TRAKLA2
TRAKLA2 is one of the most widely used AV collections, routinely used throughout Finnish universities. It provides an outstanding example of operating at the Responding engagement level. TRAKLA2 allows the learner to control the visual representation of the data structures manipulated by the algorithm. Learners can “build” a data structure by dragging and dropping GUI elements. TRAKLA2 exercises ask learners to determine a series of operations that will change the state of the data structure to achieve some out-come. For example, students might build a tree data structure by repeatedly dragging new values to the correct locations in the tree. Alternatively, the learner can practice to gain understanding by examining a step-by-step execution of the algorithm (called the model solution). Many TRAKLA2 exercises include some tutorial text along with pseudocode to explain the algorithm, but their main purpose is to provide an interactive proficiency exercise.
Figure 1 here.
Laakso, et al. (2005) report on the use of TRAKLA2 exercises in data structures and algorithms courses at two universities in Finland. TRAKLA2 exercises were incorpo-rated as classroom (closed lab) exercises, and supplemented lecture hours and classroom sessions. TRAKLA2 exercises were also incorporated into the final exam (one out of five questions) and midterm (they replaced half of a question with a TRAKLA2 exercise in a total of five questions). A year after the introduction of TRAKLA2 in the curriculum, the activity of students increased in all aspects of the course, not only the part involving TRAKLA2 exercises. The average performance in classroom exercises rose from 54.5% to 60.3% (number of exercises completed). Students’ opinion of TRAKLA2 was collect-ed through an online survey. 80% of the students reportcollect-ed having a good opinion of TRAKLA2. After a year of using TRAKLA2, the opinion of students on its suitability for instruction rose significantly. 94% of students agreed that TRAKLA2 exercises helped in their learning process. Their opinion did not change regarding their preference on the medium used to access and perform the exercises: they prefer a mixed (online and tradi-tional classroom) experience. The later result confirms recommendations on integrating AVs with existing class materials from Levy and Ben Ari (2007), discussed below.
Usability plays a big role in the success of an AV in regard to the learning objec-tives. Usually learners spend more time-on-task when using an AV system. But it is not clear if this is because the learners have to get used to the system due to its lack of usabil-ity (Pane et al., 1996). The usabilusabil-ity of TRAKLA2 has been studied through a series of questionnaires and observations in a usability lab (Laakso et al., 2005). The observations did not find any critical usability issues, and revealed that 80% of the time was used to solve exercises while 14% of the time was used to get acquainted with the system inter-face. The students had a total of 15 minutes to complete all the exercises. This is an im-portant finding since it is typical that any given AV is intended to be used from only a few minutes up to a couple of hours.
TRAKLA2 has been used to assess the impact of the Extended Engagement Tax-onomy on student performance. Laasko et al. (2009) studied whether students using a visualization tool in pairs at EET level changing outperformed pairs using it on EET-level controlled viewing. First-year students were divided into two groups, both groups using the same textual materials. The treatment group (EETlevel changing) used TRAKLA2 exercises while students in the control group (EET-level controlled viewing) viewed AVs containing equivalent information. All the students took an individual pre-test and were asked to freely form pairs. Then they had 45 minutes to study the learning materials and solve exercises together (using paper and pencil). All the students were also asked to take an individual post-test. The students were videotaped during the experi-ment. The first analysis of pre-test and post-test scores did not show a statistically signifi-cant difference between the treatment and the control group. But a second analysis of the video revealed that some students in the treatment group were not using TRAKLA2 as expected: They did not solve TRAKLA2 exercises but instead just watched the model solution. Thus they were interacting at the EET-level controlled viewing. After regroup-ing the students by creatregroup-ing a third group for the students in the treatment group interact-ing on the controlled viewing level, the analysis of the scores showed that the students in the treatment group interacting on a changing level outperformed the controlled viewing groups.
JHAVÉ
JHAVÉ (Naps et al., 2000) is an AV development system aimed at making it relatively easy for AV developers to create animated slideshows with built-in assessment through pop-up questions to users. JHAVÉ’s interface includes a pane containing the visualiza-tion, a pane displaying the pseudocode, and often a brief text giving a tutorial about the algorithm. The information page allows importing of images and has been used for ex-ample to represent the algorithm’s flow chart. JHAVÉ now includes a large collection of AVs, and has seen wide use.
Lahtinen and Ahoniemi (2009) developed “Kick-Start Activation”, a method for teaching CS1 courses to learners with no programming experience using visualization. Their method relies on three requirements.
• A “real programming problem” as the starting point of the lesson. Data structures, pseudocode, flow charts, and programming concepts are explained based on the solu-tion of the problem. Visualizasolu-tion tools are used as class materials.
• Use of pseudocode and flow charts to represent the algorithmic solution of the prob-lem. The pseudocode looks similar to a description in English.
• The student should interact with the algorithm (testing, debugging, etc).
Lahtinen and Ahoniemi argued that most AV systems presume that learners are already familiar with the programming language used by the system. Since they were tar-geting novice learners with no or little programming experience, they needed an AV sys-tem that is syntax free and flexible enough to represent the flow chart of the algorithm within the system. JHAVÉ was chosen as the visualization tool to supplement their meth-od. In Kick-Start Activation, students are asked to design an algorithm at an early stage of the class, called “the premature algorithm”. They then test and visualize their solution and eventually amend it. The result is “the mature algorithm” and it is visualized in JHAVÉ. When using this method, learners are engaged with the AV system at the View-ing, Responding, Changing, Constructing, and Presenting levels. The evaluation of Kick-Start Activation/JHAVÉ reveals that 86% of the students found the visualization useful for learning. Students with no programming experience found it more useful than ones with previous experience. Interesting aspects of this experiment include integration of the AV into a pedagogical method, and an innovative way of using the AV tool: pseudocode close to English and construction of the algorithm’s flow chart using images, all pack-aged with the Java applet for the algorithm. This was possible because of the flexibility of JHAVÉ. Students used JHAVÉ throughout the entire class.
JHAVÉ-POP (Furcy, 2007) is a JHAVÉ extension for practicing elementary pointer and linked-list operations. The user can type code snippets in C++ or Java, and JHAVÉ-POP automatically generates a step-by-step visualization of the contents of memory as each program statement is executed. Student feedback on JHAVÉ-POP col-lected through a questionnaire (Furcy, 2009) indicates that “JHAVÉ-POP deepens student understanding of pointers by making them concrete” and it “helps students not only un-derstand but also debug their programs”.
Figure 2 here.
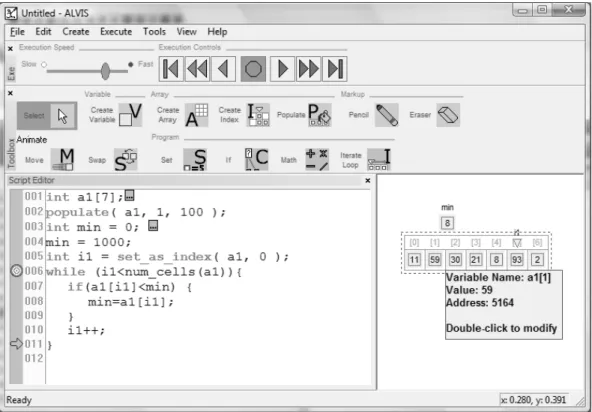
ALVIS
ALVIS (Hundhausen and Brown, 2005) is a program development environment where programs are written using a pseudocode-like language called SALSA. It includes fea-tures to support storyboarding. Hundhausen and Brown (2008) developed pedagogy with the goal of involving their students at all five engagement levels within a first semester programming class studio experience. In this experiment, students worked in pairs to cre-ate their own visualization of algorithms studied in class. They presented and discussed their solutions with classmates and instructors. The students used ALVIS to develop their solution. To evaluate their system, Hundhausen and Brown divided the learners into two groups, one using ALVIS and the other using art supplies (pen, paper, tape, etc.) to build their visualizations. All students developed their solutions in SALSA, using either a text editor (art supplies group) or ALVIS. Students were videotaped during studio sessions. All artifacts used during the sessions were collected afterward. All students answered a series of questionnaires to describe their experience, and the students using art supplies were interviewed at the end of their sessions. For both session groups, students spent the
majority of their time coding their solution. Students using art supplies discussed more with the teaching assistant in comparison to students using ALVIS. Codes developed by the ALVIS students had approximately half as many errors per solution/algorithm as the ones in the art supplies group. Hundhausen and Brown contend that developing an algo-rithm using either approach prepared the student for discussion and critical thinking. At the end of the experiment, ALVIS was found to help students code faster, with less se-mantic errors, and foster audience participation during presentation yielding more tech-nical discussion about the algorithm.
Figure 3 here.
Virginia Tech Hashing Tutorial
The Virginia Tech Hashing Tutorial (2011) goes beyond a simple AV, providing a com-plete textbook-quality treatment of an important topic in CS, the concept of search by hashing. A series of AVs (in the form of Java Applets) are embedded in text presented in HTML pages. In addition to showing the basics of the hashing process, additional applets allow students to explore the relative performance of various approaches discussed in the tutorial.
Figure 4 here.
In 2008 and repeated again in 2009, students in separate sections of a sophomore level course on data structures and algorithms were taught about hashing using two sepa-rate treatments. One section was given standard lecture and textbook for one week, simi-lar to what had been done previously in the class. The other section spent one week of class time working through the online tutorial with AVs to present the same material. Since the tutorial used text from the course textbook, it was an exact match to the materi-al being presented in the control section. However, the online tutorimateri-al heavily supple-mented this text with AVs.
In each of the trials, the two sections were given a quiz on hashing at the conclu-sion of the week. The results were positive: significant differences in performance were obtained in favor of those who used the online tutorial versus standard lecture and text-book. This means that not only can an online tutorial be as effective as lecture (with im-portant implications for distance learning), but that providing proper interactivity allows computerized instruction to be better than lecture-based (passive) instruction. However, at least one major consideration might influence the results of this study: How much im-pact did the controlling structure of coming to class and doing the tutorial in “lab” setting have on the results? The outcome could be quite different for a student just reading the material and working through the AVs on their own, where self-discipline might not be
sufficient to provide the necessary amount of time and attention. Likewise, the controlled environment of attending lecture before reading the textbook on one's own is also likely to have a major difference compared to just reading the book on one's own.
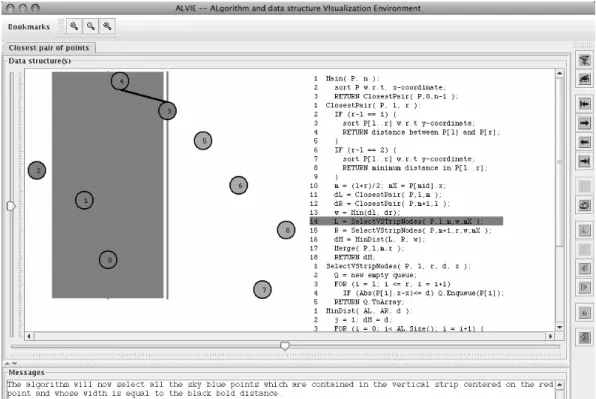
AlViE
Like JHAVÉ, AlViE (AlViE, 2011) is a “post-mortem algorithm visualization tool” since it allows the learner to see the resulting visualization after an algorithm execution. This means that the visualization is driven by a script that could be generated in a number of ways, including from an instrumented program executing a complex algorithm or simula-tion. It is written in Java and uses XML to describe the data structures and the relevant events of the algorithm execution.
Figure 5 here.
Crescenzi and Nocentini (2007) describe the results of two years of teaching data structures and algorithms using AlViE intensively. They designed the courses such that their students go through the maximum number of engagement levels. The first year of the experiment involved the engagement levels No Viewing, Viewing, Constructing, and Presenting. AlViE was systematically used during class sessions to teach students about algorithms and data structures. The homework consisted of implementing an algorithm without the help of the visualization tool. Each student was assigned a final project to build an animation for a specific algorithm using AlViE and then present it to his/her peers and the instructor. The students were asked through a survey to evaluate their ex-perience with AlViE. 70% of the students reported “positive” and 30% “very positive” opinions on the use of AlViE for the final exam. 90% of the students agreed that viewing the animation improved their understanding of the algorithm’s behavior. All students agreed that the use of visualization was educationally valuable.
During the second year, the authors made some changes: They published a (print-ed) textbook (Crescenzi et al., 2006) and they added the Changing engagement level. The interesting point of the textbook is that was designed to be an extension of AlViE, with the textbook describing the algorithm and the data structures. All illustrations in the text-book come from the AlViE GUI. Readers are invited to visualize the execution of all al-gorithms presented in the book. The textbook and AlViE have been adopted by several universities in Italy.
Alice
Alice (Alice, 2011) is a 3-D interactive programming environment. It allows users to cre-ate virtual worlds by dragging and dropping objects in the main windows. Users can write scripts to control the objects’ behavior. Alice’s goal is to expose novice learners to object-oriented programming using a simple, graphical interface. Its ease of use and sup-port for storytelling has lead to wide adoption within the CS community. It has been used to introduce students at a wide variety of levels to programming, including CS majors, non-majors, high school students, and middle school students.
Figure 6 here.
Moskal, et al. (2004) performed a study to find if exposure to Alice improves CS1 students’ performance. Specific questions were: Is Alice effective in improving the reten-tion rate of students in the CS major? Does exposure to Alice improve students’ confi-dence in their ability to succeed in CS? All students involved in the experiments were CS majors. They were divided into three groups: (1) A treatment group consisting of students with no or little programming experience and who enrolled in the Alice-based course. (2) Control group 1 with students with no or little programming experience and who did not enroll in the Alice-based course. (3) Control group 2 consisting of students with previous programming experience and who did not enroll in the Alice-based course. Students in the treatment group earned an overall GPA of 3.0 ± 0.8 in the class. Students in control group 1 earned an overall 1.9 ± 1.3 GPA. Control group 2 earned an overall GPA of 3.0 ± 1.2. Historically, students who reach college with little or no prior programming experi-ence do far worse in introductory CS courses and have much lower retention rates than students who come to college with programming experience, so this is potentially an im-portant result. The retention rate over the two years of the experiment was 88% for the treatment group, 47% for control group 1 and 75% for control group 2. Evaluation of stu-dent attitudes revealed that stustu-dents with no prior programming experience who did not take the Alice-based course had “more negative attitudes with respect to creativity in computer science after CS1”. The authors concluded that Alice was effective in improv-ing student performance, that it can help increase the retention rate in CS programs, and that it can better the attitude of students toward CS.
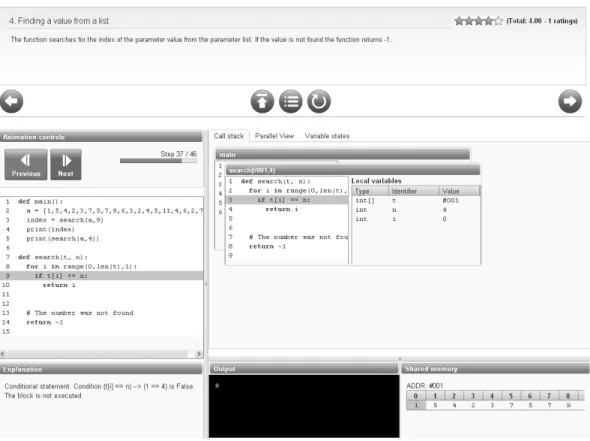
JELIOT
Jeliot (Levy et al., 2003) is designed to help teach Java programming to high school stu-dents. In Jeliot the learner can visualize program source code along with an automatically generated animation showing the behavior of the program. Thus, Jeliot is an example of a Program Visualization (PV) tool, since it visualizes the behavior of an actual program rather than a hand-crafted presentation of an abstract algorithm. PVs are able to generate visualizations that give insight into the behavior of actual programs with little additional effort on the part of the programmer beyond writing the program. They have the disad-vantage that they cannot so easily abstract away irrelevant details and focus on higher-order or key selected aspects of the underlying algorithm. The interface allows for step-by-step execution of the program.
Figure 7 here.
Jeliot visualizations were used to present conflicting animations by Moreno et al. (2007). They argue that conflicting animations can be used to expose learners’
miscon-ceptions about programming concepts. Conflicting animations extend the Responding engagement level by asking the student to detect errors in the animation that is being exe-cuted. The Changing level requires students to fix the erroneous part of the animation. The student might construct a conflicting animation at the Constructing level and present it to their classmates, thus extending to the Presenting engagement level. Moreno et al. (2010) developed Jeliot ConAn, a Jeliot-based AV system to generate animations that contain known bugs.
To enhance learner’s mental models, Ma et al. (2009) proposed a four-stage mod-el to detect and fix bad mental modmod-els regarding programming concepts. A modmod-el’s stag-es are: Preliminary: Find the erroneous pre-existing mental mode; Cognitive conflict: dispute the student’ pre-existing mental model and then induce adaptation/change in the model; Model construction: Use visualization to aid students in the process of construct-ing a correct mental model; Application: Test the newly constructed mental model (typi-cally by solving programming problems). To assess mental models, the student logs into a system displaying a roadmap of all the programming concepts that must be understood. Each concept is attached to a series of exercises. Each exercise is linked to a cognitive question, its associated Jeliot visualization materials, and a final question to test under-standing of the concept. If a student’s answer to the cognitive question is incorrect, then he is required to run the visualization attached to the question to identify the discrepancy between his model and the program’s execution. During this phase the student can be helped by the instructor to improve his understanding of the algorithm. The student is tested again using a similar program implementing the same concept with different data values. The authors evaluated their models on three content areas: Conditionals and loops, scope and parameter passing, and object reference assignment. Out of 44 students who participated in the experiment on conditionals and loops, 23% had a correct standing of the concept at the beginning of the experiment, and 73% had a correct under-standing at the end of the experiment. Only 19% of the learners had a good comprehen-sion of scope and parameter passing prior to the experiment, and 85% after. Ma et al. (2009) found that their model works well on simple concepts, but its benefits are hardly perceptible on the more complex ones (e.g. object reference assignments).
ViLLE
ViLLE (Rajala et al., 2007) is a program visualization tool developed at the University of Turku in Finland. It is designed to be used as a lecture aide or for independent learning to visualize the execution of example programs created by instructors or students. The user can follow changes in program states and data structures. The key features of ViLLE are its support for multiple programming languages (including Java, C++ and an extensible form of pseudocode) and its built-in editor for interactive quizzes and tests displayed as pop-up windows.
Figure 8 here.
The effectiveness of ViLLE was assessed through an experiment on students in their first programming class (Rajala et al., 2008). The students were divided into two
groups, one using ViLLE and the other using only the textbook. The experiment took place during a two-hour computer lab session. Students in both groups took a pre-test where they were asked to predict the output or the state of a program. Then they read a programming tutorial with ViLLE as lecture aid for one group and only the tutorial for the other group before taking the post-test. The post-test had the same question as the pre-test plus two extra questions about completing a piece of program with given statements. The experiment did not reveal a statistically significant difference between the ViLLE group and the control group as far as learning acquisition. However, within the ViLLE group, there was a significant difference in knowledge improvement for students with no previous programming experience over those with prior experience, thus reducing the gap between novice and experienced programmers. In contrast, a significant difference in the total points earned in the post-test remained between students with prior programming experience and those with no prior experience in the control group. Another experiment was conducted using high school students (Kaila et al., 2010). All class materials were accessible via the Moodle course management system with links to ViLLE for the treat-ment group. At the final exam, students using ViLLE performed better than the control group (statistically significant). ViLLE was more effective for program execution tracing and learning program writing skills.
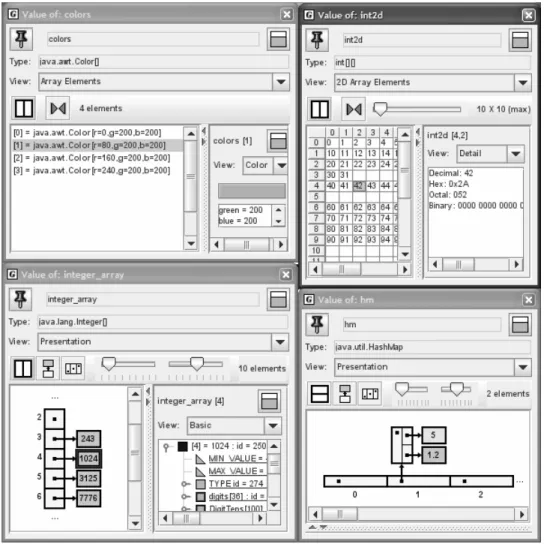
jGRASP
jGRASP (Hendrix et al., 2004) provides a complete program development environment with synchronized “object viewers” that visualize objects and data structure states. It has been used in lab sessions when teaching CS2 courses using Java. A series of experiments were performed by Jain et al. (2006) at Auburn University to evaluate the pedagogical benefits of jGRASP. The experiments were intended to find if use of jGRASP data struc-ture viewers results in students being able to produce code with fewer bugs, and whether students are able to detect and fix “non-syntactical” bugs more accurately. Two experi-ments were conducted to answer those questions. In each experiment, students were di-vided in two groups. One used only the JGRASP debugger while the other used both the debugger and the object viewers. The students were observed during in-lab activities. They were required to implement four basic operations with singly linked lists. This ex-periment showed a statistically significant difference between the two groups in regard to accuracy. The mean accuracy was 6.34 points for the treatment group and 4.48 points for the control group. The authors concluded that in most cases (95%), jGRASP can be used to “help increase the accuracy and reduce time taken for programs implementing data structures”. During the second experiment, students were asked to detect and fix non-syntactical errors in a Java program (containing 9 errors) implementing a singly linked list with four functions. This experiment showed that the students using object viewers detected on average 6.8 bugs versus 5.0 for the control group. Students using the visual-izers were able to correct an average of 5.6 bugs and introduced only 0.65 new errors in the program while the control group fixed 4.2 bugs and introduced 1.3 new errors on av-erage. However, students using the object viewers spend slightly more time to complete the task: 88.23 minutes on average versus 87.6 minutes for the other students.
JFLAP
JFLAP (Java Formal Languages and Automata Package) (Rodger, 2008) is designed to help teach formal languages and automata theory. This is traditionally senior-level mate-rial, though JFLAP has been used to teach aspects of formal languages to first-semester students. User can build a variety of automata in JFLAP, then simulate and visualize their behavior. JFLAP can also be used to create and parse strings in grammars and convert a nondeterministic finite automaton to a deterministic finite automaton. JFLAP effective-ness was assessed through a two year study (Rodger et al., 2009) involving twelve uni-versities the first year and fourteen the second year. The goal of the experiment was to answer the questions “How effective is JFLAP in enhancing the learning process?” and “What additional value might JFLAP add to the Formal Languages and Automata course?” During the first year, most of the instructors used JFLAP for homework and for demonstrations in class; no instructor used it for examinations. The results after the first year of the experiment showed that 55% of the students used JFLAP to study for exams. 94% said that they had enough time to learn how to use JFLAP. 64% said that using JFLAP helped them to earn better grades. 83% said that it was easier to use JFLAP then paper and pencil. However, 50% thought that they would have performed as well in the class without using JFLAP. During the second year of the experiment, the pre- and post-test were shortened. The survey revealed that when preparing for exams, 32% of the stu-dents used JFLAP during more than 20% of their study time. And 29% of the stustu-dents used it to study additional problems. JFLAP made the course more enjoyable for 63% of the students, and 72% said that using JFLAP made them feel more engaged in the course.
Figure 10 here.
How much are AVs used in Computer Science Courses?
Periodic surveys of instructor interest in AVs and their level of use have been conducted at CS education conferences and on CS education listservs for more than a decade. Naps et al. (2002) report on three surveys conducted in 2000. Collectively, they indicate a strong positive view in favor of AV use (over 90%). However, only about 10% of re-spondents at that time indicated frequent use of AVs in data structures courses at their institutions, while half to three quarters indicated occasional use of AVs in such classes.
At SIGCSE'10 (a major CS education conference, held in Milwaukee during March 2010) we conducted a new survey to determine instructor attitudes toward AVs and their use in the classroom. For details, see Shaffer, et al. (2011). The survey was de-signed in the spirit of the 2000 surveys reported in Naps, et al. (2002) and the findings are consistent with those earlier results. In 2010, 41 of 43 respondents agreed or strongly agreed that AVs can help learners learn computing science, with two neutral. However,
just over half had used AV in a class within the past two years. It is not clear that all of the “yes” answers refer to what we might consider to be “AVs”. But they probably all refer to some sort of dynamic software visualization run on a computer, as was the case in the 2000 survey. We did not ask about frequency of use of AVs in class.
Our third survey question asked what respondents see as the greatest impediments to using AVs in courses. Roughly half the responses relate to finding suitable AVs to use. The other half of the responses relate to issues in integrating AVs into the courses. These results are roughly the same as reported in (Naps et al., 2002, Naps et al., 2003) and (Rössling et al., 2006). Such issues are much harder to deal with, and are representative of well-known problems for adoption of educational technology in general (Hew and Brush, 2007). While it is easy to give students pointers to AVs as supplemental material, it is much harder to integrate AVs into lectures, labs, and assignments. This comes as a result of factors like lack of time on the instructor's part to make course changes, lack of time within the course to spend additional time on a given topic, and inconsistencies be-tween the course textbook and the AV.
AV use in the classroom is highly dependent on the instructor’s willingness to in-tegrate AVs into their class material. Levy and Ben-Ari (2007) studied adoption of Jeliot by instructors. They grouped instructors into four categories. One group used Jeliot regu-larly during a school year, and two groups were asked to use Jeliot at least once in an ex-ercise. All instructors were acquainted with Jeliot but had no prior experience with using an AV in their classroom. They classified instructors’ experience using AVs into four categories, each category defined by a specific attitude toward the use of AVs in class-room.
• Internalization: Instructors who found Jeliot useful and consistent with their teaching approach. They used the system frequently and integrated it into their class materials and activities.
• By-the-book: Instructors who found Jeliot useful but did not integrate it well with the class. These teachers relied on the textbook and used the AV only occasionally. • Rejection: Jeliot was perceived by these instructors as having limited educational
benefits, thus they did not use it in their class.
• Dissonant: This category of instructors experienced Jeliot with mixed feelings. They profess enthusiasm about the system but are disinclined to use it in their classroom. These instructors use the system only when required to.
To better the experience of instructors using AVs, Levi and Ben-Ari advocate for a higher integration (by designers) of AVs into existing class materials like textbooks. This was also recommended by Naps, et al. (2002b), who encourage AV designers to create supporting web sites along with the AV to ease the integration process.
An important resource for instructors seeking to use AVs is the AlgoViz Portal (AlgoViz.org, 2011). AlgoViz provides a gateway for users and developers to AV-related services, collections, and resources. It includes a catalog of over 500 AVs, and a large bibliography of related research literature. AlgoViz attempts to address issues raised in the instructor surveys regarding lack of information about AV availability and use. AlgoViz allows the community to add value beyond information embodied in a simple AV catalog. This value comes as a byproduct of direct communication between commu-nity members. While forums are one obvious method for this, there is a deeper communi-cation involving community ratings and recommendations for content entries and sharing
experiences on how to make the best use of content. A major concern for instructors ac-cording to the surveys is deciding whether a given educational resource is of good quali-ty, and knowing how to use it. Therefore, user feedback on resources is as important as the catalog entries. AlgoViz also provides the field report, which gives a convenient way for instructors who have used an AV in a class to share their experience. Field reports supplement the evaluation data in the AV Catalog, since catalog AV ratings are not typi-cally based on real-world classroom experiences. A field report can thus provide empiri-cal evidence to strengthen or qualify a recommendation.
Important technological factors contribute to making AVs easier to use in the classroom than in prior years. More AVs are available than ever before (Shaffer et al., 2010), backed up by improved research studies and improved access both through gen-eral Internet search and at the AlgoViz Portal. Increased access to the Internet by students and instructors, both in and out of the classroom, makes AV use more practical. For ex-ample, at Virginia Tech, while it has been “possible” to project Internet material from a computer in class for over a decade, it has only been in the past few years that such ac-cess has become both ubiquitous and reliable in all of our classrooms. This makes a huge difference in the confidence of mainstream instructors for using such technology, in con-trast to early adopters (Hew and Brush, 2007). From discussions with instructors and from comments on the surveys, we know that even now not all schools have sufficient classroom support infrastructure to allow broadcasting of Internet presentations in typical classrooms. This is still an evolving technology.
Another potential factor in favor of increased use of AVs is ubiquitous availability of laptops and mobile devices. For example, all Engineering majors at Virginia Tech are required to own a tablet PC, and most also have mobile devices including smartphones, eBook readers, or iPads. However, there is also a downside to the non-PC devices, in that they have various technology limits on how courseware content can be provided. So while there is ubiquitous access to the Internet among our target audience, there are still limits. For example, Java Applets cannot be displayed on most such devices. However, recent widespread adoption of the HTML5 internet standard makes it easier than before to develop interactive content. Content developed under the new standards will run on all major browsers without the need for specialized plugins, and will automatically be adapted to viewing on a variety of mobile devices. This means unprecedented ability for AV developers to reach a broader audience along with easier adoption of such innovative courseware by that audience.
The Future: Electronic Textbooks
Many in the CS community share the dream to create “hypertextbooks”, online textbooks that integrate AVs, assessment exercises, and traditional text and images. Ef-forts to create hypertextbooks have been ongoing for two decades. Goals include improv-ing exposition through a richer collection of technologies than are available through print textbooks, and increasing student engagement with the material to get them to learn at a higher level in Bloom's taxonomy. See (Rössling et al., 2006; Ross and Grinder, 2002; Shaffer et al. 2011) for background on efforts to define and implement the hypertextbook.
Hopefully the technology is in place to finally achieve these goals in the near fu-ture. As noted, HTML5 sets the stage as never before. The real game-changing potential that the computer brings to education is its ability to allow the student to interact in non-passive ways with information, and the ability to provide immediate feedback to the stu-dent based on these interactions. The vision goes beyond simply creating an interactive eTextbook. Many in the community embrace the concept of a true Creative Commons for textbook creation, not just in terms of licensing but in terms of allowing for community creation of artifacts. The goal is to allow instructors to modify existing eTextbooks by adopting major portions and then changing sections, or taking chapters from different books and combining them. This aspect of an eTextbook creative commons is already in place with the Connexions (2011) project. However, existing eTextbooks available from Connexions are not heavily interactive in the way that advocates of AV hope to see.
The survey results presented above lead us to the conclusion that it is easier to in-tegrate a complete block of instruction (either a complete topic or even a semester course) than it is to fit a new piece of instruction such as an AV into existing presentation on that topic. Instructors are used to the concept of adopting a new textbook for new courses that they teach, and often welcome lecture notes and other class support artifacts. Even for courses taught previously, instructors will adopt new textbooks and new presentations for various topics in the course. A key aspect is that adopting a new chunk of content allows the instructor to completely replace or populate a block of course time, as opposed to squeezing new content or presentation techniques on top of existing material. In the past, most AV developers have implicitly taken the approach that their AV will be integrated into existing presentations. A typical example might be an AV presenting a sorting algo-rithm, with no tutorial explanation of the algorithm. The idea seems to have been that this visualization can be slipped into lecture or used by students to supplement the textbook for self-study. But this approach has led to the problems noted above, particularly disso-nance with other course materials. In contrast, a complete unit of instruction (including AVs) can more easily replace an unsatisfactory existing presentation of the topic.
The final piece of the vision is to have students also participate in the eTextbook creative commons. They could do so by supplying comments, tagging, and rating of con-tent at a detailed level such as for a particular topic, subtopic, or exercise. By interacting with each other and their instructors, they can give direction to improving course materi-als by drawing attention to what does and what does not work. This enables both a higher level of engagement by the students, and a huge motivating force for improvement of in-structional material.
REFERENCES
AlgoViz.org Bibliography (2011). Annotated bibliography of AV literature
Alice Website (2011) http://www.alice.org.
AlViE Website (2011). AlViE 3.0. http://alvie.algoritmica.org/.
Baecker, R. and Sherman, D. (1981). Sorting out sorting. http://video.google.com
Bloom, B. S. and Krathwohl, D.R. (1956). Taxonomy of Educational Objectives: The Classification of Educational Goals. Handbook I: Cognitive Domain. Longmans. Brabec, F. and Samet, H. (2003). Maryland spatial index demos website. http://donar.
umiacs.umd.edu/quadtree/.
Brown, M. H. and Sedgewick, R. (1985). Techniques for algorithm animation. IEEE Software, 2(1):28-39.
Brown, M.H. (1988). Exploring algorithms using Balsa-II. Computer, 21(5):14–36. Byrne, M.D., Catrambone, R., and Stasko, J.T. (1999). Evaluating animations as student
aids in learning computer algorithms. Computers & Education, 33(4):253–278. Champine, G.A. (1991). MIT project Athena: a model for distributed campus computing.
Digital Press, Newton, MA, USA. Connexions Website (2011
Cooper, S., Dann, W., and Pausch, R. (2000). Alice: a 3-D tool for introductory pro-gramming concepts. Journal of Computing Sciences in Colleges, 15(5):107-115. Crescenzi, P., Gambosi, G., and Grossi, R. (2006). Strutture di Dati e Algoritmi. Pearson
Education Addison-Wesley.
Crescenzi, P. and Nocentini, C. (2007). Fully integrating algorithm visualization into a CS2 course: A two-year experience. In Proceedings of the 12th Annual SIGCSE Conference on Innovation and Technology in Computer Science Education, ITiCSE’07, 296–300.
Hendrix, T.D., Cross, J.H., and Barowski, L.A. (2004). An extensible framework for providing dynamic data structure visualizations in a lightweight IDE. In Proceed-ings of the 35th SIGCSE Technical Symposium on Computer Science Education, SIGCSE 2004, 387-391.
Dittrich, J.-P., van den Bercken, J., Schafer, T., and Klein, M. (2001). DSN: Data struc-ture navigator. http://dbs.mathematik.uni-marburg.de/research/projects/dsn/.
Furcy, D. (2007). JHAVEPOP
Furcy, D. (2009). JHAVEPOP: Visualizing linked-list operations in C++ and Java. Jour-nal ofComputing Sciences in Colleges, 25(1):32-41.
Galles, D. (2006). Data structure visualization.
Gettys, J., Newman, R., and Scheifler, R. (1989). Edited by Adrian Nye, "The Definitive Guides to the X Window System", Volume Two, Xlib Reference Manual for Ver-sion 11. O'Reilly & Associates, Inc.
Gustafson, B.E., Kjensli, J., and Vold, J.M. (2011). Binary treesome website,
Hew, K. and Brush, T. (2007). Integrating technology into K12 teaching and learning: current knowledge gaps and recommendations for future research. Educational Technology Research and Development, 55:223–252.
Hundhausen, C.D. and Brown, J.L. (2005). What you see is what you code: A radically dynamic algorithm visualization development model for novice learners. In Visual Languages/Human-Centric Computing Languages and Environments, 163–170. Hundhausen, C.D. and Brown, J.L. (2008). Designing, visualizing, and discussing
algo-rithms within a CS1 studio experience: An empirical study. Computers & Educa-tion, 50:301–326.
Hundhausen, C.D., Douglas, S.A., and Stasko, J.T. (2002). A meta-study of algorithm visualization effectiveness. Journal of Visual Languages and Computing, 13(3): 259–290.
Jarc, D.J. (1999). Interactive data structure visualization. http://nova.umuc.edu/ jarc/idsv. Kaila, E., Rajala, T., Laakso, M.-J., and Salakoski, T. (2010). Effects of course-long use
of a program visualization tool. In Proceedings of the Twelfth Australasian Con-ference on Computing Education - Volume 103, ACE ’10, 97–106.
Kann, C., Lindeman, R.W., and Heller, R. (1997). Integrating algorithm animation into a learning environment. Computers & Education, 28(4):223–228.
Korhonen, A., Malmi, L., Silvasti, P., Nikander, J., Tenhunen, P., Mård, P., Salonen, H.,
and Karavirta, V. (2003). TRAKLA2.
Laakso, M.-J., Salakoski, T., Grandell, L., Qiu, X., Korhonen, A., and Malmi, L. (2005). Multi-perspective study of novice learners adopting the visual algorithm simula-tion exercise system trakla2. Informatics in Education, 4(4):49–68.
Laakso, M.-J., Myller, N. and Korhonen, A. (2009). Comparing learning performance of students using algorithm visualizations collaboratively on different engagement levels. Educational Technology & Society, 12(2): 267–282.
Lahtinen, E. and Ahoniemi, T. (2009). Kick-start activation to novice programming — A visualization-based approach. Electronic Notes on Theoretical Computer Science, 224:125–132.
Levy, R. B.-B. and Ben-Ari, M. (2007). We work so hard and they don’t use it: Ac-ceptance of software tools by teachers. In Proceedings of 12th annual SIGCSE conference on Innovation and technology in computer science education, 246– 250.
Levy, R. B.-B., Ben-Ari, M., and Uronen, P.A. (2003). The Jeliot 2000 program anima-tion system. Computers & Education, 40:1–15.
Ma, L., Ferguson, J., Roper, M., Ross, I., and Wood, M. (2009). Improving the mental models held by novice programmers using cognitive conflict and Jeliot visualisa-tions. SIGCSE Bulletin, 41.
Meier, A., Spada, H., and Rummel, N. 2007. A rating scheme for assessing the quality of computer-supported collaboration processes. International Journal of Computer
Supported Collaborative Learning,2(1):63–86.
Moreno, A., Joy, M., Myller, N., and Sutinen, E. (2010). Layered architecture for auto-matic generation of conflictive animations in programming education. IEEE Transactions on Learning Technologies, 3:139–151.
Moreno, A., Sutinen, E., Bednarik, R., and Myller, N. (2007). Conflictive animations as engaging learning tools. In Seventh Baltic Sea Conference on Computing Educa-tion Research (Koli Calling 2007), 203—206.
Moskal, B., Lurie, D., and Cooper, S. (2004). Evaluating the effectiveness of a new in-structional approach. SIGCSE Bulletin, 36:75–79.
Myller, N., Bednarik, R., Sutinen, E., and Ben-Ari, M. (2009). Extending the engage-ment taxonomy: Software visualization and collaborative learning. Transactions on Computing Education, 9(1): 7:1-7:27
Naps, T.L., Cooper, S., et al. (2003). Evaluating the educational impact of visualization. In ITiCSE-WGR ’03: Working Group Reports from ITiCSE on Innovation and Technology in Computer Science Education, 124–136.
Naps, T.L., Eagan, J.R., and Norton, L.L. (2000). JHAVÉ—an environment to actively engage students in web-based algorithm visualizations. SIGCSE Bulletin, 32:109– 113.
Naps, T.L., Rossling, G., et al. (2002). Exploring the role of visualization and engage-ment in computer science education. SIGCSE Bulletin, 35:131–152.
Pane, J.F., Corbett, A.T., and John, B.E. (1996). Assessing dynamics in computer-based instruction. In Proceedings of the ACM Conference on Human Factors in Compu-ting Systems, 197–204.
Pierson, W.C. and Rodger, S.H. (1998). Web-based animation of data structures using JAWAA. SIGCSE Bulletin, 30:267–271.
Rajala, T., Laakso, M.-J., Kaila, E., and Salakoski, T. (2007). ViLLe – A language-independent program visualization tool. In Seventh Baltic Sea Conference on Computing Education Research (Koli Calling 2007), volume 88.
Rajala, T., Laakso, M.-J., Kaila, E., and Salakoski, T. (2008). Effectiveness of program visualization:a case study with the ViLLE tool. Journal of Information Technolo-gy Education 7:15–32.
Rodger, S.H. (2008). JFLAP Website. http://www.jflap.org.
Rodger, S.H., Wiebe, E., Lee, K.M., Morgan, C., Omar, K., and Su, J. (2009). Increasing engagement in automata theory with JFLAP. In Proceedings of the 40th ACM Technical Symposium on Computer Science Education, 403–407.
Ross, R. and Grinder, M. (2002). Hypertextbooks: Animated, active learning, compre-hensive teaching and learning resources for the web. In Diehl, S., editor, Software Visualization, Lecture Notes in Computer Science 2269, 269–284. Springer.
Rössling, G., Naps, T.L., et al. (2006). Merging interactive visualizations with hypertextbooks and course management. In Working Group Reports from ITiCSE’06 on Innovation and Technology in Computer Science Education, 166– 181.
Rossling, G., Schuler, M., and Freisleben, B. (2000). The ANIMAL algorithm animation tool. In Proceedings of the 5th Annual SIGCSE/SIGCUE ITiCSE Conference on Innovation and Technology in Computer Science Education, 37–40.
Sanders, D., Heeler, P., and Spradling, C. (2001). Introduction to BlueJ: A Java develop-ment environdevelop-ment. Journal of Computing Sciences in Colleges 16(3): 257-258. Shaffer, C.A., Akbar, M., Alon, A., Stewart, M., and Edwards, S.H. (2011). Getting
algo-rithm visualizations into the classroom. In Proceedings of the 42nd ACM Tech-nical Symposium on Computer Science Education (SIGCSE’11), 129–134.
Shaffer, C.A., Cooper, M., Alon, A., Akbar, M., Stewart, M., Ponce, S., and Edwards, S.H. (2010). Algorithm visualization: The state of the field. ACM Transactions on Computing Education, 10:1–22.
Shaffer, C.A., Naps, T.L., and Fouh, E. (2011). Truly interactive textbooks for Computer Science education. In Proceedings of the 6th Program Visualization Workshop, 97—103.
Stasko, J.T. (1990). Tango: A framework and system for algorithm animation. Computer, 23(9):27–39.
Stasko, J.T., Badre, A., and Lewis, C. (1993). Do algorithm animations assist learning? An empirical study and analysis. In Proceedings of the INTERACT ’93 and CHI ’93 Conference on Human Factors in Computing Systems, 61–66.
Stasko, J.T. (1997). Using student-built algorithm animations as learning aids. In Pro-ceedings of the 28th SIGCSE Technical Symposium on Computer Science Educa-tion, 25–29.
Stasko, J.T. (1998). JSamba. http:// www.cc.gatech.edu/gvu/softviz/algoanim/jsamba/. Stasko, J.T. (2001). Polka Animation System.
http://www.cc.gatech.edu/gvu/softviz/par-viz/polka.html.
Stern, L. (2001). Algorithms in Action Website
Figure 1. A TRAKLA2 exercise. The user selects where to place the next node in-to the tree by dragging the next value from the array in-to the tree. The pop-up window shows the student’s progress in terms of number of steps performed correctly.
Figure 2. An exercise from JHAVÉ-POP, part of the JHAVÉ visualization sys-tem. Students write small snippets of code that solve problems involving manipulating linked lists.
Figure 3. The ALVIS System. Users develop programs in a pseudocode language named SALSA. The program is then visualized in the ALVIS interface.
Figure 4. Screenshots from the Virginia Tech Hashing Tutorial. Users can browse the ta-ble of contents to select subsections of the tutorial. The applet in the upper right shows the results of entering some values using a simple hash function. The lower left illustrates an approach known as open hashing. The graph in the lower right shows the degradation in performance experienced by various methods as the hash table fills up.
Figure 5. Sample visualization from the ALVIE System: an animated tutorial of an algo-rithm to find the pair of points that are closest to each other from a collection of points. This is a fairly complex algorithm to understand.
Figure 6. Developing a 3-D visualization with Alice. Novice programmers can easily generate scenes with objects that operate under the control of scripts created with a visual programming language.
Figure 7. Interface of the Jeliot system. The program being visualized appears to the left. The various variables, their values, and their relationships are shown in a series of panes on the right side.
Figure 8. Ville system interface. Ville supports dynamic programming exercises, with a built-in runtime environment that permits students to visualize the execution of simple programs and get immediate feedback on whether their solutions are correct. Ville is ca-pable of asking (and automatically evaluating) relatively sophisticated programming-related questions.
Figure 9. Four visualizers from the jGrasp program visualization system. Each visualizer displays a synchronized graphic representation for the state of some program's objects and data structures. The upper-left visualizer shows elements from a one-dimensional ar-ray. The upper-right visualizer shows elements from a two-dimensional arar-ray. The lower-left visualizer shows an array of pointers, while the lower-right visualizer shows a more complex pointer-based structure.
Figure 10. The JFLAP interface, showing a simple three-state automata in the left pane. In the right pane, students can type input and see the result. This simple machine reverses the bitwise values of the input.