MPRA
Munich Personal RePEc Archive
The Governance Structures of Japanese
Credit Associations and Their Objective
Functions
Kazumine Kondo
19 March 2018
Online at
https://mpra.ub.uni-muenchen.de/85294/
The Governance Structures of Japanese Credit Associations
and Their Objective Functions
Kazumine Kondo
Faculty of Economics, Aichi Gakuin University, 3-1-1 Meijo, Kita-ku, Nagoya City, Aichi, 462-8739, Japan
kondo@dpc.agu.ac.jp
Abstract
Although Japanese credit associations are nonprofit cooperative financial institutions, they shoulder the same financial functions as regional banks that are stock companies and they could compete with each other in a regional market. On the other hand, governance structures of credit associations tend to make disciplines be weaker than those of regional banks and their performances might be better than regional banks for these reasons.
In the present paper, we empirically investigated whether the objective functions of credit associations are different from those of regional banks with considering the differences of their governance structures. As a result, although significant differences of profitability of these two types of institutions were not detected, it was also demonstrated that credit associations can capture more share of deposits than regional banks and the former are more conservative in risk taking than the latter. From these, there is a possibility that Japanese credit associations have different objective functions from regional banks.
Keywords: governance structures, objective functions, labor expenses, credit associations, regional banks
JEL Classification: G21
1. Introduction
Japanese credit associations were established for the purpose of mutual aid among members and are one of the nonprofit cooperative financial institutions. However, both credit associations and regional banks that are stock companies are classified to regional financial institutions, which are required to practice region-based relationship banking by the government, and financial functions that are shouldered by them in a region are almost the same. Thus, these two types of institutions could
compete with each other in a regional market1. However, cooperative financial institutions including
credit associations have received great preferential treatments such as the benefit in taxation from the government, which is different from regional banks.
In addition, the governance structures of credit associations are largely different from those of private banks that are stock companies because the qualifications of investors of them are restricted to regional members and voting right at the meetings such as a general meeting of representatives is provided that a member has one vote regardless of the amount of investment of a member. It is often pointed out that those governance structures of credit associations tend to make disciplines be weaker than those of private banks in Japan.
As we will survey in section 2, Allen and Gale (2000) mentioned while the objectives of commercial banks are profit maximization, nonprofit financial institutions that have different governance structures, i.e. weaker ones, act to maximize objective functions that incorporate labor expenses in ordinary profit function2. Granero and Reboredo (2005) revealed that this applies to Spanish financial
institutions, and savings banks can capture greater share of deposits and take less risks in their portfolio as a result of empirical analysis3. When we consider both the governance structures of credit
associations that tend to be weaker and the benefits they receive from the government as mentioned before, it cannot be perfectly denied that they have different objective functions from those of regional banks that are stock companies in Japan too.
Therefor, the purpose of the present paper is to demonstrate whether Japanese credit associations act to maximize the objective functions that are different from regional banks. Specifically, we empirically investigate the following; (1) Credit associations can obtain greater share of deposits than regional banks, (2) The former are more conservative in risk taking than the latter, and (3) The former raise higher profits than the latter.
The remainder of the present paper is organized as follows. In Section 2, we explain our analytical method. In Section 3, the data used in this study are surveyed. In Section 4, we present and discuss our empirical results. A summary and conclusion are provided in the final Section.
2. Methodology
Granero and Reboredo (2005) empirically analyzed whether the performances of savings banks and
1 Hesse and Čihák (2007) revealed that in systems with a high presence of cooperative banks, weak
commercial banks are less stable than they would be. Okuma (2017) concluded that cooperative financial institutions were more stable than regional commercial banks during the Global Financial Crisis in Japan.
2 Verbrugge and Jahera (1981), Akella and Greenbaum (1988) and Purroy and Salas (2000) analyzed
on the expense preference behavior.
3 García-Marco and Robles-Fernández (2008) examined risk behavior in commercial banks and
commercial banks in Spain are different, which is based on the theoretical model of Allen and Gale (2000). We also follow this theoretical framework. The outlines of it are as follows.
Bank A and bank B compete each other in a regional market. Bank A is a commercial bank whose objective is profit maximization and bank B is a cooperative bank whose corporate and governance structure is assumed to yield an organization in between a capitalist entity and a cooperative of workers. Bank A maximizes the following expected profit.
𝜋𝜋𝐴𝐴= 𝑝𝑝(𝑌𝑌𝐴𝐴)(𝑌𝑌𝐴𝐴𝐷𝐷𝐴𝐴− 𝑅𝑅(𝐷𝐷)𝐷𝐷𝐴𝐴− 𝑤𝑤𝐿𝐿𝐴𝐴) (1)
p(YA) is the profitability that bank A gets return YA, DA is the amount of deposit bank A holds, D is
the sum of the deposits in a regional market, i.e. D=DA+DB, R(D) is the opportunity cost of funds, w
is the wage, and LA is the volume of labor of bank A.
On the other hand, bank B maximizes the following objective function that includes labor expenses in equation (1)4.
𝑈𝑈𝐵𝐵= 𝜋𝜋𝐵𝐵+ 𝜃𝜃𝑝𝑝(𝑌𝑌𝐵𝐵)𝑤𝑤𝐿𝐿𝐵𝐵 (2)
θ is the (positive) expense preference parameter.
From the first-order conditions of equation (1) and (2), the followings can be said5.
(a) Cooperative financial institutions like bank B can receive more volume of deposits than commercial banks like bank A, i.e. DB>DA, and the former are more conservative on investing risk
assets that the latter, i.e. YA>YB.
(b) Cooperative financial institutions can obtain higher expected payoff level, i.e. UB>πA.
(c) When the expense preference parameter is not too large, expected profits of cooperative financial institutions are higher than those of commercial banks.
In the present paper, the following three equations are estimated as in Granero and Reboredo (2005) to test whether above from (a) to (c) are applied to Japanese regional financial institutions.
𝐷𝐷𝐷𝐷𝑝𝑝𝐷𝐷𝐷𝐷𝐷𝐷𝐷𝐷𝑖𝑖𝑖𝑖= 𝑐𝑐0+ 𝑐𝑐1𝐷𝐷𝐷𝐷𝐷𝐷𝐷𝐷𝐷𝐷𝑖𝑖𝑖𝑖+ 𝑐𝑐2𝐴𝐴𝐷𝐷𝐷𝐷𝐷𝐷𝐷𝐷𝑖𝑖𝑖𝑖+ 𝑐𝑐3𝑃𝑃𝑃𝑃𝐷𝐷𝑃𝑃𝐷𝐷𝐷𝐷𝑖𝑖𝑖𝑖 (3)
𝑅𝑅𝐷𝐷𝐷𝐷𝑅𝑅𝑖𝑖𝑖𝑖= 𝑐𝑐0+ 𝑐𝑐1𝐷𝐷𝐷𝐷𝐷𝐷𝐷𝐷𝐷𝐷𝑖𝑖𝑖𝑖+ 𝑐𝑐2𝐴𝐴𝐷𝐷𝐷𝐷𝐷𝐷𝐷𝐷𝑖𝑖𝑖𝑖+ 𝑐𝑐3𝑃𝑃𝑃𝑃𝐷𝐷𝑃𝑃𝐷𝐷𝐷𝐷𝑖𝑖𝑖𝑖 (4)
𝑃𝑃𝑃𝑃𝐷𝐷𝑃𝑃𝐷𝐷𝐷𝐷𝑖𝑖𝑖𝑖= 𝑐𝑐0+ 𝑐𝑐1𝐷𝐷𝐷𝐷𝐷𝐷𝐷𝐷𝐷𝐷𝑖𝑖𝑖𝑖+ 𝑐𝑐2𝐴𝐴𝐷𝐷𝐷𝐷𝐷𝐷𝐷𝐷𝑖𝑖𝑖𝑖 (5)
4 Fonteyne (2007) mentioned that a cooperative bank might resemble a worker cooperative rather than
a consumer cooperative.
Subscript i refers to i financial institution, and subscript t refers to year t. Deposit means whether a financial institution can obtain large amount of deposit and is calculated by dividing deposit by total asset. Risk is a proxy variable on the aggressiveness of financial institution’s risk taking and two measures are used. Risk1 is calculated by dividing loans and bills discounted by total asset and Risk2
is calculated by dividing stock by total asset. Profit is a profitability and ROA and ROE are used. ROA
is calculated by dividing current term net profit by total asset and ROE is calculated by dividing current term net profit by total net asset6.
Dummy is a dummy variable which takes a value of 1 when i financial institution is a credit association, while the dummy variable takes a value of 0 when it is a regional bank. Asset is a total asset and is a proxy for financial institution size. Asset is converted into a natural logarithm.
If objective functions of credit associations are different from those of regional banks and from (a) to (c) are applied to Japan too, the coefficients of Dummy in equation (3) and (5) will take positive signs and those in equation (4) will take negative signs.
3. Data
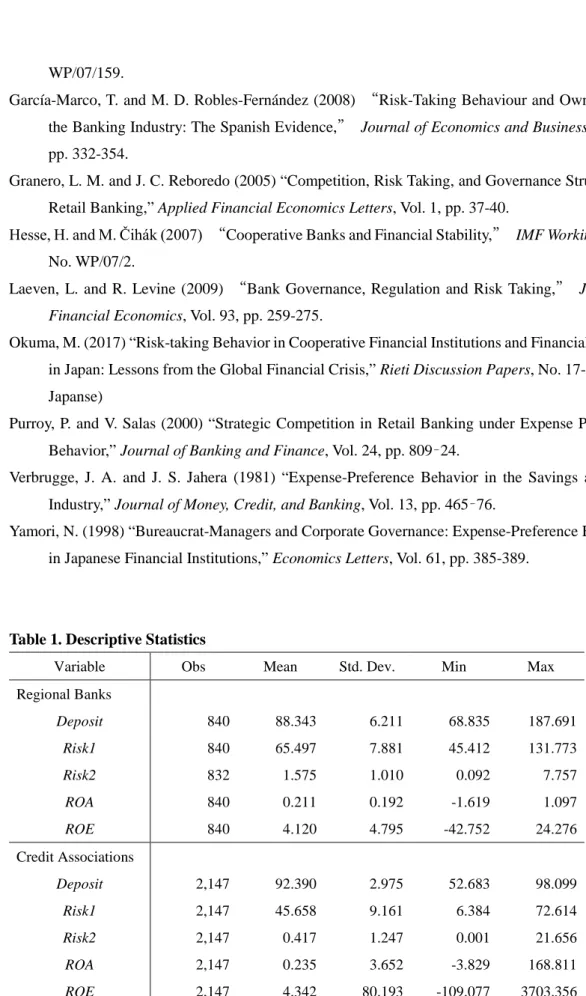
Table 1 shows the descriptive statistics of the dependent variables of estimation models from (3) to (5), which are separated into credit associations and regional banks.
Table 1. Descriptive Statistics
The mean of Deposit of credit associations is about 4% larger than regional banks. Credit associations can capture more share of deposits. Both of the mean of Risk1 and that of Risk2 of credit associations is about 20% for the former and is about 1.15% for the latter less than those of regional banks. In both lending and stock investment, it can be said that credit associations are more conservative in risk taking. The mean of ROA and that of ROE of credit associations is about 0.02 for the former and is about 0.2 for the latter larger than those of regional banks. In both ROA and ROE, credit associations can realize higher profitability although their differences are not too large. That is, when focusing on the means, all of the Deposit, Risk, and Profit satisfy from (a) to (c) in the former section. These will be tested by regression analyses in the next section.
The data used in the present paper are derived from Nikkei Needs. Data absent from Nikkei Needs were supplemented by “Analysis of Financial Statements of All Banks,” edited by the Japanese Bankers Association, and by “Financial Statements of All Credit Associations,” edited by the Consultant of Financial Books Co., Ltd.
4. Estimation Result
In this section, we discuss the estimation results for equations from (3) to (5). The estimation results for equations (3) and (4) are presented in Table 2. Standard errors are calculated as White heteroskedasticity-consistent errors.
Table 2. Estimation Results for Deposit and Risk
In the estimation results for Deposit, all of the coefficients of Dummy take significantly positive signs at the 1% levels. The fact that credit associations can gather more share of deposits than regional banks is also found here, which is the same tendency as in the means shown in the previous section. In addition, in the estimation results for Risk1 and Risk2, the coefficients of Dummy take significantly negative signs at the 1% levels in all cases. In both lending and stock investment, credit associations take less risks than regional banks. These are also consistent with the tendency of the means observed in the previous section7.
Next, the estimation results for equation (5) are shown in Table 3. These standard errors are also White heteroskedasticity-consistent errors.
Table 3. Estimation Results for Profit
In both of the estimation results for ROA and ROE, all of the coefficients of Dummy take positive signs but are insignificant. Although the tendencies that credit associations can raise a little larger profitability than regional banks were found on both of the mean of ROA and that of ROE in the previous section, significant differences are not detected here. Profit margins of interest rate have become much smaller due to the ultra-low interest rate policies taken by Bank of Japan for a long time. Therefore, profit rates of financial institutions have been lower as a whole and the differences of them among financial institutions have become smaller. It might be the reason for these results.
From these, although significant differences are not observed in profitability, it can be revealed that credit associations can receive deposits easier than regional banks and the former are more conservative in risk taking than the latter, which are consistent with theoretical predictions in Section 2. Thus, there is a possibility that Japanese credit associations also have the objective functions as in equation (2), which are different from those of regional banks, due to the special characteristics of
7 When we use cash and due from banks as a proxy for the degree of risk avoidance instead of Risk,
the coefficients of it take significantly positive signs at the 1% level. It can be said that credit associations are more conservative in risk taking from these too.
their governance structures.
5. Conclusion
Japanese cooperative financial institutions shoulder almost the same financial functions as regional banks in a region and they could compete with each other. On the other hand, the former are institutions for mutual aid among members and whose governance structures tend to make disciplines be weaker than those of regional banks8. Thus, there is a possibility that objective functions of them are different.
In the present paper, we pick up Japanese credit associations and empirically investigate whether the objective functions of them are different from the ordinary profit function.
Although the means of profit rates of credit associations are a little larger than those of regional banks, significant differences could not be detected by the regression analyses. This might reflect that the differences of profitability among financial institutions have been small due to the ultra-low interest rate policies that have been taken in Japan for a long time.
On the other hand, it was also revealed that credit associations can capture more share of deposits than regional banks and the former take less risks than the latter. These two points are consistent with theoretical predictions in the case that we assume that credit associations and regional banks have different objective functions.
Judging from these, there is a possibility that Japanese credit associations tend to maximize the objective functions that incorporate labor expenses in profit function as is demonstrated in foreign previous studies9. If governances of credit associations become stronger than now, objective functions
of them will be nearing those of regional banks and the benefits that credit associations can enjoy, which were revealed in the present paper, might be weaker. It might be necessary to reconsider what the governance structures of credit associations should be like as they and regional banks could compete with each other and they receive preferential treatments such as in taxation, which are different from regional banks.
References
Akella, S. R. and S. I. Greenbaum (1988) “Savings and Loan Ownership Structure and Expense Preference,” Journal of Banking and Finance, Vol. 12, pp. 419–37.
Allen, F. and D. Gale (2000) Comparing Financial Systems, MIT Press.
Fonteyne, W. (2007) “Cooperative Banks in Europe Policy Issues,” IMF Working Paper, No.
8 Laeven and Levine (2009) showed that the same regulation has different effects on bank risk taking
depending on the bank’s corporate governance structure.
9 Yamori (1998) found that Japanese credit associations employing bureaucrat-managers held more
WP/07/159.
García-Marco, T. and M. D. Robles-Fernández (2008) “Risk-Taking Behaviour and Ownership in the Banking Industry: The Spanish Evidence,” Journal of Economics and Business, Vol. 60, pp. 332-354.
Granero, L. M. and J. C. Reboredo (2005) “Competition, Risk Taking, and Governance Structures in Retail Banking,” Applied Financial Economics Letters, Vol. 1, pp. 37-40.
Hesse, H. and M. Čihák (2007) “Cooperative Banks and Financial Stability,” IMF Working Paper, No. WP/07/2.
Laeven, L. and R. Levine (2009) “Bank Governance, Regulation and Risk Taking,” Journal of Financial Economics, Vol. 93, pp. 259-275.
Okuma, M. (2017) “Risk-taking Behavior in Cooperative Financial Institutions and Financial Stability in Japan: Lessons from the Global Financial Crisis,” Rieti Discussion Papers, No. 17-J-064. (in Japanse)
Purroy, P. and V. Salas (2000) “Strategic Competition in Retail Banking under Expense Preference Behavior,” Journal of Banking and Finance, Vol. 24, pp. 809–24.
Verbrugge, J. A. and J. S. Jahera (1981) “Expense-Preference Behavior in the Savings and Loan Industry,” Journal of Money, Credit, and Banking, Vol. 13, pp. 465–76.
Yamori, N. (1998) “Bureaucrat-Managers and Corporate Governance: Expense-Preference Behaviors in Japanese Financial Institutions,” Economics Letters, Vol. 61, pp. 385-389.
Table 1. Descriptive Statistics
Variable Obs Mean Std. Dev. Min Max
Regional Banks Deposit 840 88.343 6.211 68.835 187.691 Risk1 840 65.497 7.881 45.412 131.773 Risk2 832 1.575 1.010 0.092 7.757 ROA 840 0.211 0.192 -1.619 1.097 ROE 840 4.120 4.795 -42.752 24.276 Credit Associations Deposit 2,147 92.390 2.975 52.683 98.099 Risk1 2,147 45.658 9.161 6.384 72.614 Risk2 2,147 0.417 1.247 0.001 21.656 ROA 2,147 0.235 3.652 -3.829 168.811 ROE 2,147 4.342 80.193 -109.077 3703.356
Table 2. Estimation Results for Deposit and Risk
(1) (2) (3) (4) (5) (6)
VARIABLES Deposit Deposit Risk1 Risk1 Risk2 Risk2
Dummy 0.025*** 0.025*** -0.201*** -0.201*** -0.009*** -0.009*** (7.183) (7.176) (-39.920) (-39.915) (-11.443) (-11.401) Asset -0.008*** -0.008*** -0.001 -0.001 0.001*** 0.001*** (-8.093) (-8.099) (-0.777) (-0.786) (5.437) (5.433) ROA -0.000 -0.000 0.000 (-0.633) (-0.459) (0.467) ROE 0.000 0.000** -0.000** (0.215) (2.531) (-2.117) Constant 1.001*** 1.001*** 0.676*** 0.676*** -0.004 -0.004 (64.681) (64.672) (24.936) (24.937) (-1.146) (-1.155) Observations 2,987 2,987 2,987 2,987 2,979 2,979 R-squared 0.189 0.189 0.506 0.506 0.171 0.171
Robust t-statistics in parentheses *** p<0.01, ** p<0.05, * p<0.1
Table 3. Estimation Results for Profit
(1) (2)
VARIABLES ROA ROE
Dummy 0.176 3.427 (1.190) (1.053) Asset 0.078** 1.633** (2.186) (2.092) Constant -0.924* -19.756* (-1.779) (-1.730) Observations 2,987 2,987 R-squared 0.001 0.001
Robust t-statistics in parentheses *** p<0.01, ** p<0.05, * p<0.1