Testing the Predictive Power of Altman’s Revised Z’ Model: The
Case of 10 Multinational Companies
Saed Ahmed Sulub
Honor Graduate of Accounting and Finance, School of Management Studies, University of Khartoum [email protected]
Tel: (249) 905097070 July, 2014
Abstract
The study aimed to investigate and test the predictive power of the Altman’s revised Z’ model in the case of multinational companies, and took a sample of 10 multinational companies for two years; 5 bankrupt companies, and 5 companies continue to work as of 2014.
The descriptive quantitative methodology has been followed in the study, and the data was obtained from the financial reports of the companies in the sample.
The study concludes that Edward Altman’s Z’ model for financial distress prediction is an accurate for the failed multinational companies at a predictive power of 70%, and for the non-failed at a predictive power of 55%.
Keywords: Altman’s Model, financial failure, Multinational Companies 1. Introduction
There is a huge need for financial failure prediction since the results of business bankruptcy lead to heavy losses and affect the national economy and the employment level. Enron case is one of the most famous bankruptcies that have taken place in all over the world. It represented a major corporate accounting scandal which paved the way to a lot of regulating acts in the United States and other countries.
The financial failure may take the form of bankruptcy or insolvency. Insolvency means that the company is unable to meet its current obligations when it is due, which happens when the current liabilities exceed the current assets. On the other hand, bankruptcy happens when the company’s current liabilities exceed the fair value of its assets (Mohammed & Soon, 2012)
However the importance of prior diagnosis of financial failure is becoming more important because of the increasing number of bankruptcies and the failure of big multinational corporations in the last two decades. The multinational companies are the most critical companies in the area of predicting financial failure due to the complexity of its operations, and multinational activities. Thus a model that could predict the financial failure of multinational company in time would be useful for lenders, customers, stockholders, different regulators and governments, managers, suppliers, employees, and other stakeholders.
Accurate business failure prediction models would be extremely valuable to many industry sectors, particularly financial investment and lending. The potential value of such models is emphasized by the extremely costly failure of high-profile companies in the recent past. Consequently, a significant interest has been generated in business failure prediction within academia as well as in the finance industry (Odipo and Sitati, 2008).
According to Alareeni & Branson (2013) most statistical failure prediction models have been developed for and tested in developed countries (e.g. the US and European countries). Amongst the most common statistical models are the Altman Z-Scores, which have been modified twice.
So in this paper we will focus on the case of 10 multinational companies to know if the Altman’s Z’ model can or can’t predict the financial failure or health of such companies, and the results will be valuable to investors, and add to the existing literature of this field.
The remainder of the paper is organized as follows: section two presents the literature review, section three explains the study methodology, section four provides and discusses the results, and finally section five concludes the paper.
2. Conceptual Framework and Literature Review
Business failure predictions involve developing models that attempt to predict financial failure of a business before it actually happen. According to Gep & Kumar (2012) there were early attempts to use financial ratios as a tool to predict financial failure of a business, the work of Patrick in 1932 was the earliest. This work was later extended by Beaver in 1966 and provided the first statistical model for business failure prediction. He used a univariate model, and a set of 30 financial ratios tested on 79 failed businesses and 79 similar successful businesses between 1954 and 1964. He then established from the analysis the financial ratios with the greatest predictive power, but the beaver’s univariate approach didn’t contain an overall index to measure financial distress, which led a problem that different ratios made conflicting predictions about a given business, as well as that one ratio only can’t make a real prediction of business financial failure. However the work of Beaver in
Research Journal of Finance and Accounting www.iiste.org ISSN 2222-1697 (Paper) ISSN 2222-2847 (Online)
Vol.5, No.21, 2014
1966 was a pioneering one which paved the way to the development of statistical models for financial failure prediction. In 1972 Deakin utilized the same 14 variables that Beaver analyzed, but applied them within a series of multivariate discriminant models. Although the prior works established certain important generalizations regarding the performance and trends of particular measurements, the adaptation of the results for assessing potential bankruptcy of firms, both theoretically and practically, was questionable because the methodology was essentially univariate in nature and emphasis was placed on individual signals of impending problems (Altman, 2000). For this problem, Altman constructed his model in 1968 using multiple discriminant analysis on a sample composed of 66 corporations, 33 in each of the two groups-bankrupt and successful businesses-. At first, Altman included 22 ratios in his model, and then he reduced it to the most five important financial ratios. And after his analysis he got the following formula known as Z score model, which is used often for companies listed at the capital market=
Z = 1.2X1+1.4X2+3.3X3+0.6X4+1.0X5 (1) Where:
X1 - working capital / total assets, X2 - retained earnings / total assets,
X3 – earnings before interest and Tax / total assets,
X4 - market value of owner´s equity /book value of total liabilities, X5 - sales / total assets.
If the score is above 2.99, the firm is healthy. If it is below 1.81, the firm is viewed as failing business, when values ranging from 1.81 to 2.99, it represent the so-called grey area, when there is no clear prediction about financial failure.
After publishing the original Z score, a discussion was evoked between academicians and practitioners about how this model could be used for “non-stock companies” so in 1977 Altman modified the original Z score to suit such like these companies. The modification led to an overall reevaluation and changing the market value of owner’s equity in X4 with the book value of owner’s equity. The model took the following formula:
Z’ =0.717X1+ 0.847X2+ 3.107X3+ 0.420X4+ 0.998X5 (2)
Classification zones of the model also changed. If the score is above 2.9, the company is healthy. If it is below 1.23, the company regarded as going bankrupt. Values from 1.23 to 2.9 represent the so-called grey area, where there is no clear prediction.
The next modification of the Z score model analyzed the characteristics and accuracy of a model without X1 -sales/ total assets, to minimize the potential industry effect which is more likely to take place when such an industry-sensitive variable as asset turnover is included. And this model was formed in response to requests for a measure to predict the likelihood of bankruptcy for manufacturing firms. The new Z model for non-manufacturing firms took the following form:
Z’’ =6.56x1+3.26x2+6.72x3+1.05x4 (3)
Where:
X1= (current assets – current liabilities) / total assets X2= retained earnings / total assets
X3= earnings before interest and taxes / total assets X4= book value of equity / total liabilities
In this model, scores of 2.6 and greater indicate that the firm in a safe zone, and below 1.1 indicate to the distress zone, and the values ranging from 1.1 to 2.6 represent the grey zone where there is no clear prediction.
The research and study of financial failure prediction can be classified into three broad categories:
• The 1st research field: Building statistical prediction models and it often gives an overall index which can be used to measure the probability of failure, such as the study of: Beaver (1960); Altman (1968); Christidis & Gregory (2010); Zeytunoglu & Akarim (2013).
• The 2nd field: evaluating and assessing the validity and the predictive power of pre-developed models
like the work of: Kidane (2004); Onyeiwu (2009) Kpodof (2009); Wang & Campbell (2010); Mamo (2011); Kiyak & Labanauskaite (2012); Soon et al. (2014).
• The 3rd field: an applied studies and researches, which aims to know the failure position of certain companies in a country, and it is closer to an article more than a research paper, like the study of: Azadinamin (2012); Mohammed & Soon (2012); Kenneth & Adeniyi (2014).
This study is closer to the 2nd research field, where it seeks to apply Altman’s revised model on failed and successful Multinational companies, to know the prediction power of Altman’s Z’ model.
Kidane (2004) examined the applicability of Altman and Springate models in predicting financial distress in IT and service companies of South Africa from 1999 to 2003, and the results reported that both of the two models failed to predict failure and non-failure amongst South African service and information technology sample companies.
Odipo & Sitati (2008) assessed whether Altman’s financial distress prediction model could be useful in predicting business failure in Kenya using a sample 10 firms that continue to be listed and 10 firms that were delisted in Nairobi Stock Exchange during the period from 1989 to 2008, the study concluded that the model could accurately predict financial failure in Kenya.
Kpodoh (2009) tested the Altman’s Z score prediction model using sample data from the mobile communication industry in Ghana. His findings confirmed the strength and ability of the Z score model in predicting eminent business failure, as it predicted the distress positions of the case companies.
Onyeiwu (2009) applied Altman’s Z score model to investigate its ability to discriminate between healthy and unhealthy organizations in the Nigerian manufacturing industry in the period between 2005 and 2009, and concluded that Altman’s model can successfully predict and classify between failure and non-failure companies. Charles & Goodluck (2009) applied a multivariate technique using Altman’s Z model to investigate the predictive power of the model and discriminate between failure and healthy companies in the Nigerian financial sector for the year 2009, and the results of the study indicate that Altman’s model could actually predict financial failure of banks in Nigeria.
Moghadem et al. (2010) tested the prediction power of original Altman and Ohlson models on Iranian listed companies in the period of 1998 to 2005, and concluded that both Altman and Ohlson original models can predict bankruptcy issue of Iranian listed companies.
Hayes et al. (2010) tested the applicability of the Z score and apply to 17 failed and non-failed US retail companies in 2007 and 2008, and concluded that Altman’s Z score accurately predicted most of the bankruptcies.
Johansson & Kumbaro (2011) performed multiple discriminant analysis on a sample of 45 Americans filing for bankruptcy between 2007 and 2010 by applying the Z score and Z’’ score models, and concluded that the models could predict bankrupt firms both one and two reporting periods prior to bankruptcy.
Mohammed & Soon (2012) used the Altman’s financial distress prediction model and current ratio to assess financial situation of 44 companies listed in the Malaysia Stock Exchange for 2008 and 2009, and concluded that Altman’s model and current ratio are useful tools for investor to predict financial failure of companies.
Alareeni & Branson (2013) conducted a study on 71 failed and 71 non failed companies in Jordan to test the predictive power of Altman’s model for the period between 1989 and 2008, and concluded that the model still works effectively and could predict failed industrial companies. However, for service companies, they found that the Altman models could not provide indicators to differentiate between failed and non-failed companies. Soon et al. (2014) used Altman’s financial distress model to predict the financial hardship of 28 companies listed on trading services sector at the stock exchange of Malaysia for the period between 2003 and 2009, and concluded that Altman’s score can be used to differentiate between failure companies and the non-failure, and that its useful for investors to predict financial failure of companies.
From the literature above, the researcher has observed that there is lack of concentration on the case of multinational companies; where the situation may be different from ordinal cases because of the business complexity, and took a sample of 10 companies –failed and non-failed- to examine the applicability of Altman’s Z’ model to such companies and its predictive power.
3. Method
3.1 Study sample and the selection criterion
Since there is a huge number of multinational corporations in all over the world, the process of taking all these companies in a sample for study would be impossible, so the researcher has taken a sample of 10 companies distributed to two groups (5 failed and 5 healthy multinational companies) for two years, which means 10 observations in each group. And they were chosen randomly depending on the following criteria:-
• In the case of the failed companies, the multinational company should be filed for bankruptcy recently
from the period between 2001 and 2012.
• The assets of the multinational company for the last reporting period should be more than$ one billion
to take it in the sample.
• In the case of failed companies, the financial statements of the last two years prior to the bankruptcy should be available and accessible, so all the companies in this group belong to USA, because of the data availability.
• In the case of health companies, the financial statements of the last two reporting periods should be available on web.
3.2 Study method and Altman’s model variables
The study has followed the descriptive quantitative method by applying Altman’s model to the multinational companies’ sample of study. And the data was extracted from its financial statements for two years prior to its bankruptcy or to the current fiscal year relative to the non failed group. From the data, the ratios composed of Altman’s modified model in the formula (2) were calculated. The model consists of five independent variables,
Research Journal of Finance and Accounting www.iiste.org ISSN 2222-1697 (Paper) ISSN 2222-2847 (Online)
Vol.5, No.21, 2014
which was developed in 1968 and modified in 1977 by Altman to suit the unlisted companies that its market value can’t be accurately determined; the ratios are (Soon et al. 2014):
• Working capital/ Total assets (X1): it measures the liquid assets in relation to the size of the company.
• Retained earnings/ Total assets (X2): measures profitability that reflects the company’s age and earning power.
• Earnings before interest and tax/ Total assets (X3): measures operating efficiency apart from tax and leveraging factors (interest), it recognizes operating earnings as being important to long-term viability.
• Book value of equity/ Book value of liabilities (X4): it measures the ratio of equity comparing to total debts or liabilities.
• Sales/ Total assets (X5): it measures revenue generating power of a company’ assets (Assets Turnover).
3.3 Study hypotheses
All the studies been stated in the literature -like Odipo & Sitati (2008); Kpodoh (2009); Onyeiwu (2009); Alareeni & Branson (2013); Soon et al. (2014)- have proved that Altman’s model can successfully predict companies’ financial failure, particularly two years prior to the bankruptcy for the failed companies with very high level of accuracy. According to this, the hypotheses of the study can be stated as follows:
H1: Altman’s modified Z’ model can accurately predict the financial failure of the multinational companies; sample of the study.
H2: Altman’s modified Z’ model can accurately predict the financial health of the multinational companies; sample of the study.
3.4 Analysis method
Computations have been made using SPSS and Excel programs.
Descriptive statistics of the model variables for each of the two groups under the study have been provided.
Pearson correlation matrix has been computed, to see the significance of each variable on the Z score. Z score values were computed for each company for two years, and an overall index has been used to calculate the predictive power for both of the two groups (the failed group, and the non-failed group).
3.5 The illustrative graph of the model
Graph 1 below illustrates the model (Altman 1977) and the classification zones: Figure 1: The conceptualization
graph of Altman’s Z score
3.6 Predictive Power Calculation
The researcher has used the following formula to calculate the predictive power of the model: The Predictive Power = TCA ÷ NO
Where: TCA: Total correct attempts to predict the status using Z’ model NO: Number of observations
4. Results & Analyses
4.1 Descriptive Statistics
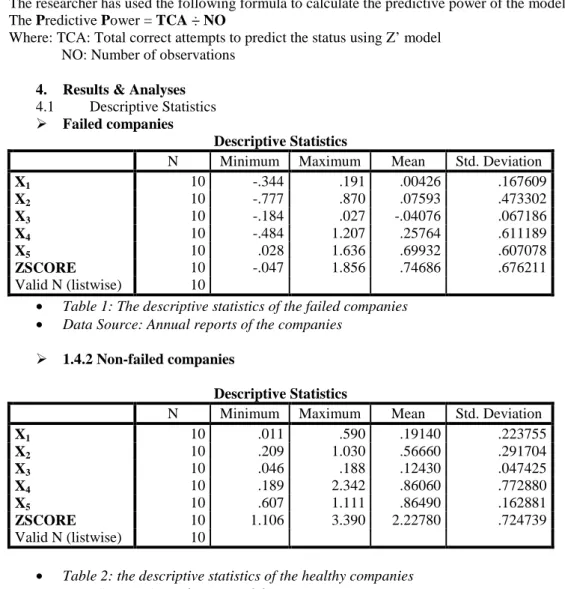
Failed companies
Descriptive Statistics
N Minimum Maximum Mean Std. Deviation
X1 10 -.344 .191 .00426 .167609 X2 10 -.777 .870 .07593 .473302 X3 10 -.184 .027 -.04076 .067186 X4 10 -.484 1.207 .25764 .611189 X5 10 .028 1.636 .69932 .607078 ZSCORE 10 -.047 1.856 .74686 .676211 Valid N (listwise) 10
• Table 1: The descriptive statistics of the failed companies
• Data Source: Annual reports of the companies
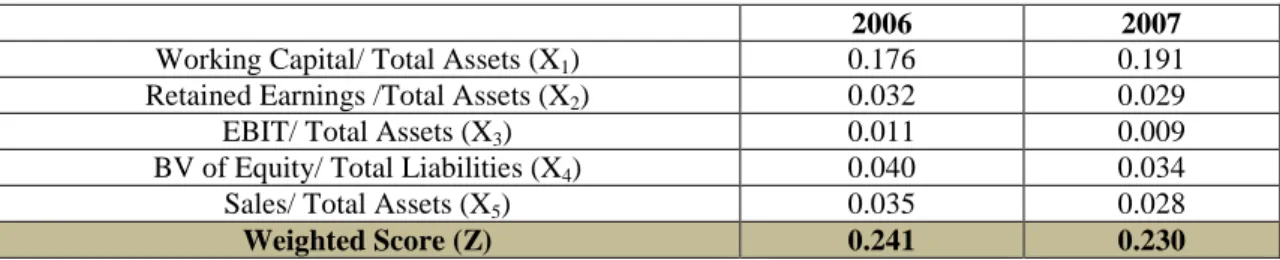
1.4.2 Non-failed companies
Descriptive Statistics
N Minimum Maximum Mean Std. Deviation
X1 10 .011 .590 .19140 .223755 X2 10 .209 1.030 .56660 .291704 X3 10 .046 .188 .12430 .047425 X4 10 .189 2.342 .86060 .772880 X5 10 .607 1.111 .86490 .162881 ZSCORE 10 1.106 3.390 2.22780 .724739 Valid N (listwise) 10
• Table 2: the descriptive statistics of the healthy companies
• Data Source: Annual reports of the companies
From table 1 above, for the two years, the first variable (x1) has an average of 0.04% with standard deviation of 17%, the second variable (x2) has an average of 7% with standard deviation of 47%, the third variable (x3) has an average of -4% with standard deviation of 6.7%, the fourth variable (x4) has an average of 26% with standard deviation of 61%, where the last independent variable (x5) has an average of 70% with standard deviation of 61%. The dependent variable (Z) has an average of 0.75 with standard deviation of 68%.
Table 2 shows the descriptive statistics of the non-failed companies. The first independent variable (x1) for the two years has an average of 1.19 with standard deviation 22%, the others x2, x3, x4, x5 have averages of 57%, 12%, 86%, 86.4% and standard deviations of 29%, 4.7%, 77%, 16% respectively. The dependent variable (Z) has an average of 2.23 with standard deviation 72%.
Research Journal of Finance and Accounting www.iiste.org ISSN 2222-1697 (Paper) ISSN 2222-2847 (Online)
Vol.5, No.21, 2014
4.2 Pearson Correlation Matrix
Correlations X1 X2 X3 X4 X5 ZSCORE X1 Pearson Correlation 1 Sig. (2-tailed) N 20 X2 Pearson Correlation .439 1 Sig. (2-tailed) .053 N 20 20 X3 Pearson Correlation .516* .723** 1 Sig. (2-tailed) .020 .000 N 20 20 20 X4 Pearson Correlation .450* .206 .522* 1 Sig. (2-tailed) .047 .383 .018 N 20 20 20 20 X5 Pearson Correlation -.085 .144 -.039 -.099 1 Sig. (2-tailed) .721 .545 .870 .676 N 20 20 20 20 20 ZSCORE Pearson Correlation .579** .795** .806** .572** .430*** 1 Sig. (2-tailed) .008 .000 .000 .008 .058 N 20 20 20 20 20 20 *, **,***
Correlation is significant at the 0.05, 0.01, 0.1 levels.
• Table 3: the correlation matrix of the model variables
From table 3, we observe that all the independent variables of the model are significant correlated with the dependent variable (Z), this assures the appropriateness and reliability of Altman’s modified model (1977), which means that the five variables taken are important factors which represent the changes in Z.
4.3 Z model Analyses 4.3.1 Failed companies
Appendix A gives brief definition for the companies taken in the sample as failed companies.
• United Airlines Corporation (UAL)
2000 2001
Working Capital/ Total Assets (X1) -0.071 -0.118
Retained Earnings /Total Assets (X2) 0.082 -0.008
EBIT/ Total Assets (X3) 0.027 -0.120
BV of Equity/ Total Liabilities (X4) 1.083 0.566
Sales/ Total Assets (X5) 0.079 0.640
Weighted Score (Z) 1.350 0.414
• Table 4: Z score computation of UAL
From table 4 above, we see that Altman’s revised model has failed to predict the financial failure before two years from the UAL bankruptcy; where the computed Z score for the year 2000 was 1.35 and it ranks in the grey area of the cutoff discrimination points demonstrated in figure 1 (1.23<Z<2.9), however the model could accurately predict the financial failure of UAL corporation before one year from the bankruptcy; where the computed score was 0.414 and it is below 1.23, which means that the company was on edge of bankruptcy at the end of 2001.
• Global Crossings
1999 2000
Working Capital/ Total Assets (X1) 0.053 -0.049
Retained Earnings /Total Assets (X2) 0.000 0.000
EBIT/ Total Assets (X3) 0.006 -0.048
BV of Equity/ Total Liabilities (X4) 1.207 0.814
Sales/ Total Assets (X5) 0.078 0.126
Weighted Score (Z) 0.641 0.282
As it is clear from Table 5, the Altman’s modified model used in the study could accurately predict the failure of Global Crossings company, where the result of Z for the two years before the bankruptcy -1999 and 2000- shows that the values rank under the cutoff point (Z<1.23), which means that the model could successfully classify the company.
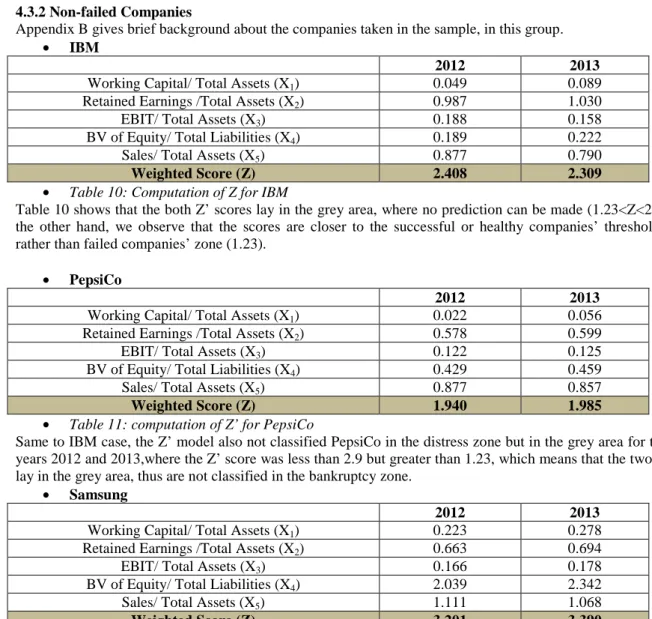
• Lehman Brothers Inc.
2006 2007
Working Capital/ Total Assets (X1) 0.176 0.191
Retained Earnings /Total Assets (X2) 0.032 0.029
EBIT/ Total Assets (X3) 0.011 0.009
BV of Equity/ Total Liabilities (X4) 0.040 0.034
Sales/ Total Assets (X5) 0.035 0.028
Weighted Score (Z) 0.241 0.230
• Table 6: Lehman Brothers’ Z score computation
Table 6 above shows the ratios composed the Z score for Lehman Brothers and its computed score according to formula 2. For both of the two years -2006 and 2007-, the model predicted accurately the failure of the company, because the two values showed scores under the cutoff point to regard the company in the distress zone (Z<1.23).
• General Motors (old GM)
2007 2008
Working Capital/ Total Assets (X1) -0.068 -0.344
Retained Earnings /Total Assets (X2) -0.265 -0.777
EBIT/ Total Assets (X3) -0.038 -0.184
BV of Equity/ Total Liabilities (X4) -0.201 -0.484
Sales/ Total Assets (X5) 1.217 1.636
Weighted Score (Z) 0.739 -0.047
• Table 7: computation of Z score for GM
From table 7 above, the case of general Motors also has been predicted successfully by Altman’s Z score shown in formula 2. The 2007 and 2008 scores were 0.739 and -0.047 respectively, and the two values are much lower than the distress cutoff point (Z<1.23). So the model classified the company as bankrupt for the two years prior to the bankruptcy.
• Kodak Company
2010 2011
Working Capital/ Total Assets (X1) 0.155 0.118
Retained Earnings /Total Assets (X2) 0.796 0.870
EBIT/ Total Assets (X3) -0.005 -0.066
BV of Equity/ Total Liabilities (X4) -0.147 -0.335
Sales/ Total Assets (X5) 1.152 1.287
Weighted Score (Z) 1.856 1.761
• Table 8: computation of Z score for Kodak
In the case of Kodak, the results are different from other failed companies. The Z scores for 2010 and 2011 are classified in the grey area where no clear prediction can be made (1.23<Z<2.9). So the Altman’s revised model in formula 2 has failed to predict the bankruptcy of Kodak Company.
Testing the first Hypothesis
Table 9 below summarizes the Z scores of the failed companies in the sample:
Z SCORE Company
One year before bankruptcy
Two years before bankruptcy United Airlines 0.414 1.350 Global Crossings 0.282 0.641 Lehman Brothers 0.230 0.241 General Motors -0.047 0.739 Kodak Company 1.761 1.856 Average 0.528 0.966 Overall Index 0.747 (Z<1.23)
Research Journal of Finance and Accounting www.iiste.org ISSN 2222-1697 (Paper) ISSN 2222-2847 (Online)
Vol.5, No.21, 2014
Table 9 above gives the overall evaluation of the model for each and both of the two years before bankruptcy. The first average value of Z score for the year before bankruptcy is 0.528, whereas the average value of Z before two years from bankruptcy is 0.966. And each of the values demonstrates that the model can accurately predict the failure of the companies in the sample before it happen.
According to the overall index (0.747) we can deduct that Altman’s model can accurately give a good indicator that the company on the brink of bankruptcy, so we accept the first hypothesis which states “Altman’s modified Z’ model can accurately predict the financial failure of the multinational companies; sample of the study”
• Measuring the Predictive Power of the model in the case of failed companies
The Predictive Power = TCA ÷ NO =7÷10= 70%
The researcher used this approach to calculate the predictive power of the model, by giving 1 if the model classified the company in the distress zone and 0 if not. The formula results 70%, which means that Altman’s revised Z’ model can predict 70% of the multinational bankruptcies before it happen according to the sample of study.
4.3.2 Non-failed Companies
Appendix B gives brief background about the companies taken in the sample, in this group.
• IBM
2012 2013
Working Capital/ Total Assets (X1) 0.049 0.089
Retained Earnings /Total Assets (X2) 0.987 1.030
EBIT/ Total Assets (X3) 0.188 0.158
BV of Equity/ Total Liabilities (X4) 0.189 0.222
Sales/ Total Assets (X5) 0.877 0.790
Weighted Score (Z) 2.408 2.309
• Table 10: Computation of Z for IBM
Table 10 shows that the both Z’ scores lay in the grey area, where no prediction can be made (1.23<Z<2.9). On the other hand, we observe that the scores are closer to the successful or healthy companies’ threshold (2.9) rather than failed companies’ zone (1.23).
• PepsiCo
2012 2013
Working Capital/ Total Assets (X1) 0.022 0.056
Retained Earnings /Total Assets (X2) 0.578 0.599
EBIT/ Total Assets (X3) 0.122 0.125
BV of Equity/ Total Liabilities (X4) 0.429 0.459
Sales/ Total Assets (X5) 0.877 0.857
Weighted Score (Z) 1.940 1.985
• Table 11: computation of Z’ for PepsiCo
Same to IBM case, the Z’ model also not classified PepsiCo in the distress zone but in the grey area for the two years 2012 and 2013,where the Z’ score was less than 2.9 but greater than 1.23, which means that the two values lay in the grey area, thus are not classified in the bankruptcy zone.
• Samsung
2012 2013
Working Capital/ Total Assets (X1) 0.223 0.278
Retained Earnings /Total Assets (X2) 0.663 0.694
EBIT/ Total Assets (X3) 0.166 0.178
BV of Equity/ Total Liabilities (X4) 2.039 2.342
Sales/ Total Assets (X5) 1.111 1.068
Weighted Score (Z) 3.201 3.390
• Table 12: computation of Z’ score for Samsung
The model predicted the financial health of Samsung, where the two values 3.20 and 3.39 respectively for 2012 and 2013 lay in the safe zone area (Z>2.9).
• Volkswagen
2012 2013
Working Capital/ Total Assets (X1) 0.022 0.011
Retained Earnings /Total Assets (X2) 0.209 0.223
EBIT/ Total Assets (X3) 0.091 0.046
BV of Equity/ Total Liabilities (X4) 0.360 0.384
Sales/ Total Assets (X5) 0.623 0.607
Weighted Score (Z) 1.248 1.106
• Table 13: computation of Z’ score for Volkswagen
As shown in table 13 above, the model predicted that Volkswagen is not failed but in the grey area for 2012, but classified the company in the distress area in 2013 (Z<1.23).
In addition, the 2012 Z’ value is so closer to the distress zone rather than the grey zone. So we can induct that Z’ model has failed to classify the company correctly.
• Toshiba
2012 2013
Working Capital/ Total Assets (X1) 0.572 0.590
Retained Earnings /Total Assets (X2) 0.328 0.355
EBIT/ Total Assets (X3) 0.082 0.087
BV of Equity/ Total Liabilities (X4) 1.055 1.127
Sales/ Total Assets (X5) 0.920 0.919
Weighted Score (Z) 2.305 2.384
• Table 14: computation of Z’ for Toshiba
Table 14 above shows that the Toshiba doesn’t lie in the distress zone, but classifies Toshiba in the grey area rather than the safe zone, where Z’ scores for the two years 2012 and 2013 are less than 2.9 (safe zone) and greater than 1.23 (distress zone).
Testing the Second Hypothesis
The researcher has used the same formula mentioned above to calculate the predictive power of the model, but in this case by giving 1 if the company was classified in the safe zone, 0.5 if in the grey area –because of the uncertainty about the companies’ future-, and 0 if classified in the distress zone.
We have only two observations classified in the safe zone (the case of Samsung), seven classified in the grey area, and only one observation classified in the distress zone (Volkswagen for 2013).
Predictive Power= TCA ÷ NO = 5.5÷10= 55%.
We see that there is a low accuracy for the model in the case of the non failed companies, so in order to accept the second hypothesis which states “Altman’s modified Z’ model can accurately predict the financial health of the multinational companies; sample of the study” it needs further research and taking a sample greater than the one used in this study. However, we can accept the hypothesis at a validity degree of 55%.
5. Concluding Remarks
The study has investigated the predictive power of applying Altman’s Z’ model to the multinational companies, and taken a sample of 10 companies selected randomly and distributed equally to two groups; failed and non-failed companies.
Edward Altman’s Z’ model for financial distress prediction was found to be an accurate for the failed multinational companies at a predictive power of 70%, and for the non-failed at a predictive power of 55%.
Limitations and Opportunities to Future Research
- The study has been conducted only on 10 multinational companies, so the little sample may restrict the
generalization of the results; thus future research will be useful to expand the sample size.
- The study results a low predictive power in the case of the non failed companies, this may be interpreted that Altman’s other models than Z’ can be more appropriate to this group, thus future research is needed to study the power of these models (original Z, and Z’’ Models) in the case of the multinational companies.
References
[1] Altman, Edward I. (2000) predicting financial distress of companies: revisiting the Z-score and Zeta models, New York University
[2] Alareeni, Bahaaeddin & Branson, Joel (2013) predicting listed companies’ failure in Jordan using altman models: a case study, International Journal of Business and Management, Vol. 8, No 1
Research Journal of Finance and Accounting www.iiste.org ISSN 2222-1697 (Paper) ISSN 2222-2847 (Online)
Vol.5, No.21, 2014
[3] Azadinamin, Amirsaleh (2012) The predictability of Enron’s bankruptcy: analyzing financial statements 5 years prior to the bankruptcy using Altman’s Z-score, Swiss Management Center University
[4] Charles, Onyeiwu & Goodluck, Aliemeke (2009) Financial ratios and the state of health of Nigerian banks, University of Lagos
[5] Chouhan, Vineet, Chandra, Bibhas, Gowsami, Shubham (2014) Predicting financial stability of select BSE companies revisiting Altman Z score, ILSHS, Vol.15, No 2
[6] Christids, Angela Chih-Ying & Gregory, Alan (2010) Some new models for financial distress prediction n the UK, University of Exeter Business school
[7] Gepp, Adrian & Kumar, Kuldeep (2012) Business failure prediction using statistical techniques: A review, business papers, faculty of Business, Bond University
[8] Johansson, Therese & Kumbaro, Jonna (2011) Predicting corporate default- an assessment of the Z score model on the U.S. market 2007-2010, school of economics and management, Lund University
[9] Hayes, Suzanne, Hodge, Kay and Hughes, Larry W. (2010) A study of the efficacy of Altman’S Z to predict bankruptcy of specialty retail firms doing business in contemporary times, Economic & Business Journal: Inquires & Perspectives, Volume 3, No 1
[10] Kenneth, U. Okaro & Adeniyi, Afolabi M. (2014) Prediction of bank failure using camel and market information: Comparative Appraisal of some banks in Nigeria, IISTE, Vol.5, No.3
[11] Kidane, H. Woldemichael (2004) Predicting financial distress in IT and services companies in South Africa, MA thesis, Department of Business Management, University of Free State, South Africa
[12] Kiyak, Deimena & Labanuaskaite, Daiva (2012) Assessment of the practical application of corporate bankruptcy prediction models, Economics and Management Journal, Vol.17, No. 17
[13] Kpodoh, Bright (2009) Bankruptcy and financial distress prediction in the mobile telecom industry in Ghana, MA thesis, School of Management, Blekinge Institute of Technology
[14] Mamo, Abudo Qonchoro (2011) Applicability of Altman (1968) model in predicting financial distress of commercial banks in Kenya, MA thesis, School of business, University of Nairobi
[15] Mohammed, Ali Abusalah & Ng Kim-soon (2012) Using Altman’s model and current ratio to assess the financial status of companies quoted in the Malaysian Stock Exchange, IJSRP, Vol.2, issue 7
[16] Moghadam, A. Ghadiri, Zadeh, F. Nasir, Fard, M.Masoud (2010) Review of the prediction power of Altman and Ohlson models in predicting bankruptcy of listed companies in Tehran Stock Exchange, Ferdowsi University of Mashhad.
[17] Odipo, M.k & Sitati,A. (2008) Evaluation of applicability of Altman’s revised model in prediction of financial distress: a case of companies quoted in the Nairobi Stock Exchange.
[18] Onyeiwu, Charles (2009) Financial statement as instrument for predicting corporate health in Nigera, University of Lagos
[19] Pitrová, Kateřina (2011) Possibilities of the Altman Zeta Model application to Czech Firms, Ekonomika A Management, Strana 67, 3
[20] Pradhan, Roil (2011) Prediction of Z score for private sector banking firms, International Referred Research Journal, Vol.2, Issue 22
[20] Soon, Ng Kim, Mohammed, A. Abusalah, and Mostafa, M. Rahil (2014) Using Altman's Z-Score Model to Predict the Financial Hardship of Companies Listed In the Trading Services Sector of Malaysian Stock Exchange. Aust. J. Basic & Appl. Sci., 8(6): 379-384
[21] Wang, Ying & Campbell, Michael (2010) Financial ratios and the prediction of bankruptcy: the ohlson model applied to Chinese publicly traded companies, the Journal of organizational leadership & business [22] Zeytmoglu, Emin & Akarun, Yasemin Deniz (2013) Financial failure prediction using financial ratios: an empirical application on Istanbul Stock Exchange, Journal of Applied Finance & Banking, Vol.3, No,3
• Internet Sources
o Companies’ websites on the internet
o www.wikepedia.com
o www.gurofocus.com
Appendix A: The failed companies in the sample
UAL CORPORATION was a multinational airline company and one of the world's largest air carriers. On Dec.
9, UAL and its subsidiaries filed for Chapter 11 reorganization in USA. It was announced on May 3, 2010 that UAL Corporation and Continental Airlines, Inc. would pursue a merger pending government approval. UAL Corporation would acquire Continental Airlines, Inc. and change its name to United Continental Holdings, Inc. (UCH). On October 1, 2010, UCH, formerly UAL Corporation, announced completion of the merger, and now the company works under the name United Continental Holdings Inc.
Global Crossings was a telecommunications company that provided computer networking services, its core
network delivered services to more than 700 cities in more than 70 countries. Global Crossing's stock price had fallen to $5 by November 2001, and in January 2002 the company filed for Chapter 11 bankruptcy protection in USA.
Lehman Brothers Holdings Inc. was a global financial services firm and the fourth-largest investment bank in
the USA. On September 15, 2008, the firm filed for Chapter 11 bankruptcy protection.
General Motors Company, commonly known as GM, is an American multinational corporation headquartered
in Detroit, Michigan; that designs, manufactures, markets and distributes vehicles and vehicle parts and sells financial services, GM filed for Chapter 11 bankruptcy in June 2009, following the recession of 2008–2009 and a failure to obtain government loans, In 2009, General Motors emerged from a government-backed Chapter 11 reorganization, and currently the company works under the name new General Motors after the reorganization.
Eastman Kodak Company is an American technology company focused on imaging solutions and services for
businesses. Kodak filed for Chapter 11 bankruptcy protection in the United States District Court for the Southern District of New York
Appendix B: The non-failed companies in the sample
IBM is an American multinational technology and consulting corporation, it manufactures and markets
computer hardware and software in a wide range of the world.
PepsiCo Inc. is an American multinational food and beverage corporation headquartered in Purchase, New
York, United States, with interests in the manufacturing, marketing and distribution of grain-based snack foods, beverages, and other products.
Volkswagen is a German multinational automotive company headquartered in Wolfsburg, Lower Saxony,
Germany.
Samsung Electronics Co., Ltd. Is a South Korean multinational electronics company headquartered in Suwon,
South Korea.
Toyota Motor Corporation is a multinational Japanese automotive manufacturer headquartered in Toyota,