Working Paper Series
#2007-022
Knowledge Flows, Patent Citations and the Impact of
Science on Technology
Knowledge Flows, Patent Citations and the Impact of
Science on Technology
Önder Nomaler & Bart Verspagen Eindhoven University of Technology [email protected], [email protected]
June 2007
Abstract
Technological innovation depends on knowledge developed by scientific research. The num-ber of citations made in patents to the scientific literature has been suggested as an indicator of this process of transfer of knowledge from science to technology. We provide an intersec-toral insight into this indicator, by breaking down patent citations into a sector-to-sector ma-trix of knowledge flows. We then propose a method to analyze this mama-trix and construct vari-ous indicators of science intensity of sectors, and the pervasiveness of knowledge flows. Our results indicate that the traditional measure of the number of citations to science literature per patent captures important aspects intersectoral knowledge flows, but that other aspects are not captured. In particular, we show that high science intensity implies that sectors are net suppli-ers of knowledge in the economic sector, but that science intensity does not say much about pervasiveness of either knowledge use or knowledge supply by sectors. We argue that these results are related to the specific and specialized nature of knowledge.
Keywords: knowledge input-output analysis, knowledge flow matrices, science-to-technology transfer
This research has benefited from support under DIME, which is a project in the European Union 6th Framework Programme.
UNU-MERIT Working Papers
ISSN 1871-9872
Maastricht Economic and social Research and training centre on Innovation and Technology, UNU-MERIT
UNU-MERIT Working Papers intend to disseminate preliminary results of research car-ried out at the Centre to stimulate discussion on the issues raised.
1. Introduction
Technological change results in largest part from investments, such as R&D, by commercial firms. Among the inputs that firms use to produce technological knowledge is knowledge generated in the ‘science’ sector, e.g., from universities and public research organizations. The interaction between the (public) science sector and the (private) firm sector is seen as an important determinant of the technological competitiveness of firms and, at a higher aggrega-tion level, regions and countries. For example, it is an often-held policy view that an impor-tant reason why Europe lags behind the United States in terms of technological performance, is that the interaction between the science and technology spheres is less developed in Europe than in the United States (Dosi, Llerena and Sylos Labini, 2006, summarize this argument and discuss it critically).
Knowledge flows, or interaction in a more general sense, between science and technology takes many different forms, each associated with specific channels and types of knowledge (Cohen, Nelson and Walsh, 2002). For example, knowledge may be transferred by means of personal contacts at conferences and workshops, or by mobility (change of jobs) of research-ers, by (graduate) students, by joint research projects, or by publication channels such as sci-entific articles and patents. With regard to the relative importance of these channels or sources, Cohen, Nelson and Walsh (2002: 14), reporting on the outcome of a survey among R&D managers in US firms, conclude that “publications/reports are the dominant channel, with 41% of respondents rating them as at least moderately important”.
One way of quantifying the impact of the ‘publication channel’ on technology develop-ment is through the use of citations by patents to scientific publications (Narin, Hamilton and Olivastro, 1997). This makes use of the need for patents to cite the ‘state-of-the-art’ with re-gard to the invention described in the patent. An important part of this state-of-the-art is pro-vided by means of citations, either to other patents or to so-called non-patent literature. The latter often are citations to scientific articles or handbooks. Narin, Hamilton and Olivastro (1997) count the frequency of such non-patent literature citations, and trace the nature and geographical origin of the cited works. They conclude that the ‘science intensity’ of patents has increased over time, as evidenced by a rise in the average number of citations to science in a single patent, that the nature of the citation links is often geographically biased (patents tend to cite science from the same country), and that there are substantial differences between technology fields with regard to science intensity.
The number of ‘science references’ per patent has now become a standard way of quanti-fying the impact of science on technology (e.g., Tamada et al., 2006, Leydesdorff, 2004, Hicks et al., 2001). Meyer (2002) classifies citation analysis as one of the three available methods for quantifying the science – technology link (the other two methods are looking at industrial science publications and university patenting), and argues that it is the most widely used of the three (p. 197).
The use of citation analysis to measure the science – technology linkage is, to our knowl-edge, limited to the use of citations in patents to non-patent literature. Citations in patents to other patents are sometimes used as a frame of reference (e.g., benchmark the average num-ber of citations to non-patent literature against the average numnum-ber of citations to patents), but what is usually disregarded is the second- and higher-order effects that may occur when cita-tions to non-patent literature propagate forward when the patent that makes the citation to science is cited by other patents. It is our aim in this paper to provide a method of analyzing this citation process, taking account of ‘direct’ citations, as well as the ‘indirect’ effects that occur as a result of the forward propagation described above. In other words, our aim is to provide a method that provides a more complete impression of the science – technology link-ages than is traditionally obtained by only looking at ‘direct’ citations.
Our proposed method draws inspiration from existing literature that uses patent citations to study technological interdependence between economic sectors. This issue has been ad-dressed in the economic literature by studying so-called technology flow matrices (e.g., Scherer, 1984, Johnson and Evenson, 1997, Verspagen, 1997, Los, 1999). Usually, these are used to construct measures of so-called ‘indirect R&D’ (i.e., technology spillovers), and to relate this to productivity growth. We introduce citations to non-patent literature in such tech-nology-flow matrices, and utilize a number of methods that are broadly known in input-output analysis (Miller and Blair, 1985) in order to quantify the influence of science on dif-ferent economic sectors.
We start our discussion, in Section 2, with a general conceptual framework of how tech-nology flows operate. This sets the general context of our theoretical approach, and links it to an observable database (i.e., patent citations). Section 3 discusses the general nature of our database, and the way in which patent citations can be interpreted as indicators of technology flows. In Section 4, we provide a formal theoretical framework for assessing the science – technology linkages at the sectoral level. Our approach is based on an aggregation of the cita-tions data and an analytical abstraction that draws inspiration from input-output economics. Section 5 presents the empirical indicators that we derive from the methodology. In Section 6, we review trends in the database, and investigate to which extent the assumptions we made in the formal theory are justified by the data. Section 7 presents the results. Finally, in Section 8, we summarize the argument and conclude.
2. A graph-theoretic view of technological change
The aim of our analysis is to build a theoretical model of the flows of ideas in the inventive process. Invention, or innovation more broadly, can be seen as a process that takes labour, capital and prior knowledge as inputs, and produces new knowledge. We limit ourselves here to the part of this process in which prior knowledge contributes to the development of new knowledge, and hence do not consider the role of capital and labour in the inventive process. Our perspective is based on the idea of a network graph, in which new ideas (patents) are drawn from previous ideas (patents or pieces of scientific knowledge). We will use patent citations to indicate the relationships between ideas.
The view of patent citations as a network graph rests on five assumptions: (i) the complete knowledge domain can be divided into two broad categories, science and technology, (ii) within each of these two broad categories, knowledge can further be distinguished into differ-ent types or fields (e.g., electronics and mechanical engineering in technology, and physics and biology in science), (iii) we can usefully analyze the technology part of the system with-out considering its inputs back into the science part1, (iv) knowledge is cumulative: prior (ac-cumulated) knowledge embedded in a set of patents, is propagated forward if this patent is cited, (v) on average, the magnitude of the knowledge transmitted forward by a single citation is constant across citations.
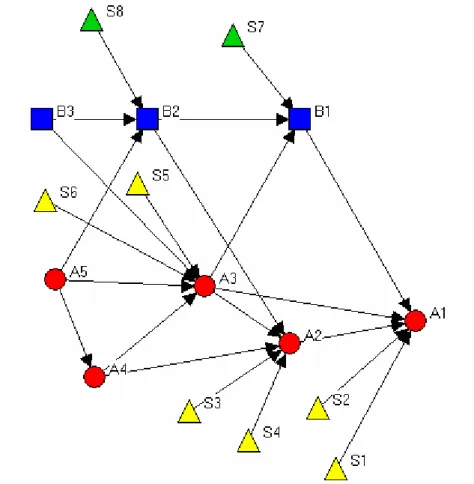
Our notion of a network of ideas is illustrated in a stylized example in Diagram 1, which displays a network of knowledge flows (patent citations). The nodes in this network (the squares, circles and triangles) represent pieces of knowledge (ideas), and the arrows
1 The latter assumption is perhaps the most controversial, as it seems to suggest a ‘linear’ view in which
sci-ence impacts on technology, but the reverse impact (from technology to scisci-ence) is absent (see, e.g., Kline and Rosenberg, 1986 for a critique of such a view). Although we are sympathetic to a more interactive view of the relationship between science and technology, we are willing to accept the assumption. The main reason is that our data, which are patent citations, allow us to observe the inputs of science (the scientific literature) into tech-nology (patents), but not the reverse.
ing them illustrate the cumulative relations between the ideas. Thus, for example, idea A4 is an input into idea A2, which in turn is an input into idea A1. The different types of knowl-edge are represented by different symbols (Type A by a circle, Type B by a square, and Type S by a triangle). Type S represents ideas that are in the realm of science, and, according to assumption (iii) do not have any inputs from the other two types of ideas. These types, A and B, represent different fields in technology.
Relations between fields are selective and specific, i.e., some types of relations are more frequent than others. For example, in the diagram the composition of inputs into Type A ideas is different from those into type B ideas. Idea A1 takes as input two ideas of Type A (i.e., from its own field), one idea of Type B, and two ideas from science. Idea B1 takes as inputs one idea of Type A, one of Type B and one from science.
Diagram 1. Stylized patent-citation network graph
The issue that interests us is whether some types of technology have a higher dependence on, or input from science, than other types of technology. Traditionally, (e.g., Narin, Hamil-ton and Olivastro, 1997) this is measured by the number of citations to science, per patent. In terms of the network, this means that the number of incoming links from triangles is counted. But the diagram clearly brings out that there are also indirect inputs from science. For exam-ple, the impact of idea S5 is immediate in the development of idea A3, but A3 in turn leads to A1, A2 and B1. Hence S5 is ‘embodied’ somehow in 4 ideas in the technology realm, some-thing that its shares with idea S6. Conversely, when we look at idea A1, it builds directly on S1 and S2, and indirectly on all other science ideas (S3-S8). The ideas of Type B generally show a much lower number of science ideas embodied in them. Note also that these indirect relations pan over the borders of technology sectors, i.e., the green science ideas that flow
into sector B patents will eventually also flow into ideas of sector A, and similarly the yellow science ideas also reach both sectors.
In order to assess the ‘science content’ of technology fields, or sectors, we need a map of the actual network. As we will explain in detail below, our approach will be to construct such a stylized map on the basis of patent citation data. Our empirical implementation assumes that citations between patents capture the links between ideas of type A and B (technology) in Diagram 1, and that citations in patents to non-patent literature capture inputs from the sci-ence realm to the technology realm. We assume that knowledge flows from the cited patent (or science reference) to the citing patent. Section 3 will provide a more detailed discussion of the nature of patent citations and how we capture them.
Although patent databases are large (e.g., the main database that we will use has approxi-mately 1.6 million patents), modern computers allow us to analyze the actual citation network graph that results from this, and hence we would be able to make direct observations based on such a micro-account. However, this suffers from particular limitations in the available data, related to the fact that the actual databases that we have are truncated in various ways, and hence that we can only observe particular sub-parts of the whole knowledge flows net-work. Two types of truncation are relevant: in time and between patent systems.
With regard to time-truncation, we have left- and right-truncation. With right-truncation, the problem is that we can only observe patent citations up to the most recently published patent. For this patent, we know where its (direct) inputs came from (what it cited), but we do not know into which other patents (ideas) it will become an input. In Diagram 1, ideas A1 and B1 are examples of right truncation. Left-truncation in time results from the fact that pat-ents and patent citations were not recorded from the beginning. For example, our patent data start in 1979, and no citations to patents prior to this year are available. In Diagram 1, ideas B3, A4 and A5 are examples of this. We observe the patents that cite these patents, but we do not observe what they cite themselves, and we cannot be sure that there are no other patents (published before the left truncation) that cite these patents.
An additional truncation problem occurs because patents can be filed under different na-tional or internana-tional patent systems (associated with different patent offices, e.g., the Euro-pean Patent Office, the US Patent and Trademark Office, USPTO, or other national patent offices). In the example of Diagram 1, it may be the case that patents A1 and B2 are filed with the USPTO, and the other patents are filed with the EPO. In reality, such citations be-tween the different patent systems are frequent.2 The truncation problem arises because we have only information on patent characteristics of patents of a single patent system (the EPO), and we lack complete information on patents in the other systems. Thus, in terms of Diagram 1, if patents A1 and B2 are indeed outside the EPO system, we do not have specific information on them (e.g., we do not know their field of origin). Obviously, this distorts our picture since, for example, we cannot observe where one of the inputs into A2 comes from, or where A2 sends one of its outputs.
In order to avoid these truncation problems, we implement a more aggregate (sector-level) approach to mapping the knowledge flows network. This essentially consists of constructing for a single point in time a set of probabilities that a knowledge flow emerges between two sectors, and assume that these probabilities are constant in time, so that we can extrapolate them (we will test for the assumption of constant probabilities). This approach is based on the methods developed in input-output economics. In short, we avoid the truncation problems by sampling the data rather than summing it up. The sample is based on a particular generation
2 A further complication results from the fact often one idea is filed under different patent systems, resulting in
two ‘varieties’ (e.g., a USPTO and an EPO) of the same patent. The procedure we use to construct our patent citations dataset takes this into account, and standardizes such cases to the single EPO variety of the patent. De-tails are given below.
of patents and their backward linkages (citations). We define such a generation of patents as all patents belonging to a particular year. The network representation that we build (described in Section 4) is based only on the direct citation inputs into this generation of patents, but it assumes that the indirect inputs (i.e., the citations made by the cited patents) can usefully be described by the same probabilities as observed in the single generation.
3. Patent citations: measurement and interpretation
We have already briefly discussed how we will use patent citations as a representation of the flows in our technology network (Diagram 1). Although the use of patent citations has by now become quite widespread in the literature (see, e.g., the overview of contributions in Jaffe and Trajtenberg, 2002), there are certain problems with this particular interpretation. Before we actually proceed to develop a theoretical framework and use it for empirical analy-sis, we briefly discuss these issues here.
Central in our approach is the notion of a patent citation. But, of course, patent citations were not introduced to facilitate the economic analysis of science and technology. Instead, the (legal) purpose of the patent citations is to indicate which parts of the described knowl-edge are claimed in the patent, and which parts other patents have claimed earlier. From an economic point of view, however, the assumption is that a reference to a previous patent in-dicates that the knowledge in the latter patent was in some way related to the new knowledge described in the citing patent.
Authors like Jaffe et al. (1993) and Maurseth and Verspagen (2002) have argued that the citation link can be interpreted as a knowledge spillover, i.e., an externality for the citing party. However, we are not specifically interested in the notion of knowledge spillovers, but instead in the broader notion of technology flows (i.e., flows irrespective of whether they rep-resent and externality in the economic sense), and hence accept patent citations as a broad indicator of knowledge relatedness and flows.
We will use only citations between European patents (including international patents un-der the PCT system filed through EPO), i.e., we will only consiun-der patent citations where both the citing and cited patent are applied for at the EPO. Besides a practical reason (we do not have information on patents in other systems than the US and EPO systems), there is also a more fundamental reason to limit our citations information to the EPO patents. This is the fact that there are major differences between citation practices at the two patent offices. In the USPTO system the applicant, when filing a patent application, is requested to supply a com-plete list of references to patents and non-patent documents that describe the state-of-the-art of knowledge in the field. In the EPO system, the applicant may optionally supply such a list. In other words, while in the US there is a legal requirement and non-compliance by the patent applicant can lead to subsequent revocation of the patent, in Europe it is not obligatory. As a result, applicants to the USPTO “rather than running the risk of filing an incomplete list of references, tend to quote each and every reference even if it is only remotely related to what is to be patented. Since most US examiners apparently do not bother to limit the applicants’ initial citations to those references which are really relevant in respect of patentability, this initial list tends to appear in unmodified form on the front page of most US patents.” (Michel and Bettels, 2001, p. 192). This tendency is confirmed by the number of citations that on av-erage appear on USPTO patents. Michel and Bettels report that US patents cite about three times as many patent references and three and a half times as many non-patent references compared to European patents. Thus, our strategy of using only EPO citations implies that we take a more conservative view of knowledge flows.
In more specific terms, we use data from European patent applications3 to analyze tech-nology flows. Our data are extracted from the Bulletin cdrom issued by the European Patent Office (EPO), and from the REFI-dataset supplied to us on dvd by the EPO. The Bulletin dataset supplies us with the date of each individual patent, countries of residence of its inven-tors, and the technology class (International Patent Class, IPC) assigned to it by the patent examiner. We use the priority date of the patent (which is the date at which the knowledge in the patent was first patented, worldwide) to assign it to a year (when priority date is missing, we assume the patent was first applied at the EPO, and hence use the EPO application date).
We also utilize a database supplied by the OECD covering the phenomenon of interna-tional patent families. In this context, the term patent family is used to describe a set of pat-ents filed under different patent systems (e.g., EPO, USPTO), but covering the same inven-tion. The OECD database that we use (Webb, Dernis et al., 2004) provides a list of so-called equivalent patent numbers (e.g, EPO patent 1234567 is equivalent to USPTO patent 7654321). This database is updated using data from the Espacenet webserver, which uses the same raw database as was used to construct the OECD database.
The REFI-dataset that is the source for our citations data also contains citations made in other patent systems than the EPO. The start of our citations database is a list of citing and cited patents (a so-called citation pair), covering a range of patent systems including the EPO. From this list, we identify the citation pairs in which the citing patent is either an EPO patent, or where the citing patent is found by our patent families database to be equivalent to an EPO patent. In the latter case, we substitute the original (non-EPO) citing patent by the equivalent EPO patent. Thus, we have, as an intermediate result, a list of citation pairs where all citing patents are EPO patents. We then select the subset of this list where also the cited patent is an EPO patent, or where the cited patent has an EPO equivalent. The final citation database, used in the analysis below, is then a list of approximately 1.64 million citation pairs, involv-ing approximately the same number of EPO patents.
Obviously, related to the inter-industry point of view that we take, the assignment of a pat-ent to an (economic) industry (sector) is crucial. We use the Merit IPC-Isic concordance table (Van Moergastel et al., 1994) to make this assignment. This concordance table is based on a detailed comparison of the content of the IPC and Isic (rev. 2) classification schemes, and a matching of the activities described in both. The principle of the matching is that the patent is assigned to its most likely industry of origin (e.g., a textiles machine is assigned to the ma-chinery sector, not the textiles sector). The concordance is done at the 4-digit IPC level, and a mixture of 2-, 3- and 4-digit Isic industries (these will be introduced below when we discuss the data). We use only the manufacturing sectors in the concordance, and opt to aggregate the 22 sectors found in the concordance to 19. The concordance allows the assignment of a single IPC class to multiple Isic industries, based on a weighting scheme. This implies that patents are assigned fractionally, i.e., we do not necessarily have an integer number of patents in each industry.
4. Approximating the knowledge flow network by input-output methods
Before we start, let us make a note on our matrix notation for consistency. A square matrix (of size n×n, where n is the number of industries) well be indicated by a boldface and capital-ized letter as in X, while a column vector (of size n) by a boldface small letter as in x, and a row vector as in x', where ' stands for transposition. We refer to individual elements of matri-ces by small letters with two subscripts (i.e., xijstands for the ith row jth column element of
3 Below, we will use the term ‘patents’ to refer to patent applications, and we consider these applications
matrix X), while elements of vectors will be referred to by small letters with a single sub-script (xistands for the ith element of the vector x). The format <x> will be used to indicate a
diagonal matrix (of size n×n) constructed from the vector x, which has xi at its ith diagonal
and zeros elsewhere. Finally, i (i') refers to the column (row) summation vector (i.e.,
i'=[1,1,1,...1]).
In constructing a knowledge flow table in raw form, we start at the patent citation level. For each of our citation pairs, we have information on the industries of the citing and cited patents. Furthermore, patents are also classified according to the year of the priority date. We follow the usual approach in the literature by constructing a citation flow matrix CPL(we will omit time superscripts in our matrix notation, but all matrices refer to a specific year, unless otherwise indicated in the text) for year t, where t refers to the priority (invention) year of the citing patent (the patent that receives the knowledge flow). The rows and columns in the citation matrix represent industries of origin of the cited (row) and citing (column) patent. A column of this matrix will break down the citations made by industry j patents of year t ( ) into t n+1 (where n is the number of industries) categories such that
j c , ... 2 1 t nj t j t j t j t j cnpl cpl cpl cpl c = + + + + 1
where stands for the number of citations to non patent literature made by year t, indus-try j patents t j cnpl 4 and t ij
cpl for the number of citations to patents originating in industry i, made by year t, industry j patents. The number , usually scaled by the number of patents in indus-try j, year t is what Narin, Oliveira and Hamilton (1997) used as an indicator of the science intensity of industry j patents. However, from an input-output perspective, this is hardly a sat-isfactory measure, since it only captures the direct citations to science that industry j makes.
t j
cnpl
Let us define and (note that by definition, ). If
the a’s and v’s are assumed to be constant over time, we can calculate the indirect science intensity of industry j patents, by accumulating the that are made in the patents that in-dustry j cites ( ). But these patents in turn cite other patents, which cite non patent litera-ture as well as patents, and the process continues ad infinitum. To represent this process, which is not un-akin to a Leontief multiplier process, we define the n×n matrix A, whose elements are the values. In terms of its interpretation, this matrix is clearly analogous to the input-coefficient matrix of input-output economics, which decomposes the input require-ments of a number of economic sectors over the sectors which supply these inputs. Let us also construct an n×n diagonal matrix <v>
t j t j t j cnpl c v ≡ / t j t ij t ij cpl c a ≡ / +
∑
i t =1 ij t j a v t i cnpl t ij cpl t ij awith elements on the diagonal and. t j
v
Now consider the following line of reasoning aimed at finding the total, i.e., directly and indirectly, accumulated science content (non patent literature references) embedded in patents of industry j, year t. Clearly, <v>gives the fraction of ‘direct science content’ embedded in a single patent (per industry). But a ‘second round’ of science content flows from the patent literature citations and the non patent literature that they (directly) cited in the past. This can
4Note that we do not make any direct observation about the nature of the cited science knowledge. For exam-ple, if the chemistry sector cites a paper in electrical engineering, it will be recorded in the chemistry column, not in the electrical machinery or electronics column. Also note that we cannot observe whether a particular scientific paper (or other literature) is cited more than once. Hence we treat each non-patent-literature reference as if it were unique.
be represented by the matrix product <v>×A, which, for industry j, captures both science in-puts that enteredthe system in industry j itself, and science inputs that entered the system in other industries (depending on A). Similarly, we can envisage a third round of embedded sci-ence, represented by <v>×A×A, and a fourth round <v>×A×A×A, etc. The complete citation chain, for a single patent, is described by the following matrix product:
∞
= × + + 2+ +
D < v > [I A A ... A ], 2
where I is the (n×n) identity matrix.
The term in the brackets is quite familiar from input-output economics. It is the power se-ries expansion of the Leontief inverse (I-A)-1, which is convergent if all column sums of the elements of matrix Aare strictly less than one, and all coefficients are non negative (both of which are naturally satisfied in our matrix A). Thus, equation (2) can also be written as
−
= × − 1
D < v > (I A) . 3
Let us now define the vector s'≡
(
D c×)
'
, where c is the column vector of the values, i.e., c is simply the total citations (to patents and non patent literature) made by the industries.
s' represents the total (direct and indirect) science input in citations that has flown into the system through the various industries, either in year t or prior to that, and transmitted forward in time through (a long chain of) patent citations. The j
t j
c
th element of s'represents total science inputs that was introduced into the system by patents of industry j.
The columns of the matrix D all sum to 15. This implies that the sum of the elements of c
is equal to the sum of the elements of s'. Because s' represents the distribution of the ‘produc-tion’ of science inputs (non patent citations), we can conclude that in the formal system de-scribed so far, the total number of citations made by patents in year t is equal to the total number of science references embodied in these citations. In other words, if we define an av-erage ‘composite’ citation by the fractions aij and vj(i.e., a composite citation made by
indus-try j cites v science references and aijpatents of industry i), this embodies exactly a single unit
of science input.6 Thus, a unit of ‘pure’ science references is a natural measurement of knowledge in our system.
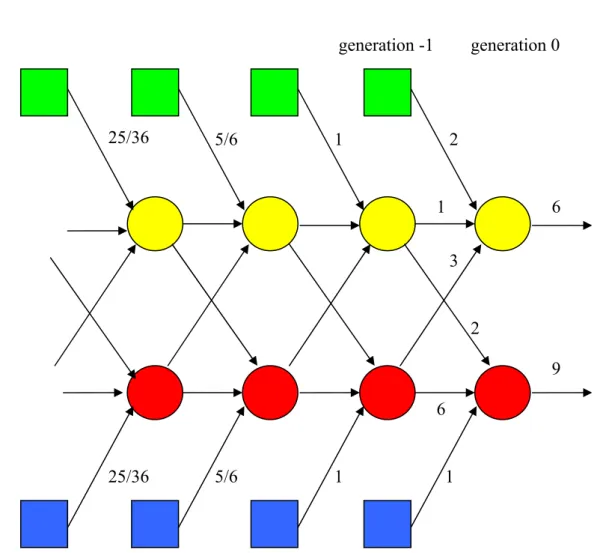
Diagram 2 represents a stylized example of a chain of citations that is described by the system as introduced so far. The circles represent two industries, distinguished by the colors red and yellow. The squares represent the science sector. We also define two types of science inputs, blue and green, based on the sector that they feed into. The arrows represent citations between the different units (industries and the science sector), and the numbers indicate the number of citations made on a particular link. Thus, we see that for generation t = 0, the yel-low sector makes a total of 6 citations, of which 3 are to patents of the red sector, 1 is to
pat-5 The vector of the column sums of matrix D is i'×<v>× (I-A)-1. Let us call this vector of column sums ε. Then
i'×<v>= ε- ε×A, which, due to the identity +
∑
i t =1ij t
j a
v implies the equation system
1 1 1 n n j j ij j i i a v a ε ε = = −
∑
= = −∑
ij for all j=1,2,...n. =1-εIf we define the instrumental vector δ, where δj j, this equation system is equivalent to δ = δ×A. Clearly,
unless each column sum of matrix A adds up to 1 (which is never the case for any A matrix in IO systems), δ =
δ×A solves for δ= 0', which implies ε = i'.
6 This characteristic of the system is partly the result of the implicit assumption that in the citation system total
ents of the yellow sector itself, and 2 are to science references. The red sector makes a total of 9 citations, of which 6 are to the red sector itself, 2 are to patents of the yellow sector, and 1 is to the science sector. These numbers can be used to set up the following specific realiza-tions of A and v': Yellow Red Yellow 1/6 2/9 A Red 3/6=1/2 6/9=2/3 v' Science 2/6=1/3 1/9 generation 0 3 1 2 2 1 6 6 9 1 1 5/6 5/6 25/36 25/36 generation -1
Diagram 2. Stylized citation network graph used to illustrate formal approach
Under the assumption of a fixed A and v prior to generation 0 (this is the rightmost set of patents), we can derive the number of citations that must be present on every one of the ar-rows that points to generations of patents prior to generation 0. For example, at generation1, a total of 3 citations leave the yellow sector (output), and this must be matched by an equal input. vyellow = 1/3 of this (i.e., a total of 1) comes from the science sector, ared,yellow = 1/2 of
this (a total of 3/2) comes from the red sector, and ayellow,yellow = 1/6 of this (a total of 1/2)
comes from the yellow sector itself (1 + 3/2 + 1/2 = 3).
In this way, all the links originating directly from science have been filled in in the figure. Obviously, in order to obtain a complete picture, we would have to extend the diagram infi-nitely to the left. In that (imaginary) case, the sum of all values on the arrows originating from the blue and green squares (science sector) would be equal to 15 (6 + 9), which is the total amount of citations made by patents of generation 0 (i.e., the sum of elements of vector
c). c is represented in the diagram by the two horizontal arrows on the right hand side. The vector s' may be obtained by summing the top (green) and bottom (blue) rows of sci-ence inputs. Making the actual calculation s'=
(
D c×)
', we obtain s'= [8,7]. Hence, a total of 8 units of pure (green) science have been introduced into the system by the yellow sector, and 7 units of pure (blue) science by the red sector. In a version of a diagram that would extend infinitely to the left, the sum of flows originating from the bottom (blue) science row would be 7, that from the top (green) 8. Note that, indeed, the sum of elements of s is equal to the sum of elements of c (8 + 7 = 15 = 6 + 9).So far, our perspective has been backward, i.e., we have asked how many pure science units are embodied in the citations made by patents published in year t. We may also take a forward perspective, which asks how much knowledge (in pure science units) is passed on to future generations. Let us introduce the column vector g to denote this forward flow of knowledge, where the convention is that the jth element of g denotes the amount of knowl-edge passed on by patents of industry j to future generations.
Obviously, we do not observe the citation behaviour of future patents (yet), and hence there is no way in which we can observe g. However, if we apply our assumption that at each generation incoming knowledge flows are equal to outgoing knowledge flows also to forward streams, we deduce that c will be equal to g, or, in words, that the total number of citations that a generation of patents makes (by sector) is also equal to the amount of knowledge it passes on to future generations of patents. The intuition behind this is that each generation of patents simply passes on the knowledge it received from previous generations of patents (by means of patent-to-patent citations), plus the knowledge it took directly from the science sec-tor.
The system as described so far can also be summarized in tabular form as in Table 1. A narrative of constructing this patent flow table starts with the calculation of the (row) vector
s'. This vector results from the empirically observed citation flow matrix CPL (equation 1 above), and the matrices A and <v> and vector c that are all calculated from CPL. Given
<v>, we calculate the total amount of citations that was necessary to bring the amount of knowledge represented by s' to generation t patents. This is represented by the row vector
tcm'. In terms of the above diagram, this is the sum of all arrows in the diagram, except the two rightmost arrows leaving generation 0 patents.
In a similar way, and using the elements of A, we may fill in the top-left block of the table, which represents the patent-to-patent citations part of tcm. Row-wise, the elements in this block of the table represent the patent-to-patent citations that leave patents of a specific sec-tor, or, in other words, knowledge that is transmitted from this sector to other sectors. The column vector g is put to the right of this, so that we capture in every row also the knowledge that is transmitted to future generations of patents. As we have already explained above, the assumption g =c is a reflection of our assumption that each generation of patents simply passes on the knowledge it received from previous generations of patents plus the knowledge it took directly from the science sector. Finally, the rows will sum to the same total as the columns sum to, and hence we put tcm' as the row totals on the far right of the table.
INTERMEDIATE CITATION FLOWS IN PERIOD−∞ TO t:
(n× n) The matrix ICF,with
elementsaij· tcmj TOTAL SCIENCE KNOWLEDGE PROVIDEDTO POST-t PATENTS (n×1) g=c (by assumption): TOTAL CITATIONS MADE IN YEAR t: CITATIONS RECEIVED IN PERIOD−∞ TO t: (n×1) tcr = (ICF × i) +g = (I-A)-1× g = tcm’
TOTAL SCIENCE KNOWLEDGE ∞ − TO t: TAKEN IN IN PERIOD (1×n) s'= [D× g]' -1 = [<v>× (I-A) × c]' CITATIONS MADE IN PERIOD−∞ TO t: (1×19) -1 tcm'= s'× (<v>) = [(I-A)-1× c]'
Table1. The construction of the patent citation flow table
Readers who are familiar with the Leontief economic input-output system may recognize that our constructed patent-flow table is in many regards similar to this.7 The matrix ICF is reminiscent of the matrix of intermediate flows of goods between sectors. A crucial differ-ence, however, between our matrix ICF and a matrix of intermediate deliveries lies in the time horizon applied to construct these matrices. In national accounts, the complete chain of intermediate goods flows that lead to a final product are typically observed within a year. On the other hand, the average lag between a cited and citing patent is typically several years, implying that a chain of several patent citations can quickly run over a period of decades. This is why we have to resort to indirect observations based on the assumption of constant
<v> and A to construct our matrix ICF for the period −∞to t, instead of directly observing it in entirety for a fixed period of time.
Continuing the analogy to input-output economics, science inputs play the role of primary inputs, and s' is similar to a value added vector. Finally, g is similar to the investment part of final demand. Because we have no equivalent of final consumers in our system, all ‘final de-mand’ is necessarily carried on to the future (investment).
Scientific knowledge is brought into the system in a cumulative manner by the non patent literature citations, given by the vector s', is transmitted forward (up to year t) by the patent citations given by the intermediate flow matrix ICF, and is finally transmitted to the future, (i.e. post year-t patents) by the final set of g patent citations. Throughout this process the total
7 Note that in our own view, an analogy between the economic input-output table and our patent citation flow
table is natural, but there is no need to subscribe to this analogy in order to appreciate the calculations that we will provide in the remainder of this paper.
number of (patent-to-patent and patent-to-non-patent literature) citations made by the sectors are given by the row vector tcm', and similarlythe total number of citations received by the sectors is given by the column vector tcr. Just similar to the equality of total expenditures to total output in an economic input-output system, in our system tcm= tcr, and similar to the equality of total final demand to total value added, in our system s'×i = i'×g.
5. The empirical implementation and proposed indicators
In actually constructing the knowledge flow table in its raw form (as represented in equa-tion 1), we start at the patent citaequa-tion level. We represent patent citaequa-tions as pairs of citing and cited patents. For each of those pairs, we have information on the sectors of the citing and cited patents. Denoting the sector of the cited patent by i, and the sector of the citing patent by j, we record this particular citation as a knowledge flow of value 1, in the cell (i,j) of the matrix called CPL.8 We have yearly versions of the CPL matrix for 1979 – 2005, where the year refers to the priority date of the citing patent. Citations to non-patent-literature are en-tered into the row-vector cpnl', in the column i, where i is the sector of the citing patent. Be-cause we look at direct citations only, the problem of right time-truncation is solved: we al-ways observe all incoming citation links in a matrix for a particular year.
But this is obviously not the case for left-truncation: any citation to a patent that falls be-fore the first date for which we have patent information (e.g., sector/IPC class) is not re-corded. Hall, Jaffe & Trajtenberg, (2002, p. 421-4) show that, in the USPTO database, about half of all citations to a particular (average) patent are made within a period of 10 years. For the most recent year for which we can construct a reliable matrix (1999 or 2000), we can broadly cover cited patents over a 15-20 year time lag. Hence, we can be confident that the large majority of incoming citations are covered.
The problem of truncation between patent systems is somewhat harder to deal with in a completely adequate way, although we did correct partially for this by using the (updated) OECD database of patents equivalents (see above). But we still have the problem that we do not capture all patent-to-patent citations, while we capture all (direct) citations to the non-patent literature. This will bias the value of elements of matrix <v> upward. We discuss this problem in more detail in the appendix, where we conclude that an imperfect correction for this truncation problem is feasible. We have used this correction method on our data, but choose to report results based on uncorrected data. The impact of the correction is not large and corrected results are available on request.
Indicators
Based on the input-output tables discussed so far, we construct a number of indicators that are aimed at scoring the sectors in terms of their role in the knowledge transfer system. We dis-cuss these indicators one by one.
Backward multipliers: In input-output economics, backward multipliers capture the general idea that due to the derived demand for intermediate goods, an increase in demand for one sector will increase the total gross production of the economy by more than the original in-crease in demand. Furthermore, the resulting output inin-crease is not confined to the sector
8As explained above, our IPC-Isic concordance sometimes assigns a patent to multiple Isic sectors, with
par-ticular weights assigned to each of the sectors. We apply a fractional counting method for these cases. The value assigned to cell (i,j) of the matrix is equal to the product of the weights of the sectors i and j. Because the set of weights sums to one for both the citing and cited patent, each citation will count for one after it has been divided over all possible combinations of citing and cited sectors.
where the original increase in demand takes place. Backward multipliers are generally calcu-lated as the column jsum of the so-called Leontief inverse, i.e., i'×(I-A)-1. Similarly defined backward multipliers are also useful indicators in our patent citation flows table, although their interpretation is not completely analogously to input-output economics.
Let the vector λtdenote the counterpart of the backward multiplier vector as applied to the
constructed cumulative citation-flows table year t. That is, let -1
= i'×(I-A . 4
'
λt t)
Given this specification, for each industry j, the backward multiplier λtjindicates the total
number of patent-to-patent citations that is necessary to make one (extra) unit of composite scientific knowledge available in year t patents of industry j, which can, in turn, be transmit-ted forward to post-year t patents (of various industries). In terms of Diagram 2, the backward multiplier measures what happens, under constant input-coefficients, if the rightmost arrow in one of the sectors is increased by one. For this to happen, the value of science inputs (arrows originating from squares) in the diagram will also have to increase by one. The backward multiplier measures by how much the value of the arrows between patents (circles) will have to increase to accommodate this increase.
Because there is a strict generational separation between the citations in the diagram, and the input coefficients are fixed, an increase of the value on the patent-to-patent arrows in the diagram corresponds to a citation chain that stretches further and deeper to the left (i.e., backward in time). Hence the backward multiplier is also an indicator of the average time-lag for scientific knowledge to become embodied in the present generation of patents (and avail-able for future citation), and hence an indicator for the relative age of knowledge accumu-lated in the patents of the industry.
Let us give a single-sector example to clarify the interpretation of these backward multi-pliers. Assume that out of all citations, 100x (0 < x < 1) percent goes to NPL and 100(1-x) percent goes to other patents. Note that with smaller x, less science knowledge flows in at the present generation of patents, or, in other words, more science knowledge flows in at earlier generations. With constant x, this naturally holds at all generations, which implies that with smaller x, the average age of the knowledge embodied in current generations is higher.
Our notation implies that the 1x1 input coefficient matrix A=1-x, and v=x. Thus, x of a 1 unit increase of knowledge accumulated in year t patents comes from the x immediate NPL citations. The rest of the knowledge comes from the 1-x citations that are directed to older patents, which pass on ‘second hand’ scientific knowledge to generation t. The second hand knowledge transmitted by these 1-x citations had been supplied by the x(1-x) NPL citations of the previous generation patents, plus (1-x)2 patent citations directed to the earlier generation of patents. Similarly, the knowledge transmitted by these (1-x)2 patent citations had been supplied by the x(1-x)2 NPL citations of the previous generation patents, plus (1-x) patent 3 citations directed to the (even) earlier generation of patents. Keeping on compounding back-wards through the history of citations, it is confirmed that each unit of knowledge accumu-lated in patents of t, was introduced into the system by a total of x+ x(1-x)+ x(1-x)2+...+ x (1-x)∞= 1 NPL citations, and this was transmitted to patents of t through a total of (1-x)+ (1-x)2+...+ (1-x) patent-to-patent citations. Adding these two numbers up, we arrive at the total ∞ number of citations (to patent and non-patent literature) that is responsible for the extra unit of knowledge accumulated in patents of year t, which is equal to 1+(1-x)+ (1-x)2+...+ (1-x)∞= 1/x. Thus, the backward multiplier λ is equal to 1/x, and since x is related to average age of embodied knowledge, the multiplier serves as an indicator of age. More precisely, since x is inversely related to average age of embodied knowledge, the multiplier positively related to this.
−
= × − 1 D < v > (I A)
Note that since as described in equation (3), one can also express the backward multipliers as = i'×<v> 1 1 N j ij i i D v λ = ⎛ ⎞ = ⎜ ⋅ ⎝ ⎠
∑
-1×D, or equivalently as ' λt ⎟. This impliesthat the backward multipliers are actually the weighted average of the (inverse of the) share of non patent literature citations of all sectors, where the set of weights for each sector j is given by the shares of each sector-specific type of scientific knowledge embedded in the total knowledge stock of sector j patents.
This illustrates that the backward multipliers are structural indicators that reflect the idea of vertically integrated sectors, as in Pasinetti (1981), or Sánchez-Chóliz and Duarte (2003). The citation network structure captured by our patent citations flow table indicates that, at the industrial aggregate level, only a part of the scientific knowledge that is eventually transmit-ted to industry j patents of year t comes from the immediate NPL citations of this industry itself. Another good deal comes from citations to older patents, including some of other in-dustries, and this goes back in time ad infinitum. Thus, the total knowledge embodies in cur-rent generation patents is generally a mixture of bits and pieces of various types of industry-specific knowledge, and the backward multipliers capture this.
Forward Multipliers: These multipliers are technically similar to the backward multipliers but they are based on output coefficients, not on input coefficients. Accordingly, in econom-ics, these multipliers capture supply-push effects rather than demand-pull effects: The for-ward multiplier of industry j indicates the increase in total expenditures of the economy that would be caused by a unit increase in sector j value added. Since the idea of a supply-driven model is originally introduced by Ghosh (1958), these multipliers are also referred to as the Ghosh multipliers.
Although the direct citation matrix A that we collect from the data does not allow the cal-culation of output coefficients, once the cumulative patents citations flow table (Table 1) is constructed, one can calculate an output coefficient matrix BBt, where b = icft,ij t,ij/tcrt,j. Given
this matrix, the vector of forward multipliers is calculated as
γt = (I-BBt) × i. 5
-1
In the context of the patent citation network, these forward multipliers have the following interpretation. For each industry j, the forward multiplier γt,jindicates the total number of
cita-tions that is necessary to transmit 1 (extra) unit of industry j-specific scientific knowledge, through the citation network, to patents of year t (of potentially a number of different indus-tries). In line with the interpretation of the backward multiplier, the forward multiplier of in-dustry j is a relative indicator of the average age of industry j-specific scientific knowledge (i.e., knowledge introduced by industry j patents), as embodied in the current generation of patent citations. The intuition in terms of age of knowledge behind these forward multipliers is quite similar to that of the backward multipliers (in a single sector world, e.g., forward and backward multipliers are equal).
Still, forward and backward multipliers are quite different in terms of their interpretation. While backward multiplier are about the process of accumulation of the pool of different types of knowledge embodied in patents of a given industry, the forward multipliers are about the process trough which a given type of knowledge is transmitted forward and distributed over the patents of all industries. This highlights the importance of a conceptual distinction between the two alternative temporal directions in which one can look at our cumulative cita-tion flows system (cf. Diagram 2). A backward looking approach perceives the patents of dif-ferent industries as difdif-ferent sinks. A difdif-ferent composition of a variety of difdif-ferent types of
industry-specific scientific knowledge of different industries eventually accumulates in each sink, and the backward looking approach considers the composition of knowledge found in each sink. On the other hand, the forward looking approach looks at sources, each of which introduces a different type of industry-specific scientific knowledge and distribute these for-ward over the patents of a variety of industries.
The next indicator that we will discuss below aims at analyzing the relative strength of the patents of different industries in terms of their double role in performing as sources and sinks at the same time. As we will argue, some industries are relatively more active in their role to perform as sources than they are in performing as sinks and vice versa.
Net science multipliers: The magnitude gi(= ci) is the amount of composite scientific
knowl-edge that is accumulated in industry i patents of year t, which is made available to future (i.e., post-year t) patents. On the other hand, siis the amount of pure industry i-specific scientific
knowledge which is introduced into the patent system by industry i patents during the time interval [-∞, t], and distributed over patents of various industries. gi >si would indicate that
industry i patents are more important as sinks of knowledge than as sources, and vice versa for si >gi. Therefore, we define a ratio μti, which is the ratio of scientific knowledge
intro-duced by all industries which eventually ends up in industry i patents of year t, and the scien-tific knowledge introduced by industry i that ends up in allpatents of year t. Thus μti>1 (<1)
would indicate that industry i is a net knowledge supplier (user).
We note that this idea is quite similar to what Oosterhaven and Stelder (2002) call net multipliers in an economic input-output context. Dietzenbacher (2005) shows that such net (value added) multipliers give the ratio of value added to final demand. This is obviously very similar to our source/sink interpretation of knowledge flows. This is why we call this indicator the net science multiplier indicator. Following Oosterhaven and Stelder (2003) and Dietzenbacher (2005), we calculate the row vector μt, which is a vector whose ith element is equal to μj=g /si i, as follows:
μt' = s'×<tcm>-1×(I-A)-1×<g>×<s>-1. 6
-1 -1×c and s'=[<v>
On the basis of Table 1, (i.e., tcm=(I-A) × (I-A) × c]'), and also letting L
denote the Leontief inverse (I-A)-1, it is clear that the element in the jth diagonal of the inverse matrix <tcm>-1 is , whereas the i
1 1/ N ij j
j L C =
∑
th element of the row vector s'is ,which implies that the term s'×<tcm>
1 N i ij j v L C =
∑
j-1=i'×<v>. Consequently, given i'×<v>×(I-A)-1=i', the calculation of μtreduces to
μt' = i'×<g>×<s>-1. 7
−
= × − 1 D < v > (I A)
Self-reliance of sectors: The matrix breaks the embedded knowledge in the patents of each sector down to its sector-specific components. The extent to which a sec-tor relies on scientific knowledge introduced by itself can be assessed by looking at the weight on the diagonal of this matrix. The most straightforward way of measuring this is sim-ply
,
jj j =D
δ
which we refer to as the self-use of knowledge indicator. It is the share of sector j-specific knowledge in the composite knowledge mix of sector j patents.
Similar to D, we construct a matrix K that decomposes the knowledge supplied by an in-dustry i in terms of the industries that use its knowledge. This uses the output coefficient
ma-trix BBt as well as the diagonal matrix <f>,which has the ratio g /tcrj j (i.e., the share of citations
received by industry j patents of year t in all citations received by industry j patents of [-∞, t]) on its jth diagonal. The matrix
K=(I-B)-1×<f> 8
is then quite similar to D: kij gives the share of the industry i-specific knowledge (introduced
and transmitted by industry i patents in [-∞, t]) which is eventually transmitted to industry j patents of year t. Since these are shares, all row sums of K are equal to 1 (K×i=(I-B)-1×<f>×i
= i ).Using K, we introduce a similar measure to δ, but which focuses on the knowledge sup-ply of the sectors. This is
,
jj j =K
κ
which is the share of sector i-specific scientific knowledge transferred by sector i to itself, or the self-supply indicator. It is an indicator of how much a sector generates internal knowledge vs. knowledge that is used by other sectors.
Pervasiveness of knowledge suppliers and users: Independently of the amount of knowl-edge that an industry supplies to the aggregate system, or the amount that it uses, the distribu-tion of its knowledge supply or demand over the range of industries is an important indicator. For example, the distribution of knowledge inputs of a certain industry over all industries in the system indicates to which extent that industry is dependent on a small range of industries for its (ultimate) knowledge inputs. Similarly, the distribution of knowledge supply of an in-dustry over all industries is an indication of how pervasive knowledge of a particular inin-dustry is.
−
= × − 1 D < v > (I A)
We may again use the matrix to construct an indicator for this. We
start by looking at the off-diagonal elements of this matrix (the diagonal elements are cap-tured in the previous indicator), and consider the column for every sector. For this column, we calculate an inverse Herfindahl index for industry j as
. 1 1 , 1 2
∑
≠ = ⎟ ⎟ ⎠ ⎞ ⎜ ⎜ ⎝ ⎛ − = j i N i jj ij src j d d h 9This gives the Herfindahl equivalent number of industries that supply industry j with various types of industry-specific scientific knowledge, and is an inverse index of concentration of the knowledge sources of industry j. Clearly hjsrc, which is our indicator of knowledge-use
pervasiveness, indicates the variety in inter-industrial backward citation linkages between industry j and all other industries.
Similarly, we construct an inverse Herfindahl indicator for knowledge supply, using the row-wise, off-diagonal elements of K as follows:
. 1 1 , 1 2
∑
≠ = ⎟ ⎟ ⎠ ⎞ ⎜ ⎜ ⎝ ⎛ − = j i N i jj ij snk j k k h 10 snkhi gives the Herfindahl equivalent number of industries that eventually embed the industry
i-specific knowledge that is introduced and transmitted by industry i patents. It indicates the variety in inter-industrial forwards citation linkages between industry i and all other
indus-tries, and is a measure of how pervasively industry i influences the other industries in the sys-tem.
6. Some properties of the citation network
In this section, we provide an overview of some of the basic trends in our database. Our guid-ing question is how citation behaviour of patents differs between sectors and over time. Note that our research questions and methodology start from the basic notion that there are impor-tant sectoral differences in terms of spillovers and the associated citations. This section will document such differences at a basic level, thereby illustrating the interest of the analysis on a general level. Moreover, the specific methodology that we adopted (the construction of the citation flow table) adopts a number of specific assumptions, among which the time invari-ance of the coefficients is perhaps the most important one. Therefore we investigate to which extent this is indeed a valid assumption given the trends in the data.
Figure 1 shows the trends in the raw data on patents and citations. The EPO was estab-lished in 1979, and we see that since then the number of patents introduced per year has been increasing. During 1980 – 1989, the number of patents increases more or less linearly, after which the growth rate decreases until 1997. Despite the rather smooth behavior of the motion of the number of patents, during the 3 years that follow 1997, we observe a sudden peak. This is due to the fact that in our database, we also track patents that were filed under the so-called Patent Cooperation Treaty (PCT), which is a global patent system operating in much the same way as the EPO operates for Europe. This means that applicants may gain multiple na-tional patents as a result of just one filing. The EPO is one of the regional patent offices at which patents can be filed for global protection under the PCT. The peak around 1999 is as-sociated with a rise in the number of such PCT filings. The eventual fall in the number of patents since 2001 is a result of the (right) truncation of our database.
0.00 50000.00 100000.00 150000.00 200000.00 250000.00 300000.00 1980 1985 1990 1995 2000 2005
TOTAL PL citations Total NPL Citations Total citations made Total Number of Patents Total Citations Received
Figure 1. Number of citations made and number of patent applications
The number of citations to patents or to non patent literature rises in close connection with the number of patents itself. Due to the right truncation problem, the number of citations
re-ceived by the patents in our database shows first a gradual, then sharp decrease after 1989. The peak around 1999 associated with the PCT filings is magnified in the citations data.
Figure 2 shows the number of citations made or received per patent. After 1985, the num-ber of citations made per patent remains rather stable, around 3 citations to patents, and slightly below one to non patent literature. Also note that the PCT-related peak in Figure 1 does not translate to Figure 2. Despite the stable pattern, however, citation data are still af-fected by the truncation problem towards the end of the period, because patent citations are published in the so-called search report (issued after the first phase of examination), which trails the patent application by a period of up to several years.
Unlike the average number of citations made per patent, the average number of citations received per patent shows a strong decreasing trend over the 25 years. This is clearly an in-evitable outcome of the right truncation of the data. Simply the size of the set of patents that can cite a patent is a decreasing function the age of the patent in question, and given the cita-tion lags, 25 years is not a sufficiently long period for this ratio to exhibit steady state behav-ior.
Citations per patent
0 2 4 6 8 10 12 1980 1985 1990 1995 2000
Citations made per patent Citations (received) per patent NPL Citations (made) per patent Figure 2. Number of citations per patent
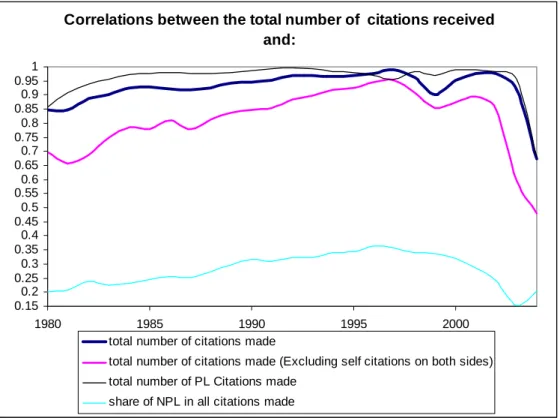
For our input-output framework, the distribution of all citations over the sectors that make or receive the citations is also an important issue to consider. At the sectoral level, the data exhibit two key properties. First, one observes strong heterogeneity over the sectors in terms of citation rates (i.e., citations per patent, made or received) and also in terms of the distribu-tions of citadistribu-tions over the entities that receive the citadistribu-tions (i.e., patents or non patent litera-ture). Second, the pattern of such cross-sectional heterogeneity is rather invariant over time. These two properties are crucial for the plausibility of some of the assumptions of our meth-odology, and therefore deserve a detailed illustration.
Table 2 introduces our sectors and also gives a number of indicators regarding the sector-level heterogeneity in citation behavior for patents of 1992. As we will argue below, the 1992 values are representative of the period until the early 2000s. The first column of the table in-dicates the average number of citations per patent for each of the 19 sectors. The following two columns break these averages down to the average number of non patent literature cita-tions and the average number of patent (i.e., patent literature) citacita-tions (the first column is the
sum of the second and the third columns). The fourth column gives the share of non patent literature citations in all citations (i.e., the fourth column is the ratio of the second column to the first column). The sectors are sorted in a descending order according to the second col-umn.
For all 4 variables, of the 19 sectors, 12 have a value below the (unweighted) average, 5 sectors have a value between the average and one standard deviation above it, and 2sectors show a value above the average plus one standard deviation. The sectors that are above aver-age are almost all usually considered as high- or medium-tech (food products and non-ferrous basic metals are the exceptions). Two sectors stand out from the sample: pharmaceuticals and food products. Both sectors, or at least part of their cutting-edge technologies as reflected in our database, have a stronghold in biotechnology. The pharmaceuticals sector is obviously known as a strongly science-based sector, and the high citation rate is in line with this im-pression (Narin, Hamilton and Olivastro, 1997). ICT-related sectors (computers and office machinery, and electronics) rank as above average, and so does chemistry (excl. pharmaceu-ticals). Non-ferrous basic metals is also somewhat of a surprise in the top-list of citation rates.
Among all these four indicators the extent of heterogeneity is the highest in the number of NPL citations per patent (the coefficient of variation is around 120%) and lowest in the num-ber of patent citations per patent (the coefficient of variation is around 12%). The first, sec-ond and the fourth columns are highly correlated with each other (correlation coefficients around 95%), while the correlation between any of these three with the third column is posi-tive yet lower (around 50-60%).
Sector
Citations
per patent NPL citations per patent
PL citations Share of NPL per patent citations in all
citations
Pharmaceuticals 4.347 1.907 2.440 0.439
Food products 3.672 1.435 2.237 0.391
Unweighted mean+standard deviation 3.283 1.058 2.303 0.308
Electronics 3.124 1.052 2.072 0.337
Computers and office equipment 3.231 0.983 2.248 0.304
Non-ferrous basic metals 2.922 0.826 2.096 0.283
Chemistry 3.048 0.622 2.426 0.204
Instruments 2.811 0.613 2.197 0.218
Unweighted mean 2.645 0.568 2.077 0.191
Ferrous basic metals 2.485 0.564 1.922 0.227
Stone, clay and glass products 2.576 0.532 2.044 0.206
Electrical machinery 2.359 0.476 1.883 0.202
Paper and printing 2.389 0.360 2.029 0.151
Other manufacturing 2.235 0.238 1.997 0.106 Textiles 2.235 0.224 2.011 0.100 Metal products 1.966 0.210 1.756 0.107 Other transport 1.923 0.186 1.737 0.097 Other machinery 2.086 0.177 1.909 0.085 Oil refining 2.745 0.176 2.569 0.064 Motor vehicles 2.054 0.128 1.926 0.062
Rubber and plastic products 2.040 0.082 1.958 0.040
Table 2. Patent-to-patent (PL) and non patent literature (NPL) citations per patent, 1992