NBER WORKING PAPER SERIES
CHINA'S EXPORTERS AND IMPORTERS: FIRMS, PRODUCTS AND TRADE PARTNERS
Kalina Manova Zhiwei Zhang Working Paper 15249
http://www.nber.org/papers/w15249
NATIONAL BUREAU OF ECONOMIC RESEARCH 1050 Massachusetts Avenue
Cambridge, MA 02138 August 2009
We thank Doireann Fitzgerald, Pete Klenow and Bob Staiger for insightful conversations, and participants at the 2008 LSE conference on the Emergence of China and India in the Global Economy, the 2008 SITE conference on Aggregation in Macro, and the 2008 San Francisco Federal Reserve Pacific Basin Conference for their comments. The views expressed herein are those of the author(s) and do not necessarily reflect the views of the National Bureau of Economic Research.
NBER working papers are circulated for discussion and comment purposes. They have not been peer-reviewed or been subject to the review by the NBER Board of Directors that accompanies official NBER publications.
© 2009 by Kalina Manova and Zhiwei Zhang. All rights reserved. Short sections of text, not to exceed two paragraphs, may be quoted without explicit permission provided that full credit, including © notice, is given to the source.
China's Exporters and Importers: Firms, Products and Trade Partners Kalina Manova and Zhiwei Zhang
NBER Working Paper No. 15249 August 2009
JEL No. F10,F14,F23
ABSTRACT
This paper uses newly available data on Chinese trade flows to establish novel and confirm existing stylized facts about firm heterogeneity in trade. First, the bulk of exports and imports are captured by a few multiproduct firms that transact with a large number of countries. Second, the average importer imports more products than the average exporter exports, but exporters trade with more countries than importers do. Third, compared to private domestic firms, foreign affiliates and joint ventures trade more and import more products from more source countries, but export fewer products to fewer destinations. Fourth, the relationship between firms’ intensive and extensive margin of trade is non-monotonic, differs between exporters and importers, and depends on the ownership structure of the firm. Fifth, firms frequently exit and re-enter into trade and regularly change their product mix and trade partners, but foreign firms exhibit less churning. Finally, most of the growth in Chinese exports between 2003-2005 was driven by deepening and broadening of trade relationships by surviving firms, while reallocations across firms contributed only 30%. These stylized facts shed light on the cost structure of international trade and the importance of foreign ownership for firms’ export and import decisions.
Kalina Manova Department of Economics Stanford University 579 Serra Mall Stanford, CA 94305 and NBER manova@stanford.edu Zhiwei Zhang
Hong Kong Monetary Authority and IMF
1 Introduction
A growing body of empirical literature has examined firms’ participation in international trade and identified substantial heterogeneity in activity across firms. More productive firms have been shown to earn higher export revenues, enter more markets, and trade more products. In addition, exporters systematically outperform non-exporters in terms of productivity, employment, wages, skill- and capital-intensity.1 This firm heterogeneity has proven important because of evidence that reallocations across firms are instrumental for the effects of trade liberalization on aggregate productivity growth (Pavcnik 2002; Bernard, Jensen and Schott 2006).
This paper uses newly available and uniquely rich data on the universe of Chinese trading firms to establish new and confirm existing stylized facts about firm heterogeneity among exporters and importers. Our results shed light on the cost structure of international trade and the importance of foreign ownership for firms’ export and import decisions. Our analysis also provides a detailed overview of China’s trade activity and the sources of Chinese trade growth over the 2003-2005 period.
The data we use offer a level of detail that has so far only been available for the United States and is unprecedented for other developed or developing countries. In particular, we observe firm exports and imports by product and destination/source country at a monthly frequency, and have information about the firm ownership structure. By contrast, the prior literature has largely explored data on exporting firms only, which typically lack information along at least one other dimension of our data.2
Our work is closest to that of Bernard, Jensen and Schott (2009), henceforth BJS, who examine the universe of U.S. importers and exporters with similarly rich data. BJS also compare the performance of domestic firms to that of multinational affiliates, although they cannot identify American vs. foreign-owned MNCs. Instead, we distinguish between Chinese private firms, state enterprises, affiliates of foreign multinationals, and joint ventures (foreign ownership under 100%). By virtue of China's size, rapid trade expansion and range of institutional frictions, our
1 See, among others, Bernard and Jensen (1995, 1999) and Bernard, Jensen and Schott (2009) for the U.S.; Bernard and Wagner (1997) for Germany; Clerides, Lach and Tybout (1998) for Colombia, Mexico and Morocco; Aw, Chung and Roberts (2000) for Korea and Taiwan; Eaton, Kortum and Kramarz (2004, 2008) for France; and Bernard, Jensen, Redding and Schott (2007) for a survey of the literature.
2 For example, Eaton, Kortum and Kramarz (2004, 2008) observe French firm exports by destination, but not imports or products; Arkolakis and Muendler (2009) analyze Brazilian firm exports by product and destination, but not imports or ownership type; Muûls and Pisu (2009) study Belgian firm exports and imports by product and destination, but not ownership structure or the universe of trade flows.
data thus offer insight into the factors determining firms' trade participation decisions in general and their salience in constrained environments.
Since joining the World Trade Organization in December 2001, China has experienced rapid international trade expansion and a dramatic rise in multinational firm activity. Between 2003 and 2005 alone, exports grew 86% while imports increased 66%, to reach $548.4 and $483.5 billion, respectively. Chinese joint ventures and affiliates of foreign multinationals were responsible for fully 75% of these trade flows.
These aggregate patterns mask substantial variation in activity and frequent reallocations across firms. We establish six stylized facts about the nature of this firm heterogeneity:
Stylized fact #1: We confirm the result in the prior literature that a substantial share of trade flows are captured by a few multi‐product firms that transact with a large number of countries. While this pattern holds for both exports and imports, the distribution of imports is significantly more skewed and there are many more small firms among importers. These findings are consistent with the existing heterogeneous-firm models of exporting such as Melitz (2003), and suggest that these models apply equally well to importing. The first stylized fact can thus be attributed to firm heterogeneity in marginal costs and country-product specific fixed costs for both exporters and importers. The different distributions for these two sets of firms indicate lower fixed costs of importing relative to exporting and a greater dispersion in productivity (marginal costs) across importers than across exporters.
In comparison, BJS document a substantially more skewed distribution of trade flows, product and trade partner intensity across U.S. firms than the one we observe for China. This difference is driven by the presence of many small American firms that trade a limited number of products with a few countries. These patterns suggest that Chinese firms may face significantly higher fixed trade costs, which raise the productivity cut-off for exporting and importing. Given the higher level of financial development in the U.S. and the evidence that smaller firms are more credit constrained3, small Chinese firms may also be unable to raise sufficient external financing to engage in international trade.4
3 See, for example, Beck, Demirgüç-Kunt, Laeven and Levine (2008), Beck, Demirgüç-Kunt and Maksimovic (2005), and Forbes (2007).
4 Manova (2007) shows that credit constraints reinforce the selection of only the most productive firms into exporting. See Beck (2002, 2003), Becker and Greenberg (2007), and Manova (2007, 2008) among others for country-level evidence and Greenaway, Guariglia and Kneller (2007) and Muûls (2008) for firm-level evidence.
Stylized fact #2: The average importer buys more products than the average exporter sells, but exporters trade with more countries than importers do.5 Similarly, 68% of the firms that engage in two-way trade import more products than they export, and 53% export to more countries than they import from. These patterns are consistent with the idea that many Chinese firms import intermediate products for further processing, final assembly and re-exporting. This could explain why most firms import numerous inputs from a few (potentially low-cost) source countries and transform them into fewer final products for sale in a large number of destinations.
Stylized fact #3: Firms’ trading activity varies systematically with their extent of foreign ownership. Foreign affiliates trade more on average and are more likely to engage in two-way trade than joint ventures, who in turn lead private domestic firms. Moreover, import product intensity and the number of source countries increase with foreign ownership, while export product intensity and the number of destinations decrease with foreign ownership. Compared to private domestic companies, foreign affiliates and joint ventures in fact import more products from more source countries, but export fewer products to fewer destinations.
One possible explanation for these patterns is that domestic firms process a few basic input materials into a broad range of simple final goods, while foreign firms specialize in high-tech complex final products which require the assembly of numerous inputs. This would be consistent with property-rights models of FDI that predict greater multinational activity in R&D intensive sectors.6 Our results may also indicate that foreign firms prefer to source (potentially higher quality) inputs from abroad, while domestic firms use local suppliers.
Relative to domestic companies, foreign affiliates may buy inputs from more countries because they are more efficient at locating and importing inputs from abroad, or because they need specialized inputs that are not available in one location. The results for the number of export destinations appear surprising in the context of heterogeneous-firm models, which predict that more productive firms enter more markets and are more likely to be multinational. Foreign firms, however, may conduct intermediate stages of production in China and re-export unfinished goods for further processing by affiliates in other countries. Since multinationals likely do not maintain affiliates in all final consumer markets, their Chinese branches could record fewer export
5 Since we do not observe the domestic activity of Chinese trading firms, when we refer to the products an importer (exporter) buys (sells), we always mean the products the firm imports (exports).
6 See Antràs (2003) and Antràs and Helpman (2004, 2008) for a theoretical treatment, and Antràs (2003), Yeaple (2006), Nunn and Trefler (2008) and Feenstra and Hanson (2005) for empirical evidence.
destinations than domestic firms. Foreign firms may also produce relatively more specialized intermediate or final goods that only richer countries demand, while domestic firms may focus on standardized inputs or final goods that appeal to producers and consumers in many countries.
Stylized fact #4: The relationship between firms’ intensive and extensive margin of trade differs between exporters and importers and depends on the ownership structure of the firm.
While domestic firms that export or import more products trade less per product, joint ventures and foreign affiliates follow a non-monotonic relationship: exports and imports per product are lowest for firms at an intermediate level of product intensity. At the same time, importers that source products from more countries import more per country regardless of ownership type, while exporters exhibit a U-shape.
These findings contribute to an active literature on the operations of multi-product firms (Bernard, Redding and Schott 2009a,b,c; Arkolakis and Muendler 2009; Mayer, Melitz and Ottaviano 2009; Eckel and Neary 2008; Nocke and Yeaple 2006), which tends to predict a monotonic relationship between firms’ intensive and extensive margins. This relationship is largely determined by the cost structure of trade and the nature of firm competition. The more complex patterns we find suggest that we have yet to understand the economic forces that affect firms’ optimal scope and scale. Our results also indicate the possibility of important differences between firms' exporting and importing costs at the country-product level. Finally, the trade costs firms face and their ability to finance these costs may vary with ownership structure, and thus affect firms’ integration and location decisions.
Stylized fact #5: Firms are prone to exit and re-enter into exporting and importing, and frequently change their trade partners and product mix. Foreign affiliates and joint ventures, however, have significantly higher survival rates and exhibit less product and trade partner turnover than domestic firms. These results complement evidence in the prior empirical literature on the importance of churning for firm- and aggregate productivity.7 They also speak to the relevance of theoretical models of intra-industry firm dynamics and intra-firm product turnover (Melitz 2003; Bernard, Redding and Schott 2009b,c; Costantini and Melitz 2009). In particular, our findings indicate that firms face sufficiently low sunk costs of trade or sufficiently volatile cost/demand shocks to warrant regular adjustments on the extensive margin. The systematic
7 See Pavcnik (2002), Alessandria and Choi (2007), Bernard, Redding and Schott (2009a), Besedes and Prusa (2006a,b, 2007), BJS, Eaton, Eslava, Kugler and Tybout (2008), and Bartelsman, Haltiwanger and Scarpetta (2008).
differences across ownership types signal that foreign firms have higher sunk costs or experience fewer and smaller shocks. If firms face liquidity constraints, the affiliates of foreign multinationals may also be better able to weather negative shocks since they can access internal lending from the parent company.8
Stylized fact #6: The growth in Chinese exports between 2003-2005 was driven by firm entry (30%, aggregate extensive margin), surviving firms expanding exports of surviving products to existing trade partners (42%, firm intensive margin), and surviving exporters adding new products and destinations (28%, firm extensive margin). This breakdown is 27% - 51% - 22% for imports. If one ignored firm heterogeneity and focused on China’s product composition and trade partners in aggregate, almost the entire growth in trade would erroneously be attributed to the intensive margin: Average Chinese trade flows per product and average Chinese trade flows per trade partner increased at roughly the same rate as overall trade. These results indicate that the biggest boost to Chinese trade came from new and surviving firms expanding into products and markets that other firms were already tapping. Thus, understanding firm heterogeneity and firms’ trade decisions is central to understanding movements in aggregate trade flows.
The remainder of the paper is organized as follows. The next section describes the Chinese trade data. Section 3 documents the distribution of trade flows, product scope and trade partner intensity across firms with different ownership structures. Section 4 decomposes China's trade growth into its extensive and intensive margins, while Section 5 explores firm, product and trade partner dynamics. The last section concludes.
2 Data
We analyze a recently released proprietary database on the universe of Chinese firms that participated in international trade over the 2003-2005 period. These data have been collected and made available by the Chinese Customs Office.
We observe the value of firm exports and imports (in US dollars) by product and trade partner for 243 destination/source countries and 7,526 different products in the 8-digit Harmonized System.9 Each firm is assigned one of seven possible ownership types, which we
8 See, for example, Desai, Foley and Forbes (2008) for evidence that the affiliates of foreign multinationals are less credit constrained relative to domestic firms.
9 The classification of products is relatively consistent across countries at the 6-digit HS level. The number of distinct product codes in the Chinese 8-digit HS classification is comparable to that in the 10-digit HS trade data for the U.S..
group into four categories: domestic state enterprises, domestic privately held firms (including collectively-owned firms), fully foreign-owned affiliates, and joint ventures (with foreign ownership under 100%). While the data are available at a monthly frequency, for most of the analysis we focus on annual trade flows in the most recent year in the panel, 2005. We use higher frequency data to examine firm, product and trade partner dynamics in Section 5.
The data contain a number of additional variables which we do not exploit in this paper. For each (firm, trade partner, product) triplet, we observe the means of transportation (out of 19 options such as air, ship, etc.), the customs office where the transaction was processed (out of 42 offices), the region or city in China where the product was exported from or imported to (out of 710 locations), and any potential transfer country or region (such as Hong Kong). The dataset also provides information on the quantities traded in one of 12 different units of measure (such as pieces, kilograms, square meters, etc.).
Some state enterprises in China are pure “trading” companies in the sense that they do not engage in manufacturing but serve exclusively as intermediaries between domestic producers (buyers) and foreign buyers (producers). We focus on the operations of firms that manufacture and trade goods, and leave the study of “trading” companies for future work. While the data do not explicitly identify such “trading” firms, we look for keywords in company names to flag them.10 We can nevertheless not be sure that we have excluded all such enterprises, and comment on this as appropriate. In the rest of the paper, we refer to all firms remaining in our data as trading firms.
3 China’s trading firms, traded products and trade partners
In this section, we document the distribution of exports and imports across firms of different ownership type, and examine their product and trade partner intensity. We also explore the relationship between the extensive margin (number of products or trade partners) and the intensive margin of trade (average trade per product or per trade partner) at the firm level. We first describe a range of patterns in the data, and then highlight our most important findings as four stylized facts.
3.1 Exporting and importing firms
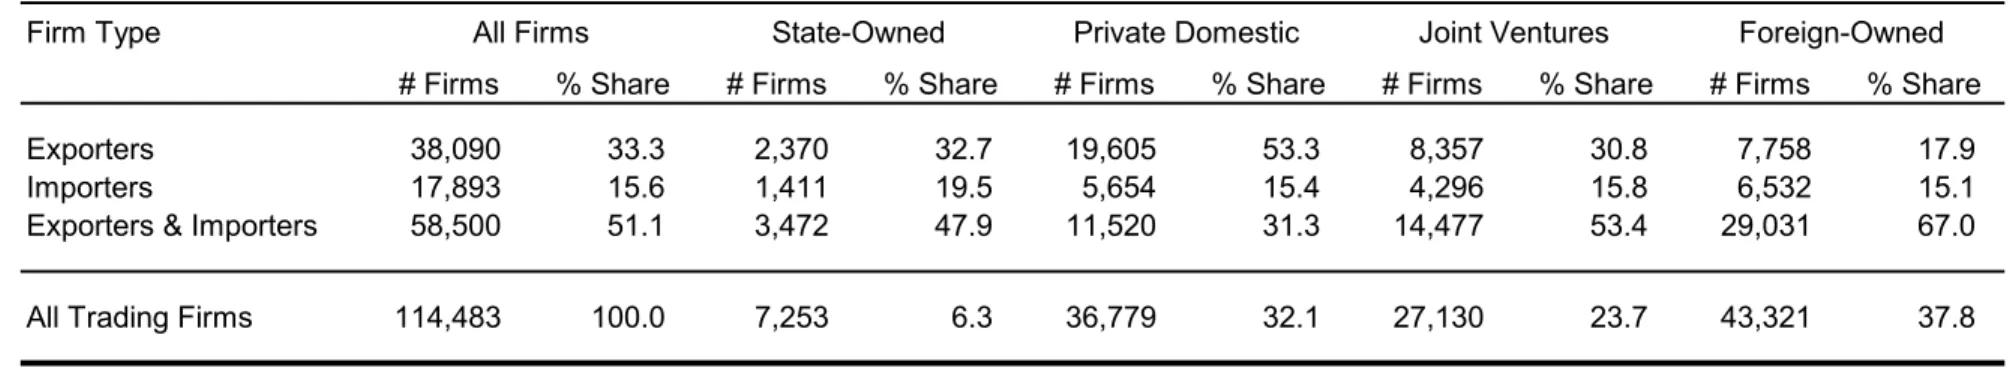
In 2005, 114,483 Chinese firms participated in international trade. As Table 1 shows, more than half of these firms engaged in both exporting and importing. However, this ratio varies significantly across firms with different ownership structure. Fully foreign-owned firms are substantially more likely to conduct two-way trade (67%) than joint ventures (53%) and state enterprises (48%), which are in turn more likely to do so than privately held domestic firms (31%). These numbers are markedly higher than the ones BJS report for the United States, where only 17.5% of all trading firms both exported and imported in 2000. Moreover, in the U.S. this share is similar for domestic and multinational firms.
While the fraction of Chinese firms that only import but do not export is roughly 15% regardless of organizational structure, the share of firms that only export decreases with foreign ownership.11 This is consistent with the idea that multinational companies (MNCs) operating affiliates in China are likely to import intermediate inputs for further processing or final assembly before re-exporting to third destinations. By splicing the production chain into tasks with different factor intensities, MNCs can thus exploit cross-country differences in factor prices.12
Table 2 shows the total value of Chinese trade flows and its breakdown by firm ownership type. In 2005, China's exports and imports amounted to $548.2 billion and $483.3 billion, respectively. Fully 90% of all trade was conducted by firms that both export and import. While foreign affiliates represented 38% of all trading firms, they captured half of all exports and imports. Joint ventures accounted for a quarter of all firms and of aggregate trade flows. Privately held domestic firms were more than five times as numerous as state enterprises (see Table 1), but they traded less on average and were considerably less likely to both export and import. For these reasons, private domestic companies contributed significantly less to exports (13%) than their numbers would suggest (32%), while state-owned firms (6.3% of all firms) claimed a larger than proportional share of exports (10.3%). This pattern is even more extreme for imports.
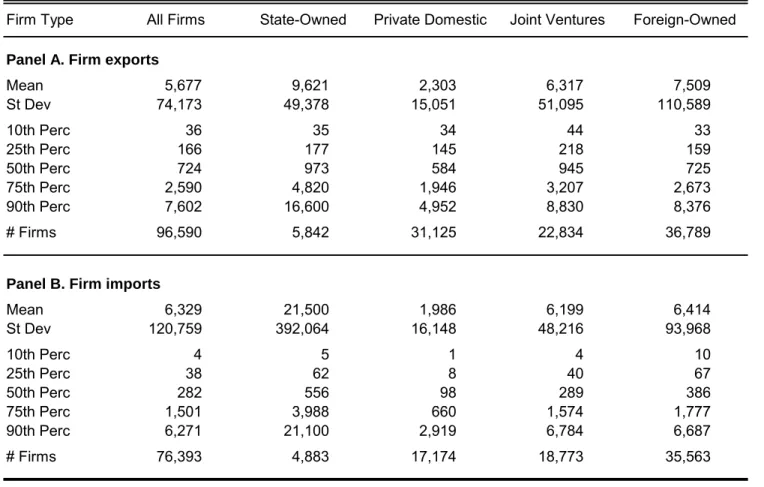
In line with existing stylized facts for other countries, the distribution of trade flows across Chinese firms is extremely skewed. As Table 3 illustrates, firms at the 90th percentile by export value export over 200 times more than firms at the 10th percentile. This ratio is an astounding 1,700 for importing firms. This difference is mostly driven by a fatter left tail in the distribution of
11 Throughout the paper, when we say that a variable increases in foreign ownership, we mean that it is higher for foreign firms than for joint ventures, and in turn higher for joint ventures than for private domestic firms.
imports than exports: While importers tend to buy less than exporters sell at any percentile level, this gap is greatest among the very small trading firms.
Simple averages suggest that state enterprises trade greater volumes than foreign affiliates, which have a slight advantage over joint ventures and a more pronounced lead over private domestic firms. These differences are, however, driven by the top 25% of state-owned firms and a generally longer and fatter right tail in their distribution of trade flows. Given that a sizeable share of state enterprises serve as intermediaries between domestic and foreign buyers and producers without manufacturing in-house, this pattern may indicate that the filter we used did not exclude all state trading companies.
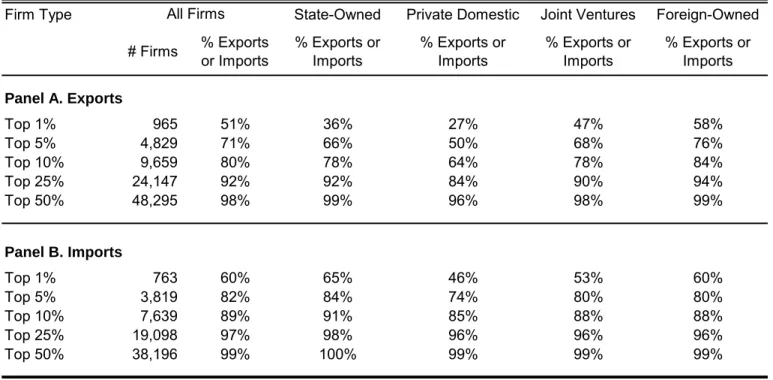
As these skewed distributions would imply, the vast majority of Chinese trade is conducted by a few very active firms (Table 4). The top 1% firms in terms of trade flows are responsible for 51% and 60% of all exports and imports, respectively, while the top 10% firms capture 80%-90% of all trade. By contrast, the bottom half of all exporters account for less than 2% of China's exports, and the bottom 75% importers channel less than 3% of China's imports.
Among private firms, the concentration of exports and imports in the top 1%-5% firms increases with foreign ownership. In other words, the data exhibit progressively greater skewness as one moves from private domestic firms to joint ventures to foreign affiliates. The distribution of trade flows across state enterprises does not fit neatly into this ordering as it is much more concentrated for imports than for exports. This pattern may once again reflect the presence of misclassified large trading companies.
In comparison, BJS report a substantially more skewed distribution for the United States, where the top 1% firms perform 81% of U.S. trade. This suggests that there is a fringe of firms which can viably export and import at a small scale in the United States, but not in China. We return to this observation in Section 3.4.
3.2 Exporters’ and importers’ product intensity
There is tremendous variation in product and trade partner intensity across Chinese exporters and importers. There are also some systematic differences across firms of different ownership type.
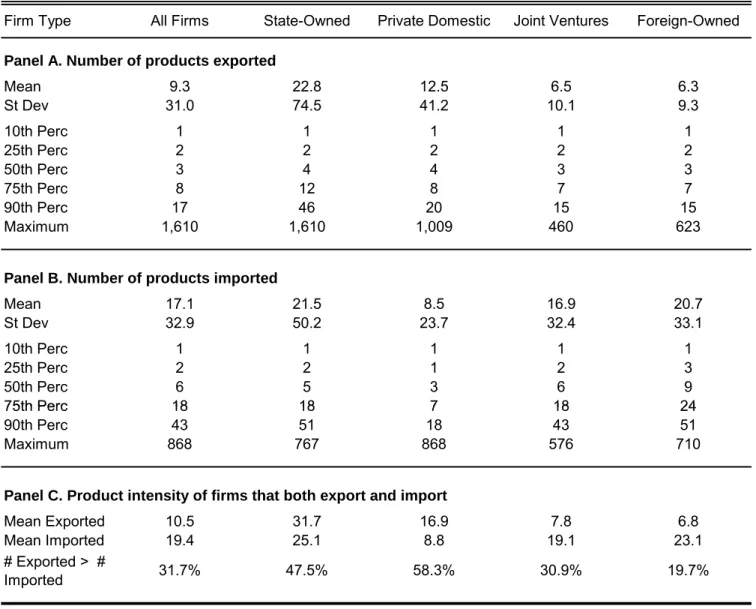
On average, Chinese importers transact in more products than exporters, although the distribution of product intensity has a much longer right tail among exporters. As Table 5 shows, the average number of products traded is 9.3 for exporters and 17.1 for importers, where goods are
classified according to the 8-digit HS system. This comparison, however, masks important differences across firms with different organizational structures. Note first that state enterprises have a higher than average product intensity, and import and export roughly the same number of goods on average (21.5 and 22.8, respectively). Some transact in the broadest range of goods observed across all firms, reaching a maximum of 1,610 products exported and 767 products imported.13 These are likely trading companies that engage in little or no manufacturing which our filter has not identified.
Interesting patterns emerge among private firms. In absolute levels, average import product intensity increases with foreign ownership, while the converse is true of exports. However, foreign affiliates and joint ventures import roughly three times as many products on average as they export. By contrast, the average domestic firm exports 50% more products than it imports. Similarly, the maximum number of products traded by any foreign firm or joint venture is higher for importers than for exporters, while the converse holds for private domestic firms.
These patterns are confirmed in the sample of Chinese firms that both export and import (Panel C of Table 5). Such firms tend to transact in more products than firms which engage in one-way trade only, and for this reason their mean number of goods exported (10.5) and imported (19.4) exceeds the averages reported in Panels A and B. This comparison holds within each firm ownership group as well. Among private firms, average import product intensity once again increases with foreign ownership, while the converse is true of exports. Moreover, only 19.7% of foreign affiliates export more products than they import, while that share rises to 30.9% for joint ventures and 58.3% for private domestic firms. In the full sample, this fraction is 31.7%. In other words, the systematic variation of the average export and import product intensity with foreign ownership is not an artifact of aggregating across firms but is true at the firm level as well.
How can these patterns be explained? One possible interpretation is that the composition of firm ownership varies systematically across sectors, and sectors differ in their input-output characteristics. For example, private domestic firms may be most active in industries that process a few basic input materials into a broad range of final goods. A firm may thus import a unique product, such as cotton textile, and produce a range of different products – for instance, various clothing pieces – that would be recorded as separate HS-8 export categories. Similarly, a plastic or steel manufacturer may import a single raw material and export a range of products such as toys,
buttons and kitchen bowls. On the other hand, firms with partial or full foreign ownership may specialize in high-tech industries that produce a limited number of complex final goods which require the assembly and processing of numerous customized inputs. A number of papers have in fact argued that, in the presence of imperfect contractibility and relationship specific investments, there will be more multinational activity in R&D intensive sectors.14 In unreported summary statistics, we have confirmed that foreign firms indeed capture a substantially larger share of Chinese trade flows of differentiated manufactured goods and R&D intensive sectors.
The above explanation implicitly assumes that, within a given industry, all firms are equally likely to import their intermediate inputs instead of buying them domestically, as well as to export their final products instead of only selling them locally. An alternative and complementary explanation may be that foreign affiliates and joint ventures prefer to source inputs from abroad while domestic firms use local suppliers, even if they tend to produce similar output products. For example, foreign firms may produce higher-quality goods using better technology and choose to import higher-quality inputs that may not be available in China.
While this could account for the patterns we document for import product intensity, it would not explain the systematic differences in export product intensity across firm ownership types. If anything, one would expect foreign affiliates and joint ventures to be more likely to export a good, conditional on producing it. This is particularly true of China, which has traditionally attracted more vertical and export-platform FDI than horizontal FDI. Indeed, a much bigger share of foreign firms than private domestic firms in China engage in both exporting and importing (recall Table 1).
In addition to summarizing the average product intensity across exporters and importers, Table 5 also reports the number of products traded by firms at different percentiles of the distribution. These statistics illustrate the extent of skewness in the data. Roughly 75% of all firms have a narrower product scope than the mean, while firms at the 90th percentile transact in twice as many products as the average firm. These patterns appear independent of firms’ organizational structure and highlight the importance of firm heterogeneity in the data.
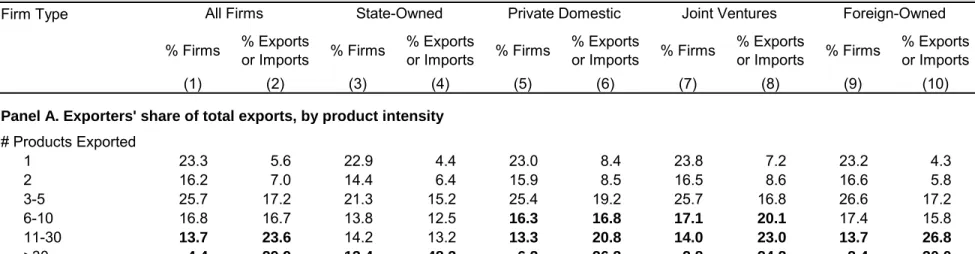
The lion's share of China's trade is conducted by a few firms that trade the broadest range of products. Table 6 reports the distribution of firms across different bins by product intensity
14 See Antràs (2003) and Antràs and Helpman (2004, 2008) for a theoretical treatment, and Antràs (2003), Yeaple (2006), Nunn and Trefler (2008) and Feenstra and Hanson (2005) for empirical evidence.
(odd-numbered columns) and the percent share of total exports or imports firms in each bin capture (even-numbered columns). While 23% (19%) of all exporters (importers) trade exactly one product, they mediate only 5.6% (2.2%) of all exports (imports). By contrast, only 4.4% of exporters sell more than 30 products, but they contribute 30% to all exports. Similarly, only 2.6% of importers buy more than 100 products, but they account for 42% of all imports. These patterns are qualitatively the same in each subset of firms with a given ownership structure.
BJS report a significantly more skewed distribution of trade flows across product intensity bins for the United States. In 2000, fully 38% of U.S. exporters and 32% of U.S. importers traded only one product, but they captured a mere 0.7% of all trade. By contrast, 15% of U.S. exporters and 21% of U.S. importers transacted in more than 10 products, but mediated over 92% of U.S. trade. Combined with the conclusion from the end of the previous section, this suggests that firms which optimally trade small volumes in a few (or even only one) products may be viable in the United States but not in China.
3.3 Exporters’ and importers’ trade partner intensity
The average Chinese exporter transacts with almost twice as many trade partner countries (7.5) as the average importer (4), as seen in Table 7. Similarly, the maximum number of export destinations observed for any firm is 144, while the most active importer sources products from only 67 origin countries. These patterns hold within each of the four groups of firms with different ownership structure as well. However, the difference between the average exporter and importer trade partner intensity is largest for domestic firms (both state-owned and privately-held), lower for joint ventures, and smallest for foreign affiliates.
Perhaps surprisingly, foreign firms on average export to fewer destination markets (6) than joint ventures (7.4), which in turn sell to fewer countries than private domestic firms (8.7). By contrast, importers exhibit the opposite ranking, with foreign firms sourcing products from more countries than private domestic companies. Chinese state enterprises transact with the greatest number of destination markets (11.2) and source countries (5.6) on average, although these averages may partly reflect the activity of trading companies that our filter has not detected.
Similar patterns persist in the sample of firms that engage in both exporting and importing. These firms maintain trading relationships with more countries on average, with a mean export and import trade partner intensity of 8.2 and 4.3, respectively. Once again, the average number of
source countries increases with foreign ownership, while the average number of export destinations falls. Moreover, while 44% of foreign affiliates export to more countries than they import from, this fraction is 53.6% for joint ventures and 70.6% for private domestic firms. In the full sample of firms participating in two-way trade, this share is a little over a half. In other words, the reason why foreign firms have more export destinations than source countries on average, and conversely for domestic firms, is because that is true of most firms that both export and import.
What factors drive these patterns? Relative to domestic companies, firms with full or partial foreign ownership may buy intermediate inputs from more countries because they are more efficient at locating and importing inputs from abroad, or because they need specialized inputs that are not available in one location. Since we do not observe firms’ domestic purchases, our results may also indicate that foreign firms prefer to source (potentially higher quality) inputs from abroad, while domestic firms use local suppliers.
The results for the number of export destinations are, on the other hand, somewhat surprising since heterogeneous firm models predict that more productive firms enter more markets and are more likely to be multinational. A number of explanations may account for foreign firms' relatively lower number of export destinations. MNC affiliates and joint ventures may conduct intermediate stages of production in China and re-export unfinished goods for further processing to affiliates in other countries. Since multinationals likely do not maintain affiliates in all final consumer markets, their Chinese branch may record fewer export destinations than domestic firms even if they have final consumers in as many or more countries. An alternative but not contradictory explanation is that foreign firms may produce more specialized intermediate or final goods that fewer, richer countries demand. Domestic firms, on the other hand, may focus on standardized intermediate inputs or cheap, basic final goods that appeal to producers and consumers in many countries. This explanation would also be consistent with the property rights view of multinational operations discussed in the previous sub-section, according to which FDI activity is concentrated in R&D intensive sectors.
As with firms' product intensity, the distribution of trade partner intensity across Chinese firms is also very skewed. This is apparent from Table 7, which reports the number of export destinations and source countries for firms at different points in the distribution. The average firm transacts with twice as many countries as the median, while firms at the 90th percentile maintain trade relationships with 4 to 6 times as many countries as the median company. These patterns are
largely invariant across organizational structures, and are yet another manifestation of the extent of firm heterogeneity in the data.
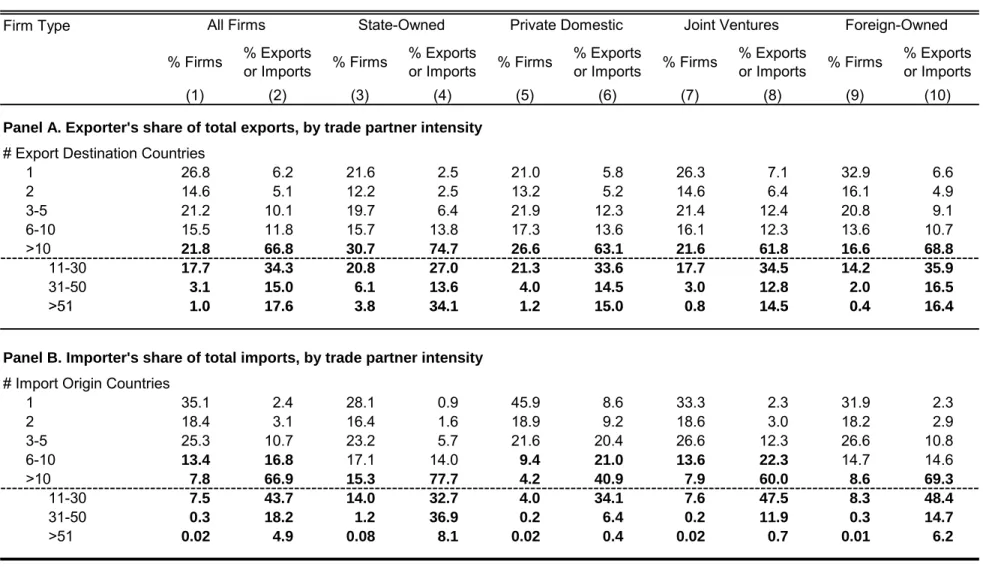
The bulk of China's trade is conducted by a few firms that transact with the greatest number of countries. Table 8 presents the distribution of firms across bins with varying trade partner intensity (odd-numbered columns) and the percent share of total exports or imports that firms in each bin capture (even-numbered columns). While 27% (35%) of all exporters (importers) trade with exactly one country, they account for only 6.2% (2.4%) of all exports (imports). By contrast, the 4.1% of exporters that sell to more than 30 markets mediate fully one third of all exports. The distribution of imports across firms is even more skewed: only 0.3% of importers source products from over 30 countries, but they contribute almost a quarter of all imports. The 22% (8%) of exporters (importers) that transact with at least 11 countries channel two thirds of China's trade.
The results in Table 8 once again highlight important differences between Chinese and U.S. firms. BJS document a significantly more skewed distribution of trade flows across firms with different trade partner intensity in the United States. In 2000, for example, while more than half of all U.S. trading firms transacted with exactly one country, they captured less than 4% of all trade flows. On the other hand, 8% (4%) of U.S. exporters (importers) traded with more than 10 countries, but were responsible for 78% (86%) of U.S. exports (imports).
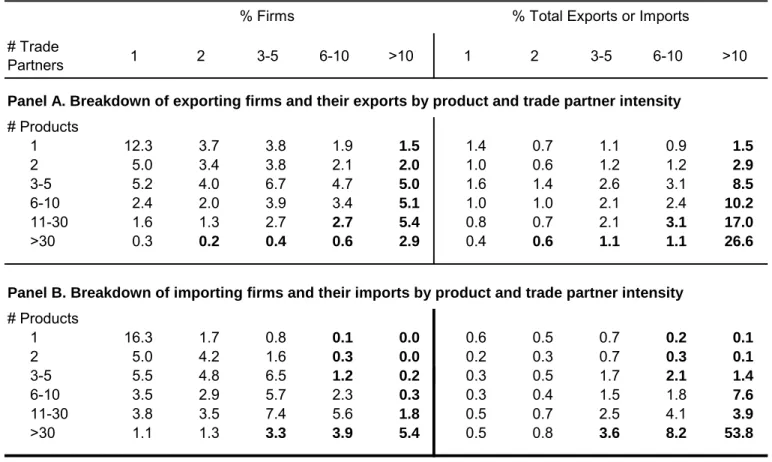
Combining our results for product and trade partner intensity, we conclude that China's exports and imports are concentrated in a few multi-product firms that transact with a large number of destination or source countries. The left half of Table 9 illustrates the joint distribution of firms by product intensity (rows) and trade partner intensity (columns), while the right half of the table records the percent share of total exports or imports that firms in each bin capture. Bold entries identify groups of firms that mediate a larger than proportional fraction of trade flows.
Most firms trade a few products with a few countries and enter in the upper left corner of the table. However, the lion's share of trade is channeled by the few firms that are active in many products and countries in the lower right corner, where most bold entries are concentrated. For example, 12.3% (16.3%) of all exporters (importers) trade exactly one product with one country, but their trade flows amount to only 1.4% (0.6%) of all exports (imports). By contrast, the 2.9% exporters and 5.4% importers who trade over 30 products with more than 10 countries are responsible for 27% and 54% of total Chinese exports and imports, respectively.
3.4 Summarizing the evidence on firm heterogeneity
The results presented above emphasize different dimensions and manifestations of firm heterogeneity in the data. We highlight three stylized facts that we consider most important:
Stylized fact #1: The bulk of trade is concentrated in a few multi‐product firms that transact with a large number of countries. This pattern holds for both exports and imports, but the distribution of imports is significantly more skewed and there are many more small firms among importers.
Stylized fact #2: The average importer buys more products than the average exporter sells, but exporters trade with more countries than importers do. 68% of all firms that engage in two-way trade import more products than they export, and 53% export to more countries than they import from.
Stylized fact #3: Foreign affiliates trade more on average and are more likely to engage in two-way trade than joint ventures, who in turn lead private domestic firms. Import product intensity and the number of source countries increase with foreign ownership, while export product intensity and the number of destinations decrease with foreign ownership.
The first stylized fact is consistent with the Melitz (2003) model of exporting which emphasizes firm heterogeneity in marginal production costs and country specific fixed costs of exporting. In that framework, there is a productivity cut-off for exporting associated with each destination, and all firms above this threshold enter the market. Thus, more productive firms will enter more markets and export more in each destination. Similarly, Bernard, Redding and Schott (2009a,b) show that in a world with multi-product firms and destination-product specific fixed costs, more productive firms will likely sell greater volumes of more products to more countries. Firm heterogeneity in marginal costs can thus account for the skewed distributions we document for export flows, product and trade partner intensity, and explain the concentration of aggregate trade flows among the most active firms.
Our results suggest that export models with firm heterogeneity apply equally well to importing. The more skewed distributions we find for importers relative to exporters indicate that the fixed costs of importing are likely lower, while the dispersion in productivity across importers is greater than that across exporters. Such differences could make low levels of imports optimal for some firms but low levels of exports unfeasible.
The second and third stylized facts we establish are novel and have yet to be embedded in international trade models. We have already offered some possible explanations for these results, which build on existing theories of outsourcing (firms’ production location decision) and multinational activity (firms’ integration decision). In particular, the patterns we find are consistent with the idea that many Chinese firms import intermediate products for further processing, final assembly and re-exporting. This would explain why most firms import numerous inputs from a few low-cost source countries and transform them into fewer final products for sale in a large number of destinations. Explaining the variation in these patterns across firms with different levels of foreign ownership, however, remains an open question for future work.
Of note, BJS document a substantially more skewed distribution of trade flows, product and trade partner intensity across U.S. firms than the one we observe for China. This difference is driven by the presence of many small American firms that trade small volumes of a limited number of products with a few countries. One possible rationalization for these patterns is that Chinese firms face significantly higher fixed trade costs, which raise the productivity cut-off for exporting and importing and preclude small firms from participating in international trade.
An alternative explanation may rest on differences in firms' access to external financing. A number of recent papers have argued that financial frictions limit firms' ability to become exporters and to export larger volumes. For example, Manova (2007) proposes a Melitz (2003) type model in which firms face credit constraints in the financing of export costs and financial contractibility varies across countries. In that framework, the productivity cut-off for exporting is lower and more firms become exporters in economies with better financial development. This implies that less productive, small firms which would optimally export to only the most profitable destinations are more likely to survive in financially developed countries.15 Moreover, in the presence of destination specific fixed costs of exporting, firms that do export enter more markets when they have easier access to external financing. An extension of this model with product-market specific fixed export costs could generate similar results for firms' product intensity. Finally, similar predictions would hold for importing in the presence of fixed import costs and heterogeneity in marginal costs across importers.
15 These predictions dovetail with evidence in the corporate finance literature that smaller firms are more credit constrained. See, for example, Beck, Demirgüç-Kunt, Laeven and Levine (2008), Beck, Demirgüç-Kunt and Maksimovic (2005), and Forbes (2007).
Given the higher level of financial development in the United States, smaller firms may find it easier to raise sufficient external financing and to engage in international trade when they are based in the U.S.. It may thus be possible for less productive firms that optimally trade a limited number of products with a few countries to survive in the U.S. but not in China. This would explain the more skewed distributions BJS document for the United States.
Our results for the variation in trade flows across firms with different ownership structures provide further evidence consistent with this explanation. Foreign affiliates, and to a lesser degree joint ventures, have access to internal financing from their parent or related foreign company.16 For that reason, foreign-owned firms may perform better than joint ventures, which may in turn lead private domestic firms. At the same time, relative to private ownership, state ownership facilitates access to local financing from China's state banks. This may explain why state enterprises outperform private domestic firms in the data, and are in some respects comparable to foreign firms. In ongoing work, Manova, Wei and Zhang (2009) find econometric support for this credit constraints hypothesis by exploiting the variation in ownership structure across firms and the variation in external finance dependence across sectors.
3.5 Firms’ intensive and extensive margin of trade
We next study the relationship between the extensive and intensive margins of trade at the firm level, and find that firm ownership and trade profile play an important role.
Figure 1 shows that in the full sample of trading firms, product scope is negatively correlated with product scale for both exporters and importers. The horizontal axis indicates bins of firms with a given range of products traded, while the vertical axis plots the average value of exports or imports per product across all firms with a given product intensity. Although the graphs are downward sloping, the simple correlation between product intensity and product scale is close to zero for both exporters (-0.015) and importers (-0.004).
These weak correlations, however, mask important differences between Chinese and foreign firms. Figure 2 illustrates the relationship between the extensive and intensive margins of trade for firms of different organizational structure. Private domestic firms that trade more products trade less per product. Among foreign affiliates and joint ventures, on the other hand, this
16 See, for example, Desai, Foley and Forbes (2008) for evidence that foreign affiliates respond faster and more effectively to profitable export opportunities than domestic firms by relying on funding from the parent company.
relationship is non-monotonic and follows a U-shape: trade per product is lowest for firms with an intermediate level of product intensity. This pattern holds for both exporters and importers.17
These results contribute to an active recent literature on the operations of multi-product firms. A few different, opposing forces could generate either a positive or a negative relationship between the extensive and the intensive margin.Assume first that all products potentially available to a firm are identical in terms of cost structure and profitability. When firm economies of scale are more important than product economies of scale, larger firms should both produce/export more products and produce/export more per product. This would be the case if, for example, technological know-how, managerial control and marketing research were easily deployable across products. On the other hand, firms may face limited managerial capacity and experience diminishing returns to scope but increasing returns to scale. When the latter effect dominates, the intensive and extensive margins would be negatively correlated.
In recent work, Bernard, Redding and Schott (2009b) propose that firms draw productivity levels and firm-country-product specific demand shocks. In this framework, the products available to a firm differ in their profitability. While higher firm productivity raises export revenues across all goods and induces a positive correlation between product scope and average product scale, more productive firms also export less profitable products on the margin. The model is thus consistent with either a positive or a negative correlation between a firm's intensive and extensive margin. Similarly, an extension of the Manova (2007) model to multi-product firms could generate similar predictions. If firms offer a range of products with varying profitability, they would choose to export the most profitable goods subject to their credit constraint. Thus, firms would optimally expand their product range in decreasing order of product profitability until they have exhausted the external financing available to them. More productive firms that face less financial constraints will go further down this product ladder, record higher product intensity, and have lower product scale because they will sell smaller values of less profitable goods on the margin. Arkolakis and Muendler (2009) derive a positive correlation in an alternative model, and find empirical support for it in Brazilian firm-level exports data.18
Our results suggest that the credit constraints and limited managerial capacity effects may dominate in the case of domestic firms in China (both state-owned and privately-held). As for
17 The relationship is also non-monotonic (inverted U-shape) for state enterprises.
18 See also Eckel and Neary (2008) who study cannibalization effects among a firms' products and Nocke and Yeaple (2006) who assume that unit costs of all products increase with the range of products produced.
foreign affiliates and joint ventures, they appear subject to the same forces to a lesser degree, potentially because they have access to internal financing or higher skilled management. The U-shape these firms exhibit suggests that they also experience powerful increasing returns to scale. One possible explanation for this distinction is that foreign firms operate in sectors intensive in technological knowledge and generalizable firm-level ability that can be deployed across products.
We also examine the relationship between firms’ intensive and extensive margin of trade by looking at their trade partner intensity and average exports (imports) per country. As Figures 3 and 4 show, we no longer observe sharp differences across firm ownership types. Instead, firms’ trade profile becomes important: Importers which source products from more countries import more per country regardless of ownership type (correlation coefficient 0.13). Exporters, on the other hand, exhibit a U-shape (correlation coefficient -0.01): average exports per destination are lowest for firms in the middle of the distribution by number of trade partners. By contrast, BJS report a positive correlation between trade partner intensity and average trade per country for U.S. exporters and importers.
Taken as a whole, the earlier evidence and our own results suggest that we have yet to understand a range of firm-level decisions in international trade. Our findings indicate that there may be important differences between the cost structure of exporting and importing at the country-product level which affect firms’ optimal scope and scale. The trade costs firms face and their ability to finance these costs may also vary with ownership structure, and thus influence firms’ integration and location decisions. Finally, the disparities across country studies highlight the importance of the institutional environment in which firms operate. Without restating the specific patterns we document, we summarize our results as follows:
Stylized fact #4: The relationship between firms’ intensive and extensive margin of trade differs between exporters and importers and depends on the ownership structure of the firm.
4 Decomposing China’s trade expansion
In 2003, China's aggregate exports and imports amounted to over $290 billion each. Over the next two years alone, the cumulative growth rate of trade was an astonishing 86% for exports and 66% for imports. Since China joined the World Trade Organization only in December 2001, this rapid trade expansion is part of China's fast convergence to a new steady state of integration in world
markets. This section examines this process and decomposes China's trade growth into its extensive and intensive margins.
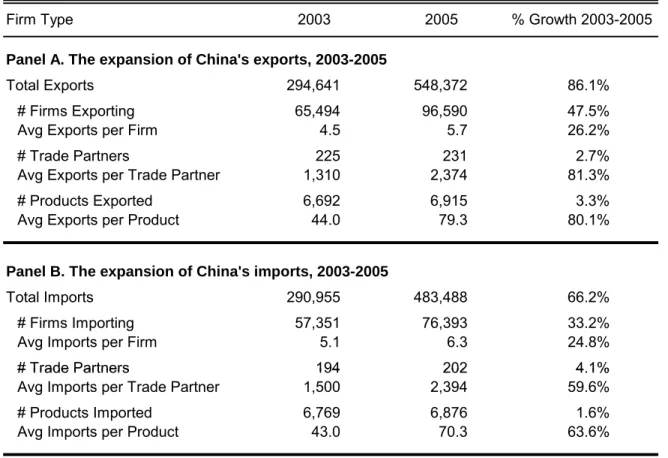
We first describe the evolution of the number of trading firms in China and the number of products and countries China as a whole traded with. As Table 10 indicates, the number of exporters increased 48% from 65.5 thousand in 2003 to 96.6 thousand in 2005, while the number of importing firms grew by a third, from 57.4 to 76.4 thousand. Average exports and imports per firm expanded as well, at a more moderate rate of 25%.
If one ignored firm heterogeneity and focused on China’s product composition and trade partners in the aggregate, almost the entire growth in trade would erroneously be attributed to the intensive margin: Average Chinese exports and imports per product increased at roughly the same rate as overall trade, with only a 2-3% broadening of product scope. Similar patterns hold for China's number of trade partners and average trade flows per country. These results indicate that the biggest boost to Chinese trade came from new and surviving firms expanding into products and markets that other firms were already active in. Thus, understanding firm heterogeneity and firms’ trade decisions is central to understanding movements in aggregate trade flows.
The 2003-2005 period of Chinese trade expansion provides an opportunity to do so. To that end, Table 11 presents a more detailed decomposition of China's trade growth by distinguishing between surviving exporters and importers (which traded in 2003 and 2005), new firms (which did not trade in 2003 but did in 2005) and exiting firms (which stopped trading between 2003 and 2005). More than 70% of Chinese trade growth can be attributed to surviving firms expanding their trade flows. New exporters and importers contributed about 30%, while exiting firms slowed down trade by only 1%.
The expansion of trade flows by surviving firms resulted from important adjustments on both the intensive and the extensive margin. Two thirds of surviving firms’ growth (60%=42.2%/70.1% for exporters and 70%=50.7%/72.8% for importers) reflect deepening in trade flows within existing trade partner relationships in surviving products. However, firms also reallocated a big proportion of their activity across products and markets. For example, the exports of new products by surviving firms contributed 30% to total Chinese exports expansion, while 13% were lost due to surviving exporters discontinuing some products. Similarly, firm entry into new destination countries boosted overall export growth by 19%, while market exit deducted 7%. Surviving firms were also prone to change the products they sold in a given market, even if they
did not withdraw from it completely. Thus the exports of new products to existing trade partners added 33% to China's export growth, but half of that gain was neutralized by firms simultaneously discontinuing products in the same destination.19 Similar numbers describe Chinese importers and their adjustments to the products they imported and the source countries they transacted with.
We summarize these findings with the following stylized fact:
Stylized fact #6: The growth in Chinese exports between 2003-2005 was driven by firm entry (30%, aggregate extensive margin), surviving firms expanding exports of surviving products to existing trade partners (42%, firm intensive margin), and surviving exporters adding new products and destinations (28%, firm extensive margin). This breakdown is 27% - 51% - 22% for imports.
These results speak to the relevance of theoretical models of intra-industry firm dynamics and intra-firm product turnover in general, and in response to trade liberalization in particular. For example, Melitz (2003) and Costantini and Melitz (2009) model the reallocation of market shares across firms with different productivity levels in the presence of fixed and sunk costs of exporting, while Pavcnik (2002) and Bernard, Jensen and Schott (2006) provide empirical evidence for such reallocations in the aftermath of tariff reductions in Colombia and the U.S.. Similarly, Bernard, Redding and Schott (2009b) model multi-product firms, and examine the reallocation of trade flows both across firms and across products within firms. Goldberg, Khandelwal, Pavcnik and Topalova (2008), however, find only limited empirical support for this model using data on the behavior of Indian firms around trade reform.
5 Firm, product and trade partner dynamics
The decomposition of China's trade expansion between 2003 and 2005 highlights the role of reallocations across and within firms in response to trade liberalization. At the same time, this two-year comparison masks recurrent churning and reallocations across firms, products and trade partners. The monthly frequency of our data allows us to track firms over a 36-month period and document the constant adjustments they make to their product scope and choice of trade partners.
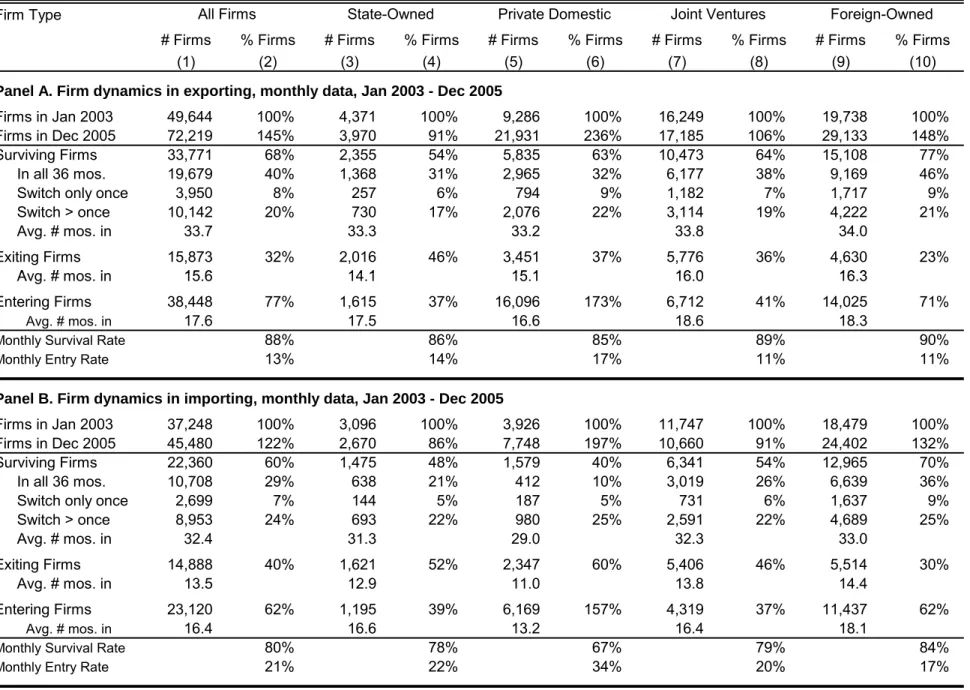
Between January 2003 and December 2005, the overall number of exporters and importers grew by 45% and 22% respectively (Table 12). These rates varied substantially across firms with
19 Note that a firm need not start exporting an entirely new product, but can simply introduce products it was already exporting to some countries in a new country instead.
different ownership structure, but were always higher for exporters than for importers. The number of private domestic firms that trade more than doubled, while the number of state-owned exporters (importers) contracted by 9% (14%). Foreign affiliates became significantly more numerous (48% for exporters and 32% for importers), while more joint ventures started exporting (6%) but some stopped importing (9%).
These net growth rates in firm numbers were accompanied by frequent firm entry and exit from international trade. Thirty-two percent of all exporters and 40% of all importers trading in January 2003 no longer did in December 2005, and were active in 15.6 and 13.5 of the 36 months, respectively. Overall, 12% of all exporters and 20% of all importers stopped trading each month, but on average even more new ones entered to replace them. Foreign-owned exporters and importers were more likely to survive from one month to the next than joint ventures, which had in turn better chances than domestic companies.
Trading firms are prone to repeatedly exit from and re-enter into exporting or importing. Forty percent of all exporters and 29% of all importers were active in all 36 months in 2003-2005, with these shares increasing in foreign ownership. Less than 10% of all firms traded continuously over this period but for one spell of non-trading, while more than 20% switched their status multiple times. Survival rates are slightly higher and churning less common at a quarterly frequency (see Appendix Table 1), but firm dynamics exhibit otherwise similar patterns.
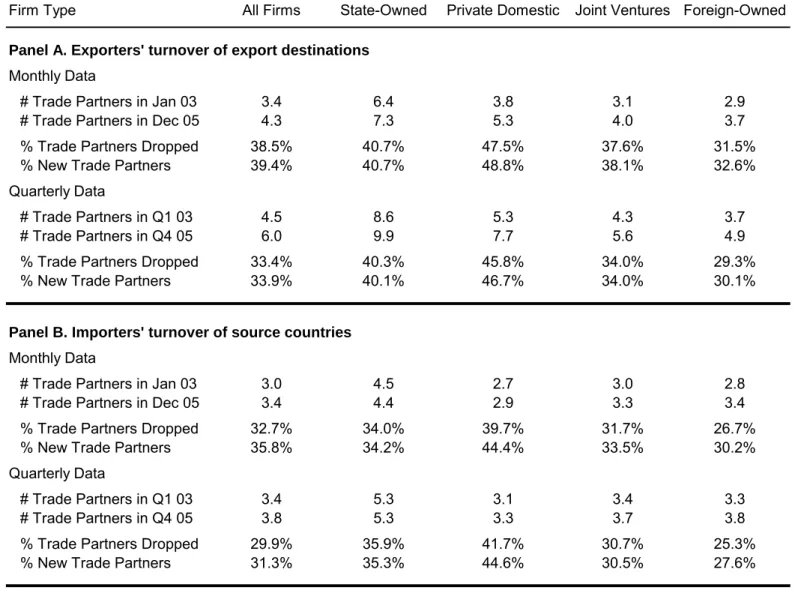
Firms regularly adjust their trade participation even when they do not completely withdraw from exporting or importing. For example, firms that trade continuously over the 36 months in our data frequently add and drop trade partners, as reported in Table 13. The average number of destination and source countries per firm increased by 26% for exporters and 13% for importers between January 2003 and December 2005, with little variation in this growth rate across ownership types.20 However, firms on average replaced a third of their trade partners every month. This share decreases in foreign ownership, with foreign affiliates exhibiting less churning than joint ventures and domestic firms showing the highest turnover rates. State enterprises experience slightly less churning in trade partners than privately-held local firms. Turnover is only marginally lower at a quarterly frequency.
In addition to rationalizing trade partners, firms that trade every month in our data also routinely adjust their product composition. As Table 14 shows, in any given month, exporters
(importers) discontinue 30% (35%) of the products they trade with at least one country, and introduce as many new goods. Moreover, firms often vary the mix of products they trade with a given destination or source country. On average, 45% (40%) of all bilaterally exported (imported) products are replaced with new ones from month to month. As with trade partner dynamics, foreign affiliates exhibit systematically less product churning than joint ventures, which in turn maintain a more stable product composition than state enterprises. Privately-held domestic companies adjust their product scope most frequently. Due to this recurrent churning, firms trade a given product in about 7 months in the 2003-2005 period on average, and in only 5 months with a specific trade partner.
Stylized fact 5 summarizes our results for export and import dynamics.
Stylized fact #5: Firms are prone to exit and re-enter into exporting and importing, and frequently change their trade partners and product mix. Foreign affiliates and joint ventures, however, have significantly higher survival rates and exhibit less product and trade partner turnover than domestic firms.
Our findings indicate that firms face sufficiently low sunk costs of trade and/or sufficiently volatile cost or demand shocks to warrant regular adjustments to trade flows. Moreover, the more frequent churning of products than trade partners in our data suggests that the sunk costs of entering into new markets and sourcing from new countries may exceed the sunk costs of trading new products with the same country. These results complement the evidence in BJS, Bernard, Redding and Schott (2009a), Alessandria and Choi (2007), and Besedes and Prusa (2006 a,b) on the frequency and determinants of firm and product churning in exporting.21 These papers have emphasized the productivity gains associated with within-firm reallocations in activity across products. Further evidence on firms' continuous product and trade partner adjustments will shed light on firms' trade participation decisions and the cost structure of exporting and importing.
The systematic differences we document across ownership types signal that foreign firms may have higher sunk costs or experience fewer and smaller shocks. If firms face liquidity constraints, the affiliates of foreign multinationals may also be better able to weather negative
21 See also Eaton, Eslava, Kugler and Tybout (2008) for evidence on reallocations across and within firms in Colombia.
shocks since they can access internal lending from the parent company.22 Similarly, state enterprises may more easily access financing from state-owned banks than private domestic firms. By the same logic, with product or country specific shocks, financially constrained firms may be more likely to discontinue some products or stop trading with some countries.23 In the presence of sunk trade costs, on the other hand, easier access to financing may increase churning because firms have a lower option value of staying in during a bad shock. Our results suggest that this effect may be dominated by the impact of liquidity shocks.
6 Conclusion
This paper uses newly available proprietary data on Chinese firm-level trade flows to establish novel and confirm existing stylized facts about firm heterogeneity in trade. This firm heterogeneity is most clearly manifested in the skewed distribution of exports, imports, product scope and trade partner intensity across firms. We corroborate the finding in the prior literature that a substantial share of exports and imports are captured by a few multi‐product firms that transact with a large
number of countries.
We also provide a detailed overview of China’s trade activity and the sources of Chinese trade growth over the 2003-2005 period. This analysis, too, emphasizes the importance of reallocation of activity across heterogeneous firms and across products and trade partners within firms. While 40-50% of the expansion in exports and imports can be attributed to surviving firms deepening their trade flows of surviving products with existing trade partners, firm entry and firm expansion into new products and markets is just as important. Thus, understanding firm heterogeneity and firms’ trade decisions is central to understanding aggregate trade outcomes.
We highlight a few novel results which shed light on the cost structure of international trade and the importance of foreign ownership for firms’ export and import decisions. First, the distribution of imports is significantly more skewed than that of exports, and there are many more small firms among importers. Second, foreign affiliates trade more on average and are more likely to engage in two-way trade than joint ventures, who in turn lead private domestic firms. Third, importers import more products than exporters export, but exporters trade with more countries
22 See, for example, Desai, Foley, and Forbes (2008) for evidence that the affiliates of foreign multinationals are less credit constrained relative to domestic firms.
23 See Manova (2007) for evidence that financially developed countries feature higher product survival rates and lower product turnover, especially in financially vulnerable sectors.
than importers do. Moreover, import product intensity and the number of source countries increase with foreign ownership, while export product intensity and the number of destinations decrease with foreign ownership. Fourth, the relationship between firms’ intensive and extensive margin of trade is not monotonic, differs between exporters and importers, and depends on the ownership structure of the firm. Finally, while all firms are prone to exit and re-enter into exporting and importing, and to frequently change their trade partners and product mix, foreign ownership is associated with significantly higher survival rates and less churning.
We believe these novel findings will guide future work on the nature of firm heterogeneity in trade, the optimal scope and scale of multi-product firms, and the production location and organizational decisions of multinational firms.
References
Alessandria, G. and H. Choi (2007). "Do Sunk Costs of Exporting Matter for Net Export Dynamics?" Quarterly Journal of Economics 122 (1), p.289-336.
Antràs, P. (2003). “Firms, Contracts, and Trade Structure.” Quarterly Journal of Economics
118(4), p. 1374-1418.
Antràs, P. and E. Helpman (2004). “Global Sourcing.” Journal of Political Economy 112, p.552– 80.
Antràs, P. and E. Helpman (2008). "Contractual Frictions and Global Sourcing," forthcoming in E. Helpman, D. Marin, and T. Verdier (eds.), The Organization of Firms in a Global Economy, Harvard University Press.
Arkolakis, C. and M. Muendler (2009). “The Extensive Margin of Exporting Goods: A Firm-level Analysis.” Yale University mimeo.
Aw, B., Chung, S., and M. Roberts (2000). “Productivity and Turnover in the Export Market: Micro-level Evidence from the Republic of Korea and Taiwan (China).” World Bank Economic Review 14(1), p.65-90.
Bartelsman, E., J. Haltiwanger and S. Scarpetta (2008). “Cross-Country Differences in Productivity: the Role of Allocative Efficieincy.” University of Maryland mimeo.
Beck, T. (2002). “Financial Development and International Trade. Is There a Link?” Journal of International Economics 57, p.107-31.
Beck, T. (2003). “Financial Dependence and International Trade.” Review of International Economics 11, p.296-316.
Beck, T., Demirgüç-Kunt, A., Laeven L. and R. Levine (2008). "Finance, Firm Size, and Growth."
Journal of Money, Banking, and Finance 40(7), p.1371-405.
Beck, T., Demirgüç-Kunt, A. and V. Maksimovic (2005). "Financial and Legal Constraints to Firm Growth: Does Size Matter?" Journal of Finance 60(1), p.137-77.
Becker, B. and D. Greenberg (2007). "Financial Development, Fixed Costs and International Trade." Harvard Business School mimeo.
Bernard, A. and J. Jensen (1999). “Exceptional Exporter Performance: Cause, Effect or Both?”
Journal of International Economics 47(1), p.1-25.
Bernard, A. and J. Jensen (1995). “Exporters, Jobs, and Wages in U.S. Manufacturing, 1976-1987.” Brookings Papers on Economic Activity, Microeconomics.
Bernard, A., Jensen, J. and P. Schott (2009). "Importers, Exporters, and Multinationals: A Portrait of Firms in the U.S. that Trade Goods," in T. Dunne, J.B. Jensen, and M.J. Roberts, eds., Producer Dynamics: New Evidence from Micro Data, University of Chicago Press.
Bernard, A., Jensen, J. and P. Schott (2006). "Survival of the Best Fit: Exposure to Low Wage Countries and The (Uneven) Growth of US Manufacturing Plants." Journal of International Economics 68, p.219-37.
Bernard, A., Redding, S. and P. Schott (2009a). "Multi-Product Firms and Product Switching."
American Economic Review (forthcoming).
Bernard, A., Redding, S. and P. Schott (2009b). "Multi-Product Firms and Trade Liberalization." NBER Working Paper 12782.
Bernard, A., Redding, S. and P. Schott (2009c). "Products and Productivity." Scandinavian Journal of Economics (forthcoming).
Bernard, A. and J. Wagner (1997). “Exports and Success in German Manufacturing.”
Weltwirtschaftliches Archiv 133(1), p.134-57.
Besedes, T. and T. Prusa (2006a). "Ins, Outs, and the Duration of Trade." Canadian Journal of Economics 39(1), p.266-95.
Besedes, T. and T. Prusa (2006b). "Product Differentiation and Duration of US Import Trade."
Journal of International Economics 70(2), p.339-58.
Besedes, T. and T. Prusa (2007). "The Role of Extensive and Intensive Margins and Export Growth." NBER Working Paper 13628.
Clerides, S., Lach, S. and J. Tybout (1998). “Is Learning by Exporting Important? Micro-dynamic Evidence from Colombia, Mexico, and Morocco." Quarterly Journal of Economics 113(3), p.903-47.
Costantini, J. and M. Melitz (2009). “The Dynamics of Firm Level Adjustment to Trade Liberalization,” in E. Helpman, D. Marin and T. Verdier, The Organization of Firms in a Global Economy, Harvard University Press (forthcoming)..
Desai,M., Foley, F. and K. Forbes (2008). "Financial Constraints and Growth: Multinational and Local Firm Responses to Currency Depreciations." Review of Financial Studies (forthcoming). Eaton, J., Eslava, Kugler and J. Tybout (2008). "The Margins of Entry into Exports Markets:
Evidence from Columbia," in E. Helpman, D. Marin and T. Verdier, eds., The Organization of Firms in a Global Economy, forthcoming, Harvard University Press.
Eaton, J., Kortum, S. and F. Kramarz (2008). "An Anatomy of International Trade: Evidence from French Firms." NBER Working Paper 14610.
Eaton, J., Kortum, S. and F. Kramarz (2004). "Dissecting Trade: Firms, Industries, and Export Destinations." American Economic Review Papers and Proceedings 94(2), p. 150-54.