ROAD TO RECOVERY: THE CAUTIOUS
RISE OF THE U.S. CONSUMER
BY NITIN SUMANGALI
EXECUTIVE SUMMARY
The U.S. consumer continues to recover both in spending and in attitudes about the economy from recession levels. There is less anxiety about the state of finances and more confidence in the ability to meet financial goals. Taking the longer view from the start of the economic crisis, the shifts from credit cards to debit cards and back are evidence that American consumers are not replacing one payment tool for another, but responding to their individual situations with the best tools they have—borrowing when prudent, paying in full when appropriate, reducing levels of debt when able. In order to support consumers who are looking to move through an improving, but not always uniformly positive, economic landscape, financial services institutions must continue to position themselves as a partner—a trusted advisor who isn’t pushing a
ANNUAL GROWTH IN U.S. CREDIT CARD VOLUME FOR 2012 WAS UP
8.4 PERCENT, OR $172 BILLION, FROM 2011.
$172
BILLION
The U.S. economic recovery continues to move in a jagged line upwards, with improvements in employment, the stock market, and consumer confidence propelling the economy in an overall positive direction—a conclusion supported by the findings of this, the fourth MasterCard Global Insights study of the credit/debit dynamic among U.S. consumers. Since 2009 MasterCard’s analysis has offered the opportunity to take a historical view of changes in attitudes and behaviors among U.S. consumers as regards their spending, borrowing, and choice of tender. Looking at a single economic data point at a singular point in time might give a reader a skewed view of the economy; offering the longer-term view, MasterCard’s analysis is able to differentiate long-term trends from noise in the data and gain a clear-eyed view of the improvements in U.S. consumer behavior.
s -ASTER#ARDSANALYSISOFPUBLICLYAVAILABLEINDUSTRYDATASHOWSTHATIN53credit card volume grew BYBILLIONYEAROVERYEARORPERCENTTHERESULTOFBOTHSTRONG INCREASESINDISCRETIONARYANDNONDISCRETIONARYSPENDINGANDBILLIONINSPENDINGTHAT shifted to credit cards from debit and prepaid cards, confirming a secular trend Insights first SPOTTEDIN
s )NPUBLICLYAVAILABLEDATASHOWEDTHAT53debit and prepaid card volume grew BILLIONORPERCENTONTHEBACKOFSTRONGSPENDINGGROWTHOFBILLION4HEOVERALLHEALTH of consumer spending on debit cards is evident from these annual growth figures.
sConsumer confidence has shown significant improvements as anxieties about financial
situations and ability to pay bills have decreased since the start of the crisis.
sRewards continue to be an important feature/function driver for credit card spending as
Individual data points (savings rates, housing starts, spending levels) may in isolation tell disparate stories; by examining the trends over years, MasterCard has been able to contextualize the reality of consumer attitudes and eliminate the noise; in other words, render those attitudes congruent with the evident behaviors. product, but is giving information and planning tools that allow people
to understand where they are financially and how to best move forward. Continuing to offer attractive rewards products for consumers seeking value and better financial management tools for consumers seeking help will be crucial to smoothing out the occasional bumps in the future’s fiscal road.
BACKGROUND
MasterCard’s series of papers on the changing dynamics of credit and debit card spending in the U.S. has provided unique context around the realities of consumer spending behavior since the advent of the crisis. In an effort to continually improve the research and reporting of these annual studies, MasterCard has refined the papers’ methodology to report more clearly the changes in consumer spending. To capture more fully the nature of the credit ANDDEBITLANDSCAPEIN-ASTER#ARDUSEDPUBLICLYAVAILABLEDATASETSNOT included in previous versions of the study. The new data adds electronic funds transfer (EFT) brands, which gained share significantly due in part to a provision of the Durbin Amendment requiring more than one unaffiliated brand on debit cards. To create the most accurate picture of the U.S. consumer payment landscape, Insights added these networks’ volume to the debit card spending total. While the methodology and data included have been fine-tuned, the historical findings and key messages themselves have not changed.
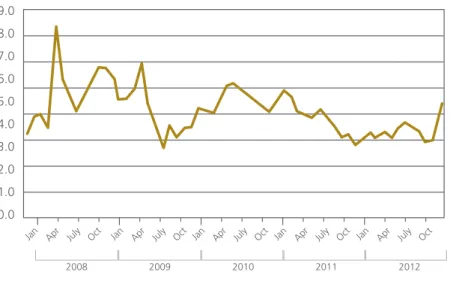
Month by month, quarter by quarter, and year by year there are reams of data produced about the American consumer’s financial picture that point in every direction and seemingly have no consistency. But it’s potentially a mistake to view the numbers this way. Individual data points (savings rates, housing starts, spending levels) may in isolation tell disparate stories; by examining the trends over years, MasterCard has been able to contextualize the reality of consumer attitudes and eliminate the noise; in other words, render those attitudes congruent with the evident behaviors. By revisiting the topic annually, MasterCard has established a baseline from which to compare the changing spending habits of American consumers. While the story is one of slow but steady improvement, only by isolating the consumer attitudes behind the numbers can the reason behind the improvement become evident. 4HEENVIRONMENTINISVERYDIFFERENTFROMTHATOFEARLYAND according to MasterCard’s proprietary consumer research conducted for this study, consumers report less fear and insecurity about their financial situation and more confidence, especially in managing their money. The simultaneous decline in credit card delinquencies and the unemployment rate witnesses MOREPRUDENTCONSUMERBORROWING!TTHEENDOF1THECREDIT CARDDELINQUENCYRATESTOODATPERCENTANDUNEMPLOYMENTWASAT PERCENT"YTHEENDOF1DELINQUENCYRATESDROPPEDTOPERCENT ANDUNEMPLOYMENTFELLTOPERCENT4HESENUMBERSINDICATETHATTHE53 CONSUMERISONlRMERBUTBYNOMEANSROCKSOLIDFOOTING&IGURE
When examining the past four years as a whole, perhaps the most visible trend was the amount of net spending that shifted from credit cards to debit cards.
FIGURE 1: AS CONSUMER SITUATION IMPROVES, UNEMPLOYMENT AND CREDIT CARD DELINQUENCIES FALL
Source: Federal Reserve, Federal Financial Institutions Examination Council, Consolidated Reports of Condition and Income, Bureau of Labor Statistics.
When examining the past four years as a whole, perhaps the most visible trend was the amount of net spending that shifted from credit cards to debit
cards. According to MasterCard’s analysis of publicly available data,FROM
TOTHISTOTALSHIFTREPRESENTEDBILLIONMOSTLYOCCURRINGBETWEEN AND)NTHOSEEARLYYEARSOFTHECRISISCONSUMERSSHIFTEDSIGNIlCANT amounts of spending from credit cards to debit cards and reduced credit card borrowing, likely as a response to financial uncertainty.
But this shift must be examined in the light of subsequent events. In more recent years, as the U.S. economy and consumers’ own financial circumstances improved, that tide toward debit cards has slowed and then reversed with consumers now shifting spending away from debit cards to credit cards and slowly increasing borrowing on credit cards. MasterCard’s analysis of publicly
available data2SHOWSTHATFROMTOOVERALLDEBITCARDSPENDINGGREW
BYPERCENTORBILLIONANDCREDITCARDSPENDINGGREWPERCENT ORBILLIONASTHECONSUMERSIN-ASTER#ARDSRESEARCHEXPRESSMORE confidence in their finances and their ability to meet their financial goals. While the shift from credit to debit and prepaid represents the secular trend, a narrower timeframe of just the past year tells the story of that shift reversing from the crisis’s nascent stages. A snapshot of key statistics shows that the past year has been broadly positive from an economic standpoint, with retail sales GROWINGEVENASECONOMICDATASHOWSTHATTHESAVINGSRATEINCREASEDIN COMPAREDTO&IGURESAND 10.0% 6.3% 2.7% 7.8% Q4 2012 Q3 2009 12.0% 10.0% 8.0% 6.0% 4.0% 2.0% 0.0%
From 2011 to 2012, U.S. consumers shifted $7.7 billion in spending from debit to credit cards as the swing to debit cards slowly reverses, according to MasterCard analysis of publicly available data.
FIGURE 2: RETAIL SALES IN 2012 GREW MORE THAN INFLATION AND CONSUMER CONFIDENCE JUMPED
Source: The Conference Board, Consumer Confidence Index; U.S. Census Bureau Department of Commerce, Retail Sales; U.S. Bureau of Labor Statistics, Consumer Price Index; U.S. Energy Information Administration, Gas Prices.
FIGURE 3: PERSONAL SAVINGS RATES IN 2012 INCREASED EVEN AS CONSUMER SPENDING GREW
Source: U.S. Department of Commerce: Bureau of Economic Analysis.
&ROMTO53CONSUMERSSHIFTEDBILLIONINSPENDINGfrom
debit to credit cards as the swing to debit cards slowly reverses, according to MasterCard analysis of publicly available data. The increased spending on
credit cards reflects consumers’ greater confidence in their ability to manage finances; they are discovering credit cards as a way to manage cash flow.
The two super segments that emerge from MasterCard’s proprietary consumer research, Credit on the Edge consumers and Credit Worthy consumers, are each becoming more confident—though that confidence reveals itself for each segment in unique ways.
15.4%
5.0% 2.1%
3.3%
Gas Prices Inflation Retail Sales A 5% rise in retail sales = +$234 Billion USD
Consumer Confidence 20.0% 15.0% 10.0% 5.0% 0.0% 9.0 8.0 7.0 6.0 5.0 4.0 3.0 2.0 1.0 0.0
Jan Apr July Oct Jan Apr July Oct Jan Apr July Oct Jan Apr July Oct Jan Apr July Oct
The segments also show that consumers are borrowing more confidently: the number of revolvers has grown from 2011 to 2012, but the average amount of outstanding balance has dropped, indicating a healthier financial picture and more confidence in borrowing via credit cards.
FIGURE 4: DEMOGRAPHIC DIFFERENCES OF THE SUPER SEGMENTS MEAN THEY MUST BE APPROACHED DIFFERENTLY
Credit on the Edge Consumers Credit Worthy Consumers PERCENTOFTHESURVEYED
population
PERCENTOFTHESURVEYED population
Tend to be younger Tend to be older
Tend to be less affluent Tend to be more affluent
More likely to be employed Less likely to be employed
Less likely to own homes More likely to own homes
Both segments are more confident in their ability to manage their finances and are less fearful that they will have to reduce their standard of living. Of the two segments, Credit on the Edge consumers have seen their confidence grow faster, but this is likely because it was coming from a lower base. The segments also show that consumers are borrowing more confidently: the number of
REVOLVERSHASGROWNFROMTOBUTTHEAVERAGEamount of
outstanding balance has dropped, indicating a healthier financial picture and more confidence in borrowing via credit cards.
The two segments are moving in a healthier direction, but each segment elicits specific responses from financial institutions. Credit on the Edge consumers are becoming more confident, but this new sense of security may be fragile. The slow economic recovery may lead consumers to be cautious about fully unleashing pent-up demand, so this segment needs more wide-ranging financial management tools to have a better grasp of their liquid assets as they continue to allocate spending between debit cards and credit cards.
The Credit Worthy segment, which was less severely impacted by the economic downturn, is looking for ways to better manage their liquid assets. With savings and checking accounts offering little in the way of substantive returns, more Credit Worthy consumers may look to their primary bank, where they hold these accounts, to provide them with enhanced buying experiences at the moment of purchase. The increase in revolving among the Credit Worthy segment is a sign that they’re willing to borrow at manageable levels; financial institutions should build on that relationship to construct a more useful payments experience and solidify relationships for the future. To better appreciate the context of the recent changes against the more historical PERSPECTIVETHISPAPERWILLlRSTLOOKATCOMPAREDTOANDTHENWILL APPOSETOTHESTARTOFTHECRISISIN
The overall growth in credit card net spending from 2011 to 2012 was 8.4 percent, or $172 billion. This growth includes increases in both discretionary and non-discretionary purchases, showing broad consumer confidence advancement.
2011 TO 2012: STEADY IMPROVEMENT
4HEOVERALLGROWTHINCREDITCARDNETSPENDINGFROMTOWASPERCENT ORBILLION&IGURE 4HISGROWTHINCLUDESINCREASESINBOTHDISCRETIONARYAND non-discretionary purchases, showing broad consumer confidence advancement.
According to U.S. Federal Reserve data,THERISEINCREDITCARDDEBTFROM
TOWASONLYBILLIONORPERCENT4HISESSENTIALLYmATGROWTHISA CONTINUATIONFROMTOWHERECREDITCARDDEBTGREWONLYBILLIONOR PERCENTBUTAREVERSALFROMTHEEARLYYEARSOFTHECRISISWHEREINDUSTRYDATA FROMTOSHOWSCREDITCARDDEBTDROPPEDBILLIONORPERCENT %VENINYEAROVERYEARCREDITCARDDEBTDROPPEDBILLIONORPERCENT
FIGURE 5: CREDIT SPENDING GROWTH IN 2012 CAME FROM BOTH INCREASES IN SPENDING AND SHIFTS FROM DEBIT
In U.S. $Billions
3OURCE.ILSON2EPORT)SSUE)SSUE-ASTER#ARD!DVISORS$ISCRETIONARY&REEDOM)NDEX
The purchase volume data from industry sources and the credit card debt levels from the Federal Reserve reports indicate that consumers are now willing to increase borrowing, but at relatively low levels that suggest there is little danger in the short term that the debt may again become unmanageable; rather, such credit card usage represents a prudent way of smoothing out short-term cash flow issues by taking advantage of the leverage credit cards offer.
)NTHETOPERIODBILLIONINSPENDINGSHIFTEDTOCREDITCARDS from debit cards. This shift from debit to credit is a reversal of the early years of the crisis and indicates a more confident consumer spending landscape. "YCOMPARISONFROMTO-ASTER#ARDANALYSISOFINDUSTRYDATA INDICATESTHATBILLIONINSPENDINGmOWEDFROMCREDITTODEBIT4HISWAS in an environment where overall consumer spending was decreasing, which MADETHISSHIFTEVENSTARKERFROMTOCREDITCARDSPENDINGFELL BILLIONANDDEBITCARDSPENDINGROSEONLYBILLIONFORANETDECREASE INCONSUMERSPENDINGOFFULLYBILLION&ROMTODEBITCARDNET SPENDINGGROWTHWASBILLIONORPERCENT4HISISBECAUSEEVEN 2,052.7 2,225.1 +0.8 +12.5 +6.3 +7.5 +82.2 +62.5 +0.6 2011 Credit Card Purchases General Spending Net Shift from Debit Cards Net Shift from Debit Cards General Spending General Spending Non-discretionary Purchases
Discretionary Purchases Commercial Spend Net Shift from Debit Cards Net Overall Shift from Cash 2012 Credit Card Purchases General credit card consumer spending increase/decrease
Debit cards and credit cards are not replacing one another, but are complementary tools for consumers—in the current environment both are growing as consumers use each instrument for its own purpose. THOUGH-ASTER#ARDANALYSISATTRIBUTESAPPROXIMATELYBILLIONOFTHE
INCREASETOSPENDINGONDEBITCARDSTHEBILLIONSHIFTEDTOCREDITCARDS reduces the net debit spending growth (Figure 6).
FIGURE 6: DEBIT SPENDING GROWTH IN 2012 CAME FROM INCREASES IN SPENDING AND WAS MODERATED BY SHIFTS TO CREDIT
In U.S. $Billions
3OURCE.ILSON2EPORT)SSUE)SSUE-ASTER#ARD!DVISORS$ISCRETIONARY&REEDOM)NDEX
Debit cards and credit cards are not replacing one another, but are complementary tools for consumers—in the current environment both are GROWINGASCONSUMERSUSEEACHINSTRUMENTFORITSOWNPURPOSE)N both credit card and debit card spending grew; in the early years of the crisis, credit card spending of course declined as debit card spending grew. As U.S. consumers continue to stabilize, they are using both types of cards to manage their finances the best way they know how. Seen in this light, the move back from debit to credit card spending indicates a growing comfort with using credit cards to manage cash flow.
To better understand the nature of improved consumer spending and what it means, it’s important to look at how consumer confidence has improved over the past year. MasterCard’s analysis for this thought leadership series involves taking publicly available government data on U.S. spending, as well as data from industry sources, and triangulating against MasterCard’s own spending metrics to confirm the direction of spending trends. Market research, meanwhile, surveys consumers about changes to their financial attitudes and behaviors. By combining the data of all these sources, MasterCard is able to create a rigorously analytical picture of the changes to the U.S. consumer. As noted, both of the super segments, Credit on the Edge consumers and Credit Worthy consumers, despite their differing demographic profiles, are more confident in their finances now than a year ago. This is evident when asked if they were in control of their finances and if they find they have to LOWERTHEIREXPECTATIONSOFTHEIRFUTURESTANDARDOFLIVING&IGURE 1,846.7 +136.9 -0.6 -6.3 -0.8 1,976.0 2011 Debit Card Purchases General
Spending Non-discretionaryPurchases DiscretionaryPurchases CommercialSpend Debit Card 2012 Purchases General debit card consumer spending increase/decrease
Gain/loss from net shift in payments to/from debit cards
Credit on the Edge consumers and Credit Worthy consumers, despite their differing demographic profiles, are more confident in their finances now than a year ago.
FIGURE 7: MORE CONSUMERS IN 2012 FEEL IN CONTROL OF THEIR FINANCES
Source: Target Research Group, Financial Crisis Study&EBRUARY
Both segments are also more confident in their ability to maintain their standard of living, with Credit on the Edge consumers seeing a much greater improvement on this measure as they were more impacted by the financial CRISIS&IGURE
FIGURE 8: CONSUMERS ARE LESS LIKELY TO SAY THEY WILL HAVE TO LOWER THEIR STANDARD OF LIVING
“I find I have to lower expectations about my future standard of living.”
Source: Target Research Group, Financial Crisis Study&EBRUARY 57%
53%
85% 86%
Credit Worthy Credit on the Edge
100% 90% 80% 70% 60% 50% 40% 30% 20% 10% 0% 2011: Yes 2012: Yes 54% 62% 27% 25% Credit Worthy Credit on the Edge
100% 90% 80% 70% 60% 50% 40% 30% 20% 10% 0% 2011: Yes 2012: Yes
Fully 68 percent of Credit on the Edge consumers say they’re cutting down on purchases they make, down 4 percentage points from the previous year, while the number of Credit Worthy consumers cutting back remains unchanged at 38 percent. Both segments report increased spending over the previous year, with the more
DRAMATICCHANGESEENAMONG#REDITONTHE%DGECONSUMERS&ULLYPERCENT of Credit on the Edge consumers say they’re cutting down on purchases they MAKEDOWNPERCENTAGEPOINTSFROMTHEPREVIOUSYEARWHILETHENUMBEROF #REDIT7ORTHYCONSUMERSCUTTINGBACKREMAINSUNCHANGEDATPERCENT )NADDITIONPERCENTOF#REDITONTHE%DGECONSUMERSARECOMPARINGPRICES more than in the past, but this number is down 2 percentage points from the YEARBEFORE"ESIDESREPAIRINGTHEIRBALANCESHEETSPERCENTOFCONSUMERS ARESAVINGSOMEMONEYWITHPERCENTSAVINGMORETHANAFEWMONTHS AGOUPPERCENTAGEPOINTSFROMAYEARBEFORECONSUMERSOVERALLAREALSO SPENDINGMOREWITHPERCENTSAYINGTHEYRESPENDINGMORENOWTHANINTHE PREVIOUSYEARUPFROMPERCENTTHEYEARBEFORE&IGURE
FIGURE 9: MORE CONSUMERS ARE INCREASING SPENDING, AND FEWER CONSUMERS ARE DECREASING SPENDING
Source: Target Research Group, Financial Crisis Study&EBRUARY
Observing the changes in revolving and transacting among consumers is also key to understanding the overall financial picture. MasterCard’s proprietary CONSUMERRESEARCHSHOWSTHATINPERCENTOFCONSUMERSWERE TRANSACTORSMEANINGTHEYTYPICALLYPAIDOFFTHEIRBILLINFULLWHILEPERCENT were revolvers, meaning they typically carried a balance on their credit card. 4HISRATIOISREVERSEDFROMTHEPREVIOUSYEARWHEREPERCENTOFCONSUMERS WERETRANSACTORSANDPERCENTWEREREVOLVERS
Here’s the interesting part: the growth in revolvers comes mainly from the Credit Worthy segment, because they are more able to service a manageable debt load, given their higher income and the fact that they are broadly more confident of their financial standing. More consumers are borrowing, but the amounts they are borrowing are falling—indicating a higher degree of confidence, both in their general financial situation and in managing debt SPECIlCALLY&IGURE
14% 19%
46% 48%
40% 32%
About the Same Spending Less Spending More 60% 50% 40% 30% 20% 10% 0% 2011 2012
MasterCard’s proprietary consumer research shows that in 2012, 49 percent of consumers were transactors, meaning they typically paid off their bill in full, while 51 percent were revolvers, meaning they typically carried a balance on their credit card.
FIGURE 10: MORE CREDIT WORTHY CONSUMERS IN 2012 REVOLVED, BUT BOTH SEGMENTS REDUCED THEIR OUTSTANDING DEBTS
Credit Worthy Credit on the Edge
!VERAGE"ALANCEON!LL#ARDS $2,000
!VERAGE"ALANCE#HANGEFROM -$600
Source: Target Research Group, Financial Crisis Study&EBRUARY
2008 TO 2012: THE ROAD TO RECOVERY
Examining the trend of consumers from the start of the crisis to today, there’s been unmistakable growth in spending, a sign of the continuing recovery of the American economy and the improving attitudes of consumers. It’s notable that the growth hasn’t been entirely smooth and the traffic hasn’t been all one way— the economic crisis was a true shock to the system for American consumers, and the climb out from that hole represents a significant effort—but in examining the trends over a number of years compared with a point-in-time snapshot, there’s evidence of substantial progress.
#REDITCARDSPENDINGOVERALLGREWBYBILLIONORPERCENTFROMTO ACCORDINGTO-ASTER#ARDSANALYSISOFINDUSTRYDATA&IGURE 4HISGROWTH came from both discretionary and non-discretionary categories, evidence of the continued secular shift to electronic payments in general. More particularly, there is a broad shift in spending toward credit cards from the total spectrum of payment products, especially in more recent years. In that same four-year period, THENETSHIFTFROMCREDITCARDSTODEBITCARDSWASBILLIONWITHTHEMAJORITY OFTHATSHIFTHAPPENINGINTHEYEARSANDACCORDINGTO-ASTER#ARDS
analysis of industry data;6SINCETHENTHETRENDHASABATEDANDINDEBIT
spend was shifting to credit, while credit borrowing has also increased. Looking
Credit on the Edge Credit Worthy 2012 2011 Transactor Revolver 25% 73% 73% 80% 20% 27% 27% 75%
Looking at MasterCard’s proprietary consumer research, these behaviors are shown by an increase in the number of consumers who are willing to revolve, a small uptick in overall outstanding credit card debt, and the fact that balances—the dollars each consumer revolves— are dropping.
an increase in the number of consumers who are willing to revolve, a small uptick INOVERALLOUTSTANDINGCREDITCARDDEBTANDTHEFACTTHATASWESEEIN&IGURE balances—the dollars each consumer revolves—are dropping.
FIGURE 11: SINCE 2008 CREDIT CARD SPENDING GROWTH HAS COME FROM GENERAL SPENDING, AND $141 BILLION IN SPEND SHIFTED TO DEBIT
In U.S. $Billions
3OURCE.ILSON2EPORT)SSUE)SSUE)SSUE)SSUE)SSUEAND)SSUE -ASTER#ARD!DVISORS$ISCRETIONARY&REEDOM)NDEX
$EBITCARDSPENDINGGREWATAFASTERCLIPPERCENTORBILLION4HE majority of this growth was the result of overall growth in consumer spending, BUTDEBITALSOBENElTEDFROMBILLIONINSPENDINGTHATSHIFTEDAWAYFROM cash. The secular trend is clear: electronic payments continue to displace other FORMSOFPAYMENT&IGURE
FIGURE 12: DEBIT CARD SPENDING GROWTH SINCE 2008 HAS BENEFITED FROM GENERAL SPENDING, BUT ALSO FROM $70.5 BILLION SHIFTED FROM CREDIT CARDS AND $91.3 BILLION SHIFTED FROM CASH
In U.S. $Billions 3OURCE.ILSON2EPORT)SSUE)SSUE)SSUE)SSUE)SSUE)SSUE-ASTER#ARD !DVISORS$ISCRETIONARY&REEDOM)NDEX 1,944.7 2,225.1 +20.5 +12.5 +223.5 -67.3 -3.8 -69.9 +164.9 2008 Credit Card Purchases General Spending Net Shift to Debit Cards Net Shift to Debit Cards General Spending General Spending Non-discretionary Purchases Discretionary Purchases Commercial Spend Net Shift from Debit Cards Net Overall Shift from Cash 2012 Credit Card Purchases General credit card consumer spending increase/decrease
Gain/loss from net shift in payments to/from credit cards
1,372.5 +371.2 +91.3 +69.9 +67.3 +3.8 1,976.0 2008 Debit Card Purchases General Spending Net Shift from Cash Discretionary Purchases Non-discretionary Purchases
Net shift from/to credit cards Commercial
Spend
2012 Debit Card Purchases General debit card consumer spending increase/decrease
The growth in confidence among American consumers has moved in step with the increases in both credit and debit card spending, as well as the increase in borrowing at lower balance levels resulting from higher payment rates. As consumers have traveled further from the crisis, they’re more likely to view their financial status as stabilized and improving.
MasterCard’s proprietary consumer research shows that a total of 62 percent OFCONSUMERSINREPORTEDTHATTHEYWERECUTTINGDOWNONPURCHASESTHEY MAKEBUTBYTHATNUMBERWASDOWNTOPERCENT!TTHESAMETIME 66 percent of consumers were worried about what the future would bring in ANDINTHATNUMBERWASONLYPERCENT-EANWHILEPERCENT FEARTHEYWONTBEABLETORETIREDOWNPERCENTAGEPOINTSFROMAND percent feel their life is more out of control today than it was six months ago, DOWNPERCENTAGEPOINTSFROM7HILEPERCENTFEARITWILLBEHARDTO GETCREDITDOWNPERCENTAGEPOINTSFROMPERCENTSAYTHEYHAVENO CONCERNSABOUTTHEIRlNANCESUPPERCENTAGEPOINTSFROM0ERHAPSMOST IMPORTANTPERCENTOFCONSUMERSFEELTHEYREINCONTROLOFTHEIRlNANCESUP PERCENTAGEPOINTSFROM
Along with increased confidence in their ability to manage spending and the improvements in the economy at large, consumers evince another attitude that goes a long way toward documenting credit card spending’s rise—the continuing attraction rewards exercise. Just as cash spending gave way to debit spending as consumers discovered the benefits of electronic payments, rewards continue to prove a driver of credit card spend.
&ULLYPERCENTOFCONSUMERSSAYTHEYUSETHEIRCREDITCARDBECAUSEITOFFERS REWARDSUPPERCENTAGEPOINTSFROMACCORDINGTO-ASTER#ARDS proprietary consumer research. This increase is particularly notable given that MasterCard’s analysis of industry data shows that the average credit card
transaction amountFELLBYPERCENTFROMINTOIN
this decline suggests that consumers are using credit cards even for smaller PURCHASESWITHREWARDSOFFERINGAKEYINCENTIVEFORTHEMTODOSO&IGURE
Along with increased confidence in their ability to manage spending and the improvements in the economy at large, consumers evince another attitude that goes a long way toward documenting credit card spending’s rise—the continuing attraction rewards exercise.
FIGURE 13: CREDIT CARD AVERAGE TRANSACTION AMOUNTS DROP AS REWARDS SPUR CONSUMERS TO USE CARDS FOR SMALLER PURCHASES
3OURCE.ILSON2EPORT)SSUE)SSUE)SSUE)SSUE)SSUE)SSUE-ASTER#ARD !DVISORS$ISCRETIONARY&REEDOM)NDEX
3INCECASHBACKREWARDSHAVEGROWNINPOPULARITY)NPERCENT of consumers said they continued to use credit cards because cash-back rewards HELPEDATTHETIMEBYTHATNUMBERHADGROWNTOPERCENTACCORDINGTO MasterCard’s proprietary consumer research. As consumers were spending more on their credit cards, they found cash-back rewards an added inducement to shift spending to credit cards instead of other payment methods.
IMPLICATIONS
The improvements in the American consumer’s confidence and the growth in consumer spending suggest a number of opportunities for financial institutions seeking to capture a larger share of consumers’ wallets.
As in previous years’ iterations of this work, the results of MasterCard’s research leads financial services institutions back to the basics: helping consumers
manage liquidity through payments. The core business of banking—holding
deposits and making loans—has historically been financial institutions’ key profitability driver. Consumers prize the ability to have access to their own liquid funds and, if need be, to borrow at the point of sale. In order to have the BESTOPPORTUNITIESTOGIVECONSUMERSADEGREEVIEWOFTHEIRlNANCESINA single place, financial services institutions should aim to gather as much of their clients’ liquidity under one roof—an institution’s own. Having a full picture of a consumer’s financial situation—both deposits and credit card balances—allows financial institutions to better understand how their consumers shift spend in response to changing situations.
Having a full picture of a consumer’s financial situation— both deposits and credit card balances—allows financial institutions to better understand how their consumers shift spend in response to changing situations.
$96.0 $95.0 $94.0 $93.0 $92.0 $91.0 $90.0 $89.0 $88.0 $87.0 2008
Credit Card Spend Amount Per Transaction
2007 $95.0 $94.9 $89.8 $92.3 $93.1 $92.9 2009 2010 2011 2012
Long-term liquidity is part of this equation. As the economy—or at least the stock market—continues to improve even as interest rates hover close to zero, more consumers are turning to the equity markets, not savings accounts or CERTIlCATESOFDEPOSITTOGAINRETURNSONTHEIRASSETS)NASTHECRISISBORE DOWNPERCENTOFCONSUMERRESPONDENTSREPORTEDTHEYWEREAFRAIDTOINVEST INTHESTOCKMARKET"YTHATNUMBERWASPERCENTANDINITWAS PERCENT"REAKINGITDOWNBYSEGMENTBOTH#REDITONTHE%DGEAND#REDIT 7ORTHYCONSUMERSARELESSAFRAIDTOINVESTINTHESTOCKMARKETINTHAN THEYWEREIN&IGURESAND
FIGURE 14: AS CONSUMERS GAIN CONFIDENCE IN THE ECONOMY, THEY ARE LESS AFRAID TO INVEST IN THE STOCK MARKET
“I am afraid to invest in the stock market”
Source: Target Research Group, Financial Crisis Study&EBRUARY
FIGURE 15: BOTH SEGMENTS ARE BECOMING MORE COMFORTABLE WITH THE IDEA OF INVESTING IN THE STOCK MARKET, WITH CREDIT WORTHY CONSUMERS MORE CONFIDENT
“I am afraid to invest in the stock market”
Source: Target Research Group, Financial Crisis Study&EBRUARY
This renewed confidence in the equity markets means that the major opportunity for financial institutions to build relationships with consumers is to be a trusted partner in long-term financial management—necessarily by
28% 33%
50%
44%
Credit Worthy Credit on the Edge
60% 50% 40% 30% 20% 10% 0% 2011: Yes 2012: Yes
Investing in technology to further expand the mobile device as the new payments form factor is an example of what banks can do to enhance the payments experience.
47% 42% 37% All Consumers 60% 50% 40% 30% 20% 10% 0% 2008: Yes 2011: Yes 2012: Yes
markets. Instead, the financial institutions that hold access to short- and medium-term liquidity must work to improve the payments function in order to add value for the consumer. Bluntly, consumers entrust their liquid funds in banks in order to gain easy access to those funds. Any enhancement of the payment experience is a direct value-add to that relationship.
Investing in technology to further expand the mobile device as the new payments form factor is an example of what banks can do to enhance the payments experience. As the functions and features of online banking and financial management become more available via smartphones and tablets, the devices will by necessity move closer to the center of the payments process; if the value an FSI offers is allowing consumers to pay whom they want when they want, then the mobile phone as the initiator of payments is a critical link. A mobile device with robust banking and payments tools offers consumers a view into their real-time financial position at any time, which will in turn drive a more complete understanding of how to manage their finances and balance their spending and savings goals. Rewards remain key for credit card spend and, in this regard, issuers have a number of weapons in their arsenal that are part of the core relationship. Cash-back rewards are the most popular form of rewards with the affluent, WHEREPERCENTHAVECASHBACKREWARDSCOMPAREDWITHAIRLINEREWARDSAT percent. Designing rewards that offer cash back to both consumer segments can be profitable, especially as more consumers feel confident in their ability to MEETTHEIRGOALSANDTAKEONCERTAINLEVELSOFDEBT&IGURE
FIGURE 16: TYPES OF REWARD PROGRAMS: TOTAL AFFLUENT MARKET
2009-10 2010-11 2011-12
Cash Back (Cash Rebate)
Airline Miles
"ONUS0OINTS N/A N/A
(OTEL2EWARD0OINTS N/A
0OINTS2EDEEMABLEFOR#HOICEOF
Merchandise, Travel, Cash, etc. N/A
0OINTSOR#REDITS4OWARDTHE0URCHASE
of an Automobile N/A
Gift Certificates
Gas Rebates N/A
Other Rewards
3OURCE0HOENIXGlobal Wealth Monitor – U.S. Card Report,&ALL
Hit harder in the crisis, Credit on the Edge consumers are evincing improved confidence by higher levels of aggregate spend than they clocked in previous years, but also by paying down their debt and decreasing their outstanding balances.
Consumers are saving but looking to spend smart. As more consumers are repairing balance sheets and simultaneously increasing spending, they need a fuller picture of their financial position. Hit harder in the crisis, Credit on the Edge consumers are evincing improved confidence by higher levels of aggregate spend than they clocked in previous years, but also by paying down their debt and decreasing their outstanding balances. Financial management tools arrayed around the core banking relationship will allow consumers to balance their saving and spending needs, especially as Credit on the Edge consumers continue to deleverage their credit card outstandings.
The importance of the revolving balance is slowly undergoing a process of rediscovery on the part of consumers—who may, in fact, be ahead of their FSIs in this regard. While the average amount consumers are revolving is down, more consumers are revolving. For the two segments, the stories are broadly similar, but there are nuances that impact the way each group can be served:
Credit on the Edge
s Evincing no change in the distribution of revolvers vs. transactors from
TO
s Climbing up from a more damaged position than Credit Worthy consumers,
so improvements in confidence are greater in a relative sense
s Carrying higher average outstanding balances than Credit Worthy
consumers, but deleveraging faster in absolute dollars
s If they continue to pay down debt, Credit on the Edge consumers will
respond to credit products and financial management tools allowing them to manage money more efficiently, in real time, at the moment of purchase
Credit Worthy
s The year-over-year increase in revolvers comes from the Credit Worthy
segment, as the number of Credit on the Edge revolvers is unchanged
s #REDIT7ORTHYCONSUMERSCARRYALOWERAVERAGEBALANCEBUTFROM
TOTHEIROUTSTANDINGBALANCEDROPPEDBYAGREATERPERCENTAGETHAN the Credit on the Edge consumers’ outstanding balance
s More likely to see credit card borrowing as convenient and are confident in
their ability to manage these lower debt levels, both because of increasing confidence in their own financial situation and the broad improvements in the economy
s Revolving at lower levels on the part of the Credit Worthy with products
specifically designed for that purpose can be advantageous for both banks and consumers
MasterCard’s annual study of the U.S. credit/debit dynamic indicates that in 2012 consumers were more confident in their ability to meet their financial needs and as a result spent more. While they remain cautious and continue to look for value, the multi-year trends in spending behavior and confidence point to a more resilient consumer base.
CONCLUSION
U.S. consumers have been on a roller coaster since the financial crisis, causing them to make fundamental changes to spending behaviors and attitudes. MasterCard’s annual study of the U.S. credit/debit dynamic indicates that in CONSUMERSWEREMORECONlDENTINTHEIRABILITYTOMEETTHEIRlNANCIAL needs and as a result spent more. While they remain cautious and continue to look for value, the multi-year trends in spending behavior and confidence point to a more resilient consumer base.
&ROMTO53credit card volume grewBYPERCENTOR BILLIONPRIMARILYFROMREENERGIZINGCONSUMERSPENDING$URINGTHIS PERIODAPPROXIMATELYBILLIONOFSPENDINGSHIFTEDFROMCREDITTODEBIT primarily in the early years of the financial crisis; in recent years the trend has reversed, with spending flowing from debit to credit.
2. In that same four-year period, U.S. debit volume grewBYPERCENT
ORBILLIONDUETOGENERALSPENDINGGROWTHASWELLASSHIFTSFROM
credit cards and cash.
Bringing more value to payments is key in making consumers feel that spending is smart. Consumers who understand their finances better can make more informed decisions about their money, and financial services institutions are key to providing that data to consumers.
For additional insights, please visit www.mastercardadvisors.com and insights.mastercard.com.
AUTHOR
NITIN SUMANGALI
Nitin Sumangali is an Analyst in the Global Insights group of MasterCard Worldwide. He is responsible for analyzing MasterCard and third-party research to support the development of market, consumer, and financial insights that can strengthen the performance of MasterCard and its customers worldwide. Mr. Sumangali is BASEDIN0URCHASE.9ANDCANBEREACHEDATNITIN?SUMANGALI MASTERCARDCOM