Annual Report 2014
Robertstown
Primary School
Annual Report
2014
Annual Report 2014
1. CONTEXT
School Name: Robertstown Primary School School Number: 0385
Principal: Angela Jenkins Partnership Goyder & Light
Robertstown Primary School is situated approximately 150km north of Adelaide. The main industries locally are grain and stock farming. The school is especially well supported by parents and local community members.
The school’s motto is Respect, Pride and Success.
The school curriculum covers the following 7 learning areas: Mathematics, English, Science, Society and Environment, Health and Physical Education, the Arts and Technology.
Thirty-one students were enrolled at Robertstown Primary School in 2014 and there are likely to be thirty-one students enrolled for 2015. There were only four graduating Year 7 students this year. Students come from a broad socio-economic background, mainly agricultural, with approximately 30% on School Card.
Class sizes are small with students working in two classes an R – 2 and a Year 3 – 7 class. Literacy and Numeracy support is provided through the Principal taking a small group of Year 2 & 3 students so as to reduce class sizes for these key learning areas from 9:00am until lunchtime Monday to Wednesday.
This year the school became involved in the Stephanie Alexander Kitchen Garden program, through a successful grant application. New garden beds were established, with automatic watering systems, as well as the purchase of additional tools for the garden and kitchen equipment.
Students in the Yr 3-7 class participated in the Festival of Music, and Yr 5-7 students travelled to Adelaide to perform at the Festival Theatre.
The Student Representative Council (SRC) works on fundraising, school promotion, lunchtime activities and grounds development.
The school is actively involved in a number of extra-curricular programs, such as athletics, basketball, swimming, football and netball carnivals, and offers a long-standing Electives program where
community members run various enrichment activities for the students.
Christian Education lessons are offered once each term with the support of the local church groups. Each year the school holds an Annual Concert Night where class, school and community awards are presented, the school’ s achievements for the year acknowledged and the graduating class of Year 7 students presented to the wider school community. Each class performs a small item as well as a whole school item for the audience. There is involvement of the Robertstown Preschool in this event also.
There is a high level of community interest and involvement in the school, which has an extremely active and supportive Governing Council and Parent Club.
Annual Report 2014
2. REPORT FROM GOVERNING COUNCIL
This year our school Governing Council consisted of eight members, leaving five positions vacant. The council met twice each term to discuss routine business, including ratifying the 2013 Annual Report, the school’s Code of Conduct, Anti-bullying and Grievance Policies.
The school has continued to develop with the Stephanie Alexander Kitchen Garden Program with new garden beds and tools purchased. Thankyou to Julie Schutz, Carlene Heinrich and Linden Calley for helping to organize this. New air conditioning was installed in the middle primary room and a computer system upgrade is to come over the summer holidays.
Governing Council discussed survey results about a Language for 2015, with Indonesian delivered by Mrs. Jenkins being the preferred option by the vast majority of students and families.
This year the school became part of the Goyder and Light Partnership of schools and preschools and we were made aware of our school working more closely with neighbouring schools to support each other.
Other projects we have been kept informed about were:
Pre-school to School Integration project- where the Junior Primary class and preschool worked together with students on shared activities and learning.
PAL program – which stands for Play At Lunchtime- for kids to learn cooperative games.
Governing Council also approved subsidy to support choir students travel to Adelaide for the Festival of Music as well as the whole school camp to Woodside and Yr 7 Canberra camps.
From 2015 Governing Council has endorsed the introduction of direct debit instalment – so parents will be able to pay school fees using internet banking. Schools fees were also ratified at $180 for next year.
The Governing Council wrote several letters to Goyder Regional Council and attended a meeting in Burra, regarding swimming pool fees, which we felt were too high. A reduction was eventually given and an agreement for lower pricing in the future was made.
The Governing Council were also kept informed regarding the changes to funding, application and naming for CPSW (School Chaplains – Carlene Heinrich’s current role). We endorsed applying for ongoing funding for 2015 and hope that we will be successful in maintaining this important support role for children at our school.
Finally I would like to thank all our school governing council members for their input throughout the year, as well as the staff for their ongoing commitment and hard work. I would describe 2014 as another successful year at Robertstown Primary School.
Catherine Goddard Chairperson.
Annual Report 2014
3. 2014 HIGHLIGHTS
2014 has to proven to be another busy and successful year at Robertstown PS. Thanks to the
supportive Governing Council, Parent Club, staff, volunteer helpers and most importantly the students Some of the highlights include:
* Stephanie Alexander Kitchen Garden program * Festival Of Music (Choir Camp)
* Swimming lessons * Pancake Tuesday
* SAPSASA sports * Christian Ed activities
* Super Cycle visit * PALS – Play at Lunchtimes program
* Harmony Day with Preschool * Crazy Hair Day
* Footy clinic with West Adelaide * Biggest Morning Tea
* “Buddy” reading * Mother’s Day Street Stall & Raffle
* Mini Wimbledon * Eudunda Show display
* Transition * Canberra camp for Yr 7
* End of year Concert * SRC Inductions
* Sports day with Farrell Flat PS, Auburn PS & Watervale PS * Annual Camp- Woodhouse * Electives- Thanks to wonderful parent & community support * Lightning Carnival
Annual Report 2014
* Book week activities
* Milo Cricket
* Lunch time activities with CPSW Carlene Heinrich (gardening, craft) * Dog safety
* Improvements to facilities/grounds: new air conditioning and computer server and cabling * End of year celebration – water fun day at school
* Staff Training & Development: Ann Baker Natural Maths, Advanced Jolly Phonics, Stephanie Alexander Kitchen Garden program, Neil McKay Dyslexia, Australian Curriculum familiarisation Please see photo gallery at the end of this report.
Annual Report 2014
4. SITE IMPROVEMENT PLANNING AND TARGETS
Robertstown PS Site Improvement Plan for 2014 - 2016 has three key priorities: Literacy& Numeracy, Attendance & Behaviour and Curriculum & Pedagogies for engagement.
Literacy & Numeracy : Improve student reading, writing and number abilities and
skills of all students (except Students With Disabilities), to age equivalent or above as specified in the targets, by the end of 2016Our whole school approach delivers improved skill development and achievement in reading and writing through all staff working collaboratively to:
Implement whole school agreements in teaching Literacy & Numeracy Implement agreed data collection schedule
Implement current research in Literacy & Numeracy practices
Targets utilizing a range of measures were established, including Running Records, Lexile levels, NAPLAN, Waddington Diagnostic Reading & Spelling Tests, Westwood (SAST) Diagnostic Spelling Test, PAT-R Comprehension Test, PAT Maths Test, Jolly Phonics & Multi-Lit words and a Writing Audit. A schedule of timely data collection was established to enable an ongoing cycle of assessment and teaching. Professional development for staff is listed in section on Curriculum & Pedagogies for Engagement.Progress towards targets are included in Student Achievement section.
Implications for next year: Whilst pleasing progress has been made and most targets have been met, there is still a need to maintain this focus as described in our SIP.
Attendance & Behaviour Learning:
Improve student attendance in line with state goals of 95% attendance by the end of 2014.94.3% attendance achieved, falling marginally short of our target, but still an improvement on 2013 attendance. Details of results in Student Data : Attendance section.
Implications for next year: Continue follow-up and support for families. Seek support of Attendance Officer if necessary.
Anti-Bullying surveys were conducted in Term 3 with 4 parent, 9 student and 1 staff responses. The low return, may indicate that this is not an issue for many students/families. Consequently, it is difficult to draw reasonable conclusions about this set of data. The predominant pattern of Bullying was that Verbal (eg-name calling and teasing) and Emotional (ignoring & making fun of someone) was happening. 4 out of 5 responses reported being “very pleased” (positively) about how they felt about the management of a reported issue.
Another initiative was the PALS (Play at Lunchtimes) training program for students and staff. All were taught a range of games that encouraged and fostered cooperation, which have since been used by SRC for lunchtime activities as well as in PE lessons. The school has also continued weekly circle time assembly with our CPSW to focus on inclusion and school values. We believe that this has helped to improve the connectedness between students at school.
Annual Report 2014
Curriculum & Pedagogies for Engagement:
Build teacher capacity through a range of Training and Development opportunities appropriate to their needs and the needs of the school.Throughout the year staff members have been engaged in a range of professional learning opportunities to build their knowledge and skills in our focus areas of Literacy and Numeracy. Activities undertaken in 2014 included:
Numeracy:
24 &25/2/14 - Australian Curriculum Coordinator Jenni Hewett provided demonstrations, observations and feedback with staff in maths lessons on site
31/3/14 – Australian Curriculum Coordinator Jenni Hewett provided a pupil free day of Natural Maths T&D at Gawler with all school from our partnership (Goyder & Light)
10/6/14 - Australian Curriculum Coordinator Jenni Hewett provided a site pupil free day of curriculum mapping /familiarization in new areas of Australian Curriculum – including Civics & Citizenship, Health & PE, Economics & Business, Technologies, The Arts, Geography.
17/9/14 - Ann Baker provided a pupil free day of Natural Maths T&D (focus on Statistics and Probability strand) at Gawler, with schools from our partnership (Goyder & Light)
3/11/4 – Developing the G&L Numeracy Agreement- working with Jenni Hewett
Literacy:
20/6/14- Advanced Jolly Phonics (masterclass) delivered by Jan Polkinghorn (SPELD)at Manoora PS 5/11/14- Jolly Grammar delivered by Victoria Carlton (Adelaide)
12/8/14- Understanding Dyslexia & Learning Difficulties with Neil McKay (Gawler & Eudunda) 5/3/14 - NAPLAN writing assessment marking with Angela Jenkins at Robertstown PS
In addition to this staff have also been involved in:
23/1/14 – Revisiting TFEL Framework guide, review tools document & teacher’s companion through a Numeracy perspective.
20/3/14 –Preschool to School Integration project planning at Snowtown
20/8/14 – Developing Transition plans/protocols with Jasmin Lowcock at Kapunda PS (Goyder & Light)
27 & 28/3/14 and 2 & 3/914 - Stephanie Alexander Kitchen Gardens Training 27/10/14 - Child Protection Curriculum (online course update)
5/9/14 - Exploring Geography at Freeling PS (G&L Australian Curriculum Coordinator Jenni Hewett) 7/5/14 - Disability Standards for Education (online training course)
Annual Report 2014
Self Review
Ongoing self review activities occur through staff meetings and performance management meetings. On 23/1/14 – staff spent time revisiting TFEL Framework guide, review tools document & teacher’s companion through a Numeracy perspective in preparation for development plan for 2014.
In addition to this, a pupil free day was allocated with time spent having “Disciplined Dialogue” around our data and Site improvement Plan. This was held on 17/11/14 and supported by Jenni Hewett with some time spent focusing on PAT Maths and NAPLAN Numeracy achievement data. A Partnership Numeracy Agreement has also been drafted.
We feel extremely satisfied with much of our progress made towards Site Improvement Plan priorities and targets. Implications for 2015 include: ongoing work in the areas of Numeracy and writing, utilizing Better Schools Funding to purchase resources and continuing with providing small instruction groups for Literacy and Numeracy Block times three days a week. Opportunity for staff to visit other sites to watch others work / network to develop broader range of pedagogies would also be beneficial.
4.1 Junior Primary and Early Years Scheme Funding
Early Year Class Sizes funding ($8286) was utilized with other site funds to provide additional staffing. This included:
Principal teaching a Literacy & Numeracy Block three days a week until lunchtime (300 minutes for each curriculum area) with Year 2 & 3 students – essentially creating a third class for core business. A contract teacher was employed 0.3 to deliver NIT lessons.
SSO support 10hpw in the Junior Primary class, with focus on all new Receptions, as well as any students identified as SWD or having learning difficulties. Speech and Language intervention program.
This has enabled SIP targets for Literacy and Numeracy to be generally reached if not surpassed.
4.2 Better Schools Funding
Better Schools funding ($4621) was utilized with other site funds to: Provide additional staffing. This included:
Principal teaching a Literacy & Numeracy Block three days a week until lunchtime (300 minutes for each curriculum area) with Year 2 & 3 students – essentially creating a third class for core business. A contract teacher was employed 0.3 to deliver NIT lessons.
Improving educational outcomes for students through the provision of the intervention program MULTILIT – staffed by SSO hours (5 hpw)
Funding was also utilized to develop teacher capacity and capability by funding training and development in SIP focus areas of Literacy and Numeracy.
Annual Report 2014
5. STUDENT ACHIEVEMENT
Staff and students have focused learning improvement in numeracy as well as literacy. There has been reasonable to very good improvement noticed in our school data. SSO support, small instruction groups for Literacy and Numeracy block time and the Individual Support program “Multi-Lit” has helped all students.
Due to the small size of some year levels, it is not appropriate to comment on some aspects of our data in order to maintain confidentiality and anonymity.
Site Improvement Plan targets and comments:
Running Records (Reading Level) Targets: Yr 1: 17-20, Yr 2: 21-24 By the end of 2014 not all students achieved target. Intervention is in place for students identified. All students showed strong growth of on average 8 reading levels.
PAT-R (Reading Comprehension) target for Yr 2-7: Minimum Stanine 5 68% of students at or above stanine 5. Intervention in place for students identified.
Waddington Reading Target: At or above chronological age. Students who have not achieved the target – aim to show growth of at least 6 months in Waddington Reading Test over a year. 62% achieved at or above their chronological age. Intervention in place for students identified. Jolly Phonics (JP) Targets: 90% of students can read & identify all 42 sounds by the end of
Reception. End of Yr 1: 200 sight words known. End of Yr 2: identify & utilise appropriate graphemes for common words. Almost all Reception, Yr 1 & Yr 2 achieved their targets.
Writing Audit Yr 2-7 in Term 1 (Week 2) and Term 3 (Week 2). Target: using NAPLAN marking criteria- growth shown in 3 out of the 10 criteria (average growth from year to year). All students showed growth but not all achieved target. 61 % (11/18) achieved growth in 3 of the 10 criteria. 22% (4/18) of students are above target score for their year level and growth was only 1 or 2. 17% showed growth in only 1 or 2 criteria.
Waddington Spelling Test (R-3) Target: At or above chronological age 89% of students achieved. Westwood (SA Spelling Test) Yr 4-7 Target: At or above chronological age. 73% (8/11) of students achieved target. Intervention in place for students identified.Students who have not achieved the target – aim to show growth of at least 6 months in Waddington or SAST Test over a year. Students who did not achieve target showed growth of at least 4 and upto 30 months. Intervention in place for students identified.
Minimum Lexile (Reading) levels: Yr 3: 300, Yr 4 : 400, Yr 5: 500, Yr 6: 600, Yr 7: 700 88% of students achieved or surpassed the targets.Praiseworthy results in Literacy include: 11 students (61%) reading a lexile level 200 more than the target for their year level.
PAT-M (Maths) target for Yr 2-7: Minimum Stanine 5: 55% of students at or above stanine 5. 20% just below at stanine 4. Whilst growth has been achieved, targets haven’t so this will remain an area of focus for 2015.
Annual Report 2014
5.1 NAPLAN
Due to the small size of some year levels, it is not appropriate to comment on some aspects of our data in order to maintain confidentiality and anonymity.
NAPLAN Targets:Yr3,5,7: At or above Australian School Average (Index Mean) & National Minimum Standard (NMS) in Reading. Yr3,5,7: At or above Australian School Average & National Minimum Standard in Writing and Language Conventions NAPLAN- almost all students achieved above target (National Minimum Standard in Reading, Writing, Grammar & Punctuation, Numeracy & Spelling) and 63% achieved above the index mean in at least three out of the five areas tested.
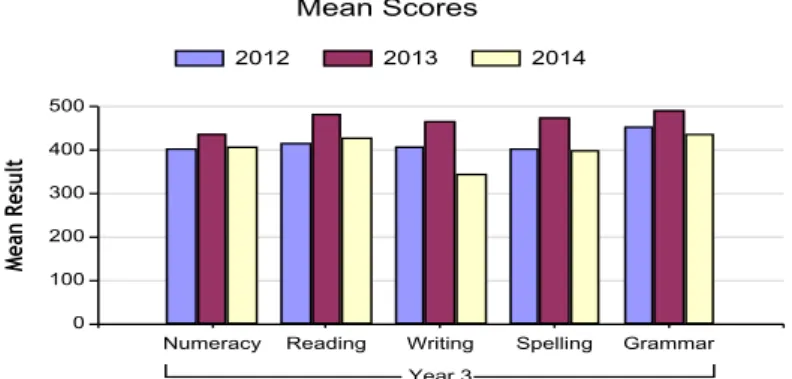
Figure 4: Year 3 Mean Scores
Table 4: Year 3 Mean Scores Mean Scores by Test Aspect Year 3 2012 2013 2014 Numeracy 405.2 438.3 406.7 Reading 417.4 484.7 430.0 Writing 410.5 467.1 345.9 Spelling 403.8 474.2 399.0 Grammar 455.1 493.9 438.5
Year 3 mean scores were lower than previous two years in some areas. This is due to having small cohorts of students- percentages and mean scores can be skewed when dealing with low numbers. One student performing well or poorly can adversely affect the data. Both 2012 and 2013 each had only two students; with six students in 2014.
Annual Report 2014
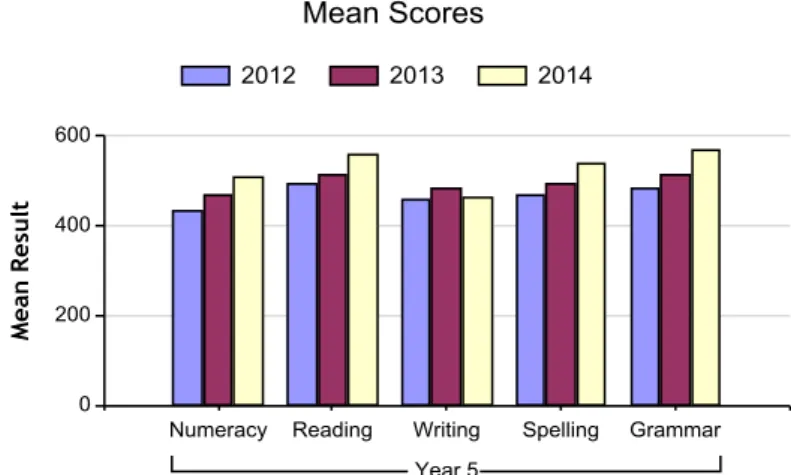
Figure 5: Year 5 Mean Scores
Table 5: Year 5 Mean Scores Mean Scores by Test Aspect Year 5 2012 2013 2014 Numeracy 435.7 470.7 508.9 Reading 497.1 513.8 563.2 Writing 461.1 487.9 465.5 Spelling 469.2 496.7 541.6 Grammar 485.3 516.0 569.7
Year 5 mean scores have improved on the previous two years and out-perform both Region and Index mean scores in all areas of NAPLAN.
Annual Report 2014
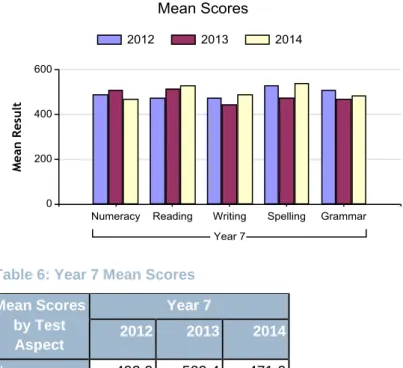
Figure 6: Year 7 Mean Scores
Table 6: Year 7 Mean Scores Mean Scores by Test Aspect Year 7 2012 2013 2014 Numeracy 492.9 509.4 471.0 Reading 477.7 514.2 531.0 Writing 475.0 447.1 488.4 Spelling 530.6 475.3 540.5 Grammar 512.4 471.3 484.8
Year 7 mean scores are lower than previous years in numeracy, but showed some improvement from 2013 results in reading, writing, spelling and grammar..
Annual Report 2014
6. STUDENT DATA
6.1 Attendance
There was a direct correlation between students with the greatest proportion of absences throughout the year and the least growth in achievement. Such observations were recorded in students’ reports at the end of each semester by the classroom teachers. Regular phone calls and follow up with students and families if absent. A mid term and end of each term attendance record is sent home to all families.
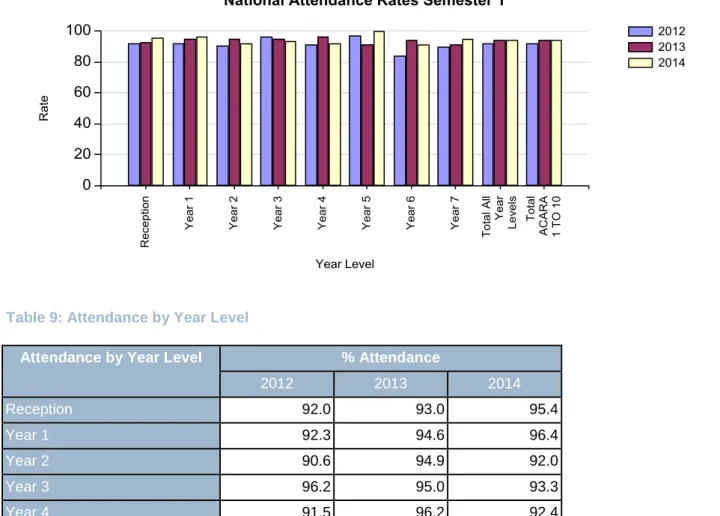
Whilst we are very pleased to see that our attendance has significantly improved over the past three years, our small numbers mean that a few absences or just one or two students can make a big difference to our data. We have been highly vigilant in following up absences.
Figure 9: Attendance by Year Level
Table 9: Attendance by Year Level
Attendance by Year Level % Attendance
2012 2013 2014 Reception 92.0 93.0 95.4 Year 1 92.3 94.6 96.4 Year 2 90.6 94.9 92.0 Year 3 96.2 95.0 93.3 Year 4 91.5 96.2 92.4 Year 5 97.4 91.1 99.7 Year 6 83.9 94.5 91.1 Year 7 89.6 91.2 94.9
Total All Year Levels 92.1 93.9 94.3
Annual Report 2014
6.2 Destination
Leave Reason 2013
School Index DECD
No % % % Employment 3.5% 3.0% Interstate/Overseas 10.5% 10.1% Other 0.5% 1.4% Seeking Employment 3.2% 3.6% Tertiary/TAFE/Training 5.5% 4.6% Transfer to Non-Govt Schl 1 12.5% 10.2% 9.7% Transfer to SA Govt Schl 7 87.5% 46.2% 47.4% Unknown 20.3% 20.1%
Annual Report 2014 7. CLIENT OPINION
Parent Opinion Strongly disagree Disagree agree nor Neither
disagree
Agree Strongly agree N/A
Teachers at this school expect my child to do
his or her best. 3 3
Teachers at this school provide my child with useful feedback about his or her school work.
3 2
Teachers at this school
treat students fairly. 1 1 3
This school is well
maintained. 4 2
My child feels safe at
this school. 3 3
I can talk to my child’s teachers about my
concerns. 4 2
Student behaviour is well managed at this school.
4 2
My child likes being at
this school. 3 3
This school looks for
ways to improve. 3 3
This school takes parents’ opinions
seriously. 4 2
Teachers at this school motivate my child to learn.
3 3
My child is making good
progress at this school. 4 2
My child's learning needs are being met at this school.
4 2
This school works with me to support my
Annual Report 2014
Student Opinion disagree Strongly Disagree agree nor Neither
disagree
Agree Strongly agree N/A My teachers expect me
to do my best. 1 (7%) 9 (60%) 5 (33%)
My teachers provide me with useful feedback about my school work.
4 9 (60%) 2
Teachers at my school
treat students fairly. 2 5 6 2
My school is well
maintained. 1 4 8 1 1
I feel safe at my school. 1 1 4 6 3
I can talk to my teachers
about my concerns. 2 3 6 4
Student behaviour is well
managed at my school. 2 2 4 5 1 1
I like being at my school. 1 4 8 2
My school looks for ways
to improve. 1 8 5 My school takes students’ opinions seriously. 1 1 5 4 3 1 My teachers motivate me to learn. 1 1 8 4 My school gives me opportunities to do interesting things. 1 1 1 9 2
Annual Report 2014
Staff Opinion Strongly disagree Disagree agree nor Neither
disagree
Agree Strongly agree N/A
Teachers at this school expect
students to do their best. 4
Teachers at this school provide students with useful feedback about their school work.
1 3
Teachers at this school treat
students fairly. 1 3
This school is well maintained. 4
Students feel safe at this school. 4
Students at this school can talk to their teachers about their concerns.
1 3
Parents at this school can talk to
teachers about their concerns. 1 3
Student behaviour is well
managed at this school. 4
Students like being at this school. 1 3
This school looks for ways to
improve. 4
This school takes staff opinions
seriously. 4
Teachers at this school motivate
students to learn. 4
Students’ learning needs are being
met at this school. 1 3
This school works with parents
to support students' learning. 1 3
I receive useful feedback about
my work at this school. 2 2
Staff are well supported at this
school. 1 2
My School website
http://www.myschool.edu.au/ 8. ACCOUNTABILITY
8.1 Behaviour Management
Anti-Bullying surveys were conducted in Term 3 with 4 parent, 9 student and 1 staff responses. The low return makes it difficult to draw reasonable conclusions about this set of data. Most viewing bullying as hardly ever happening, but if it does it’s emotional or verbal. Responses reported being “somewhat happy” to “very pleased” (positively) about how they felt about the management of a reported issue. The school has continued weekly circle time assembly with our CPSW to focus on inclusion and school values. The introduction of the PALS program has also been beneficial. We believe that this has helped to improve the connectedness between students at school.
Fortunately, Robertstown PS has very few behaviour incidents. Most are low level and isolated incidents. Parents are contacted regularly to ensure any concerns are communicated and plans for
Annual Report 2014
8.2 Criminal History Screening
A SAFE team Screening Audit was conducted on 9/12/14, with four items requiring follow-up. One is to continue to implement the process of recording clearance data on EDSAS/excel register. Another is having formal documentation regarding the recruitment and induction of volunteers. Another is person awaiting DCSI clearance (application lodged August) and one other person has incorrect screen (National Police Clearance) so will be required to have DCSI instead. It is anticipated that compliance will be achieved by the start of the 2015 year.
8.3 HUMAN RESOURCES - Workforce Data
8.3.1 Teacher Qualifications
All teachers at this school are qualified and registered with the SA Teachers Registration Board.
Qualification Level Number of
Qualifications
Bachelor Degrees or Diplomas 4
Post Graduate Qualifications 1
Please note: Staff that have more than 1 qualification will be counted more than once in the above qualification table. Therefore the total number of staff by qualification type may be more than the total number of teaching staff.
8.3.2 Workforce Composition including Indigenous staff
Workforce Composition
Teaching Staff Non-Teaching Staff
Indigenous Non Indigenous Indigenous Non Indigenous
Full-time Equivalents 3.1 1.47
Persons 4 2
9. FINANCIAL STATEMENT
Income by Funding Source
Funding Source Amount
1 Grants: State 558,427.53
2 Grants: Commonwealth
3 Parent Contributions 13,918.50