Predictive Model for supporting ITIL Business Change
Management Processes
Jan Suchy1,*, Milan Suchy1, 1 GRADIENT ECM, Kosicka 56,
82108 Bratislava, Slovakia
{Jan.Suchy, Milan.Suchy}@gradientecm.com
Abstract. This research describes Predictive Model created for purpose of supporting ITL Business Change Management. On basis of real live logs from Interactions, Incidents and Change Management processes we defined specific Impact-patterns which describe impact of implemented Changes on the workload at the Service Desk and/or IT Operations. Parameters informing about time period needed to return to a Steady State and average increased/decreased volume of Interactions and Incidents are defined for Impact-patterns. The research describes also different options of usage of Predictive Model and presents achieved results of predicted values. In order to affirm that the same or better service levels is delivered after each Change implementation, we evaluated Service Components and Configuration Items and areas for improving actual state were identified. We presented also analysis aimed for continuous improvement of Standard Operation Procedures.
Keywords: data mining, process mining, ITIL, event logs, predictive model
1 Introduction
Case files of the Interaction, Incident and Change Management process and one event log of Incident activities were provided by Rabobank Group ICT. These files are used for fact-based insight into the impact of Changes to the workload at the Service Desk and IT Operations. Case files of Interactions, Incidents and Changes include 147 004, 46 606 and 30 275 cases. Incident activity log include 46 616 cases and 466 737 events.
Main subject of this paper is creation of Predictive Model. This Predictive Model should contain information, which would help supporting Business Change Management in implementing future Changes.
Forming of Predictive Model was anticipated by three phases, which are data discovery, data preparation and model definition. In first phase we chose relevant attribute, by which we were able to identify relations between Interactions, Incidents
* Corresponding author. Tel.: +421 918 400 197
and Changes and we could describe their characteristics. In second phase we defined Impact-patterns and their parameters. In third phase we defined Predictive Model. Inputs to this Predictive Model were represented by values of Impact-patterns, which were accumulated after each Change implementation. Consequently we predicted impact of future Change to workload at Service Desk and IT Operations for each Configuration Item and Service Component.
In this paper we portrayed evaluation of delivered service levels and also new insight on provided data in order to help Change implementation teams to continuously improve their Standard Operation Procedures.
The rest of the paper is structured as follows. The next section shows which tools we used and descriptions of the data. In section following after that we described data preparation, Impact-patterns and process of creating Predictive Model. We also validated results of predictions of Predictive Model and presented means of its use which could help Business Change Management. The final section represents analysis to help Change implementation teams.
2 Materials and Methods
2.1 Tools Used for Analysis
In order to achieve goal of this challenge, we used process mining tools, data mining tool, database management system and spreadsheet application for purposes of understanding the data better and creating Predictive Model for supporting ITIL Business Change Management.
2.1.1 RapidMiner 6
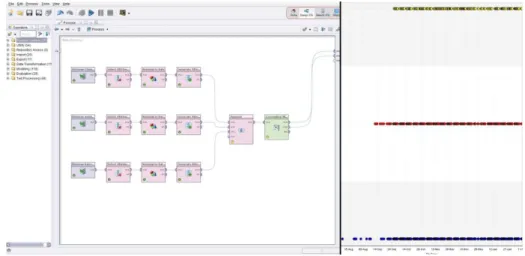
We used RapidMiner 6.0 (Starter Edition) as data mining tool. RapidMiner is a widely used data mining toolset which provides us with rich data visualization and statistical information about attributes of datasets.
Fig. 1 RapidMiner process design view and Interactions (blue), Incidents (red) and Changes (yellow) as they occurred in time
2.1.2 Disco and Nitro
We procured Disco (Version 1.6.7; Fluxicon, The Netherlands) as process mining tool and loaded prepared project with datasets from process owner. We used Disco for acquainting us with prepared case-files with anonymous information from Rabobank Netherlands Group ICT and for data validation of partial results throughout development of Predictive Model.
Nitro (Version 3.1.2; Fluxicon, The Netherlands) was used for importing custom datasets and inspecting cases and statistics of attributes. Main reason for using Nitro was limited import of log files in Disco demo mode.
2.1.3 Microsoft Excel, .NET Framework and C# language
To demonstrate results which we have achieved during this challenge, we choose Microsoft Excel (Microsoft Office 2013; Microsoft Corporation). This spreadsheet application is useful to draw charts and offers a lot of “Add-Ins” suitable for data handling.
Purpose of this challenge was to create Predictive Model, which could be easily reusable for another implemented ITIL processes. In order to meet the target, we needed to apply different data preprocessings, conversions and mathematical functions. This is why we decided to use .NET 4.5 programing framework and C# language.
2.2 Description of the Data
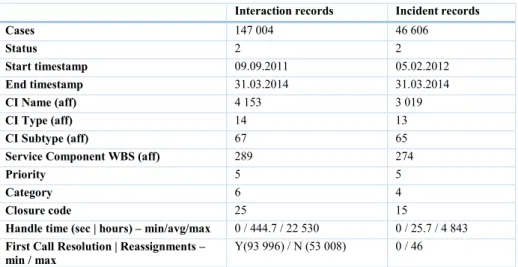
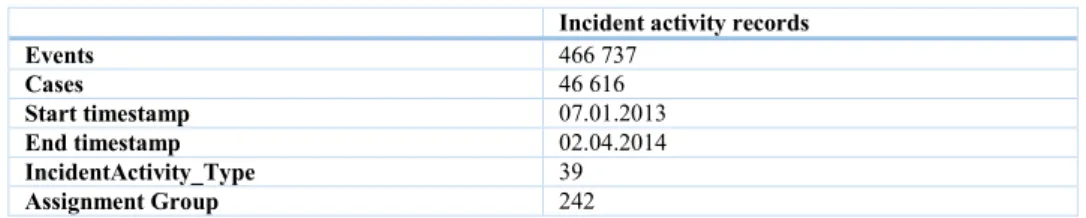
Process owner prepared for this challenge three case-files and one activity log. The files contain recorded details from an ITIL Service Management tool (HP Service Manager). Provided case-files describe occurrence of Interactions, Incident and Changes in Rabobank. Incident activity records contain system logged activities, which describe steps to resolve Incident and are related to Incident case-file by “Incident ID”. <Tab. 1> contains shortened information about Interaction and Incident records. <Tab. 2> contains information about Change records and <Tab. 3> contains information about Incident activity records.
Interaction records Incident records
Cases 147 004 46 606 Status 2 2 Start timestamp 09.09.2011 05.02.2012 End timestamp 31.03.2014 31.03.2014 CI Name (aff) 4 153 3 019 CI Type (aff) 14 13 CI Subtype (aff) 67 65 Service Component WBS (aff) 289 274
Priority 5 5
Category 6 4
Closure code 25 15
Handle time (sec | hours) – min/avg/max 0 / 444.7 / 22 530 0 / 25.7 / 4 843 First Call Resolution | Reassignments –
min / max Y(93 996) / N (53 008) 0 / 46
Tab. 1 Shortened information about Interaction and Incident records
Change records Events 30 275 Cases 18 000 Start timestamp 01.10.2013 End timestamp 31.03.2014 CI Name (aff) 10 193 CI Type (aff) 13 CI Subtype (aff) 74 Service Component WBS (aff) 286 Change Type 240
Risk Assessment Minor(28 445), Business(1 717), Major(113) Emergency Change Y (90), N (30 185)
CAB-approval needed Y (1 998), N (28 277)
Originated from Problem(19 497), Incident(10 776), Interaction(2) Tab. 2 Shortened information about Change records
Incident activity records Events 466 737 Cases 46 616 Start timestamp 07.01.2013 End timestamp 02.04.2014 IncidentActivity_Type 39 Assignment Group 242
Tab. 3 Shortened information about Incident activity records
2.3 Data preprocessing
At this point we defined attributes of all datasets. It is important to select valuable attributes of each dataset, because selecting the wrong attribute would lead to incorrect or unexpected results. Based on Quick reference BPI Challenge 20142 we selected valuable attributes which were used in Impact-patterns and Predictive Model. Incident record contains two important attributes - “Closed Time” and “Resolved Time”, which indicate that the service disruption is solved and they are logged differently. When an operator resolves the Incident, he can change the status value of the Incident to “Resolved”, activity is logged and then he can check with the customer if the disruption was really solved before he closes the Incident. More often, the operator will immediately close the Incident after resolving the service disruption and resolved time will be set automatically, in this case Incident activity “Resolved” is not created3. Based on previous note, we have decided that we will operate with “Resolved Time” as it would be end timestamp of Incidents. The main reason for operating with “Resolved Time” attribute instead of operating with “Closed Time” attribute is that we expect that the Change not only causes the increased volume of Incidents, but it may also cause the decreased volume of Incidents and that “Closed Time” is equal to administrative closure of the record. When attribute “Resolved Time” was missing we chose to consider attribute “Closed Time” as time when incident was solved.
Change records contain several timestamp attributes like “Planned Start/End”, “Scheduled Start/End”, “Actual Start/End” which are inputted manually and “Change record Open/Close Time” which are system-driven. For purposes of this challenge, we operated with the “Actual End” attribute as end timestamp for the implementation of the Change. When attribute “Actual End” was missing we chose to consider attribute “Planed End” as end timestamp for the implementation of the Change. Sometimes both “Actual End” and “Planed End” attributes were missing, in this situation we chose to operate with “Change record Close Time” attribute.
2 http://www.win.tue.nl/bpi/_media/2014/quick_reference_bpi_challenge_2014.pdf
We needed to merge the Incident records with Incident activity records in order to achieve easier data handling and obtain Incident processes with case and event level attributes.
3 Predictive Model
The ultimate challenge of the BPI 2014 was to design a Predictive Model, which will support Business Change Management in implementing software releases with less impact on the Service Desk and IT Operations. To achieve this goal, we needed to create a mechanism, which would include Impact-patterns and be efficient in predicting the workload at Service Desk and IT Operations by using ITIL process logs.
3.1 Data Discovery
Provided datasets by Rabobank contain 14 332 unique Configuration Items which occurred at least once in Interaction records or Incident records or in Change records. Among those Configuration Items:
1 551 (10.9%) occurred only in Interaction records 473 (3.3%) occurred only in Incident records 9 614 (67%) occurred only in Change records
2 005 (14%) occurred only in Interaction and Incident records 87 (0.6%) occurred only in Interaction and Change records 32 (0.2%) occurred only in Incident and Change records 570 (4%) occurred in Interaction, Incident and Change records
A Configuration Item can be related to just one Service Component at the time. Therefore, Configuration Item will be computed in Predictive Model as many times as it has been related to different Service Components. It allows us to compare behaviour of Configuration Item in different Service Components.
From the prospective of Service Components, datasets contain 338 unique Service Components that occurred at least once in Interaction records or Incident records or Change records. Among those Service Components:
7 (2%) occurred only in Interaction records 2 (0.6%) occurred only in Incident records 46 (13.6%) occurred only in Change records
43 (12.7%) occurred only in Interaction and Incident records 11 (3.3%) occurred only in Interaction and Change records 1 (0.3%) occurred only in Incident and Change records
228 (67.5%) occurred in Interaction, Incident and Change records
Set of Configuration Items is related to Service Component, therefore it is appropriate to create Predictive Model separately for both entities.
3.2 Data Preparation 3.2.1 Configuration Item
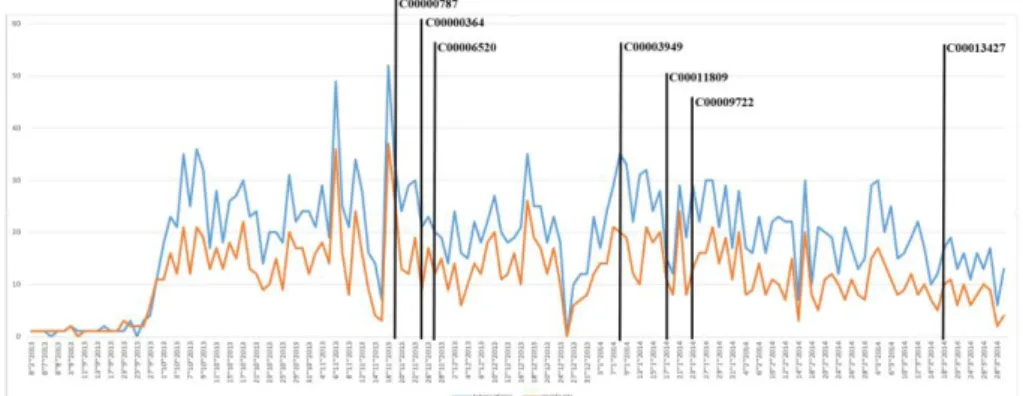
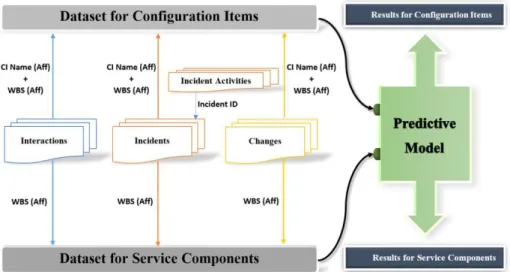
Now, let us look into data used in Predictive Model for prediction of workload to the Service Desk and IT Operations. In order to perform prediction of workload after future changes we needed to fill Predictive Model for Configuration Item with logged data in Interaction, Incident and Change records. Based on attributes “CI Name (aff)” and “Service Component WBS (aff)” we selected Interactions, Incidents and Changes related to Configuration Item as shown on <Fig. 3>. When we made a selection, we obtained dataset for every Configuration Item, which we used as import to Predictive Model and for describing status of Configuration Item after each Change implementation <Fig. 2>.
Fig. 2 Occurrence of Interactions (blue) and Incidents (orange) in time with marked Changes (black) for Configuration Item “SBA000607” related to Service
Component “WBS000263”
3.2.2 Service Component
Based on attribute “Service Component WBS (aff)” we selected Interactions, Incidents and Changes related to Service Component as shown on <Fig. 4>. Through the same process as described above, we obtained dataset for every Configuration Items and for every Service Component.
Fig. 3 Schema of data preparation for Predictive Model
Conclusion. After we had obtained input data for Predictive Model, we were able to identify any patterns that may be visible after Change implementation.
3.3 Impact-patterns
Rabobank suggests that there is a correlation between the implementation of Change and the workload at the Service Desk and IT Operations. The main goal of this part is to describe Impact-patterns whose calculated values will describe correlation between the implementation of Change and workload at the Service Desk and IT Operations. Impact-patterns are used for prediction in Predictive Model for Configuration Items and Service Components.
3.3.1 Identification of Impact-patterns for Service Desk
The main task of Service Desk is to log calls/emails concerning disruption of ICT-services in Interaction-record. If we observe how a Service Desk Agent handles calls/email, we will be able to record for example number of call/mails incoming in one hour, time needed to handle a call or what is an average number of calls/mails resolved directly per hour. In this section we identified set of Impact-patterns to describe impact at Service Desk. Impact-patterns accumulate calculated values after each Change implementation and form the basis for Predictive Model.
3.3.1.1 Daily volume of Interactions
Impact-pattern describes volume of Interactions, in which timestamp attribute “Open Time (First Touch)” is logged later than currently investigated Change timestamp attribute “Actual End” and earlier than next observed Change implementation and we
will called these Interactions “Open Interactions”. These Impact-pattern will be called as “Average Daily Volume of Open Interactions”. <Fig. 4>, in this context shows several possible occurrences of Interactions in time between Changes. Additional information of this Impact-pattern are:
Average Daily Volume of Open Interactions
Average number of “Open Interaction” per day Open-Unclosed Interactions
Number of Interactions, in which attribute “Open Time (First Touch)” is logged later than currently investigated Change and earlier than next observed Change implementation and attribute “Close Time” is logged later than next Change implementation, we will call “Open-Unclosed Interactions”, these Interactions represent “Interaction C” in <Fig. 4>
Open-Unclosed Interactions First Call Resolution ratio
Describes percentage of “Open-Unclosed Interactions” which had value “YES” in attribute “First Call Resolution”
Open-Closed Interactions
Number of Interactions, in which attribute “Open Time (First Touch)” is logged later than currently investigated Change and attribute “Close Time” is logged earlier than next Change implementation we will call “Open-Closed Interactions”, these Interactions represent “Interaction B” in <Fig. 4>
Open-Closed Interactions First Call Resolution ratio
Describes percentage of “Open-Closed Interactions” which had value “YES” in attribute “First Call Resolution”
Running Interactions
Number of Interactions, in which attribute “Open Time (First Touch)” is logged earlier than currently investigated Change and attribute “Close Time” is logged later than next Change implementation, we will call “Running Interactions” and they are represented by “Interaction D” in <Fig. 4>
Fig. 4 Illustration of occurrence of Interactions/Incidents.
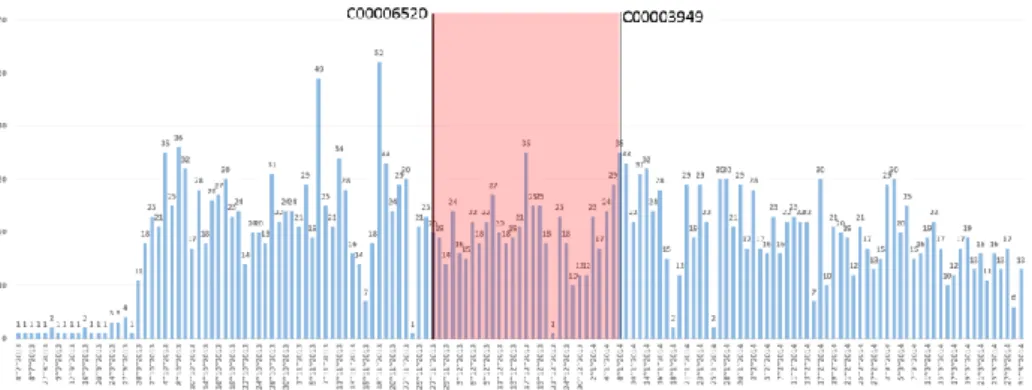
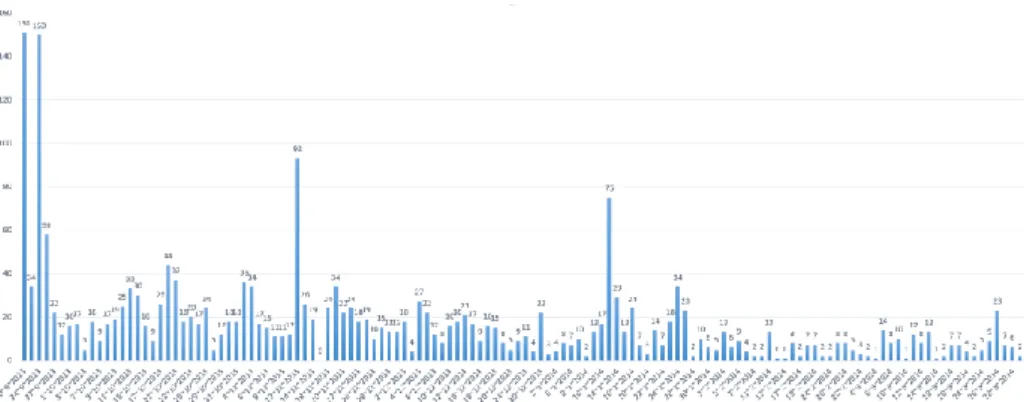
Outcome of this pattern is information about workload at Service Desk, which describes volume of Interactions which were recorded after the monitored Change. On <Fig. 5> is portrayed volume of Interactions how they were recorded in time on the Configuration Item “SBA000607” related to Service Component “WBS000263”.
Fig. 5 Volume of monitored Interactions in time on the Configuration Item “SBA000607” related to Service Component “WBS000263” with marked time lap for
Change with ID “C00006520”. This marked time lap represents input for calculation of pattern “Average Daily volume of Open Interaction” after this Change
In addition to pattern “Average Daily Volume of Open Interactions” we calculated also average volume of Interactions, whose timestamp attribute “Open Time (First Touch)” is logged earlier than currently investigated Change and timestamp attribute “Close Time” is logged later than currently investigated Change and earlier than next observed Change implementation at the same time. An amount of “Open-Closed Interactions” is added to them also, for purposes of covering the total number of Interactions, which are closed after Change implementation. We will call these Interactions “Closed Interactions” and they are represented as “Interaction A” in <Fig. 4>. We name Impact-pattern described above as “Average Daily Volume of Closed Interactions” and it shows number of Interactions which were closed after Change implementation.
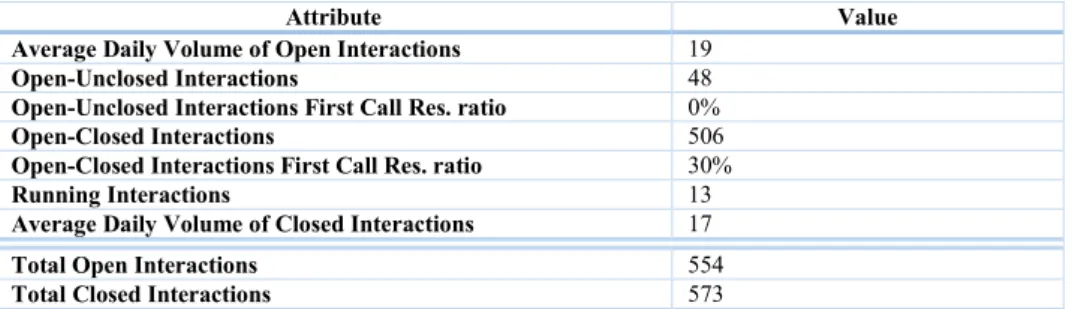
As example of outcome of these Impact-patterns after the Change with ID “C00006520” for Configuration Item “SBA000607”, we present the results in <Tab. 4>.
Attribute Value Average Daily Volume of Open Interactions 19
Open-Unclosed Interactions 48 Open-Unclosed Interactions First Call Res. ratio 0% Open-Closed Interactions 506 Open-Closed Interactions First Call Res. ratio 30% Running Interactions 13 Average Daily Volume of Closed Interactions 17 Total Open Interactions 554 Total Closed Interactions 573
Tab. 4 Results for Configuration Item “SBA000607” related to Service Component “WBS000263” after Change with ID “C00006520”. These outcomes describe volume of Interactions during 42 days, ergo until the next Change with ID
“C00003949” will be observed.
3.3.1.2 Handle Time of Interactions
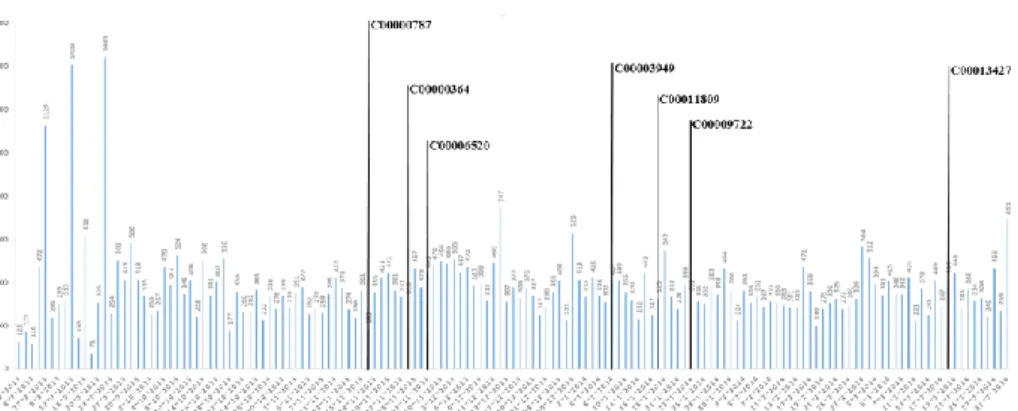
Time needed by Service Desk Agents of Rabobank to resolve the service disruption is measured by ITIL Service Management tool called HP Service Manager. It is represented as attribute “Handle Time (secs)” in Interaction records. In order to follow average time needed to resolve Interactions after each Change implementation we defined new Impact-Pattern: “Average Handle Time to Resolve Interaction”. With help of this pattern we were able to calculate average handle time for all Interactions, in which timestamp attribute “Open Time (First Touch)” is logged later than currently investigated Change timestamp attribute “Actual End” and earlier than next observed Change implementation. <Fig. 6> shows the nature of “Average Handle Time to Resolve Interaction” over time.
Fig. 6 Average Handle Time to resolve Interaction recorded on Configuration Item “SBA000607” related to Service Component “WBS000263” per day
We extended the pattern “Average Handle Time to Resolve Interaction” with “Priority ratio”. We created this extension using attribute “Priority” in Incident records. This attribute describes priority for the Assignment Group to resolve the service disruption and contains figures from “1” to “5”. Purpose of “Priority ratio” is to express priority level in which Interactions were recorded after each Change implementation.
<Tab. 5> shows results for “Average Handle Time to Resolve Interaction” and “Priority ratio” calculated for Configuration Item “SBA000607” related to Service Component “WBS000263”.
Priority ratio - value (%)
Change ID Avg. Handle Time 5 4 3 2 1 C00000787 375.87 60(35.3) 105(61.8) 5(2.9) 0(0.0) 0(0.0) C00000364 401.69 21(40.4) 31(59.6) 0(0.0) 0(0.0) 0(0.0) C00006520 405.65 200(36.1) 351(63.4) 3(0.5) 0(0.0) 0(0.0) C00003949 327.66 87(42.4) 108(57.6) 0(0.0) 0(0.0) 0(0.0) C00011809 330.28 42(49.4) 43(50.6) 0(0.0) 0(0.0) 0(0.0) C00009722 338.45 333(44.3) 408(54.4) 9(1.2) 1(0.1) 0(0.0) C00013427 392.13 65(47.8) 68(50.0) 3(2.2) 0(0.0) 0(0.0)
Tab. 5 The nature of “Average Handle Time to Resolve Interaction” and “Priority ratio” for Configuration Item “SBA000607” related to Service Component “WBS000263” after each logged Change implementation (in chronological order)
3.3.2 Identification of Impact-patterns for IT Operations
We can monitor conduct of Operator in similar way as we can monitor conduct of Service Desk Agent. Function of Operator is to resolve the issue for the customer. If we observe Operator during solving issue, we could record for example number of
issues solved per day/week, how many steps are needed to solve different issues or what is average time needed to solve the issue per day/week. In this section we identified set of Impact-patterns to describe impact on IT Operations. Impact-patterns accumulate calculated values after each Change implementation and form the basis for Predictive Model.
3.3.2.1 Daily volume of Incidents
Impact-pattern describes volume of Incidents, in which timestamp attribute “Open Time” is logged later than currently investigated Change timestamp attribute “Actual End” and earlier than next observed Change implementation, we will call these Incidents “Open Incidents”. This Impact-pattern will be called as “Average Daily Volume of Open Incidents”. <Fig. 4> illustrates situations of occurrences of Incidents between Changes. Additional information to this pattern are:
Average Daily Volume of Open Incidents
Average number of “Open Incidents” per day Open-Unresolved Incidents
Number of Incidents, in which attribute “Open Time” is logged later than currently investigated Change and attribute “Resolved Time” is logged later than next Change implementation, we called “Open-Unresolved Incidents”, these Incidents represent “Incident C” on <Fig. 4>
Open-Resolved Incidents
Number of Incidents, in which attribute “Open Time” is logged later than currently investigated Change and attribute “Resolved Time” is logged earlier than next Change implementation we call “Open-Resolved Incidents”, these Incidents represent “Incident B” on <Fig. 4>
Running Incidents
Number of Incidents, in which attribute “Open Time” is logged earlier than currently investigated Change and attribute “Resolved Time” is logged later than next Change implementation, we call “Running Incidents” and are represented by “Incident D” on <Fig. 4>
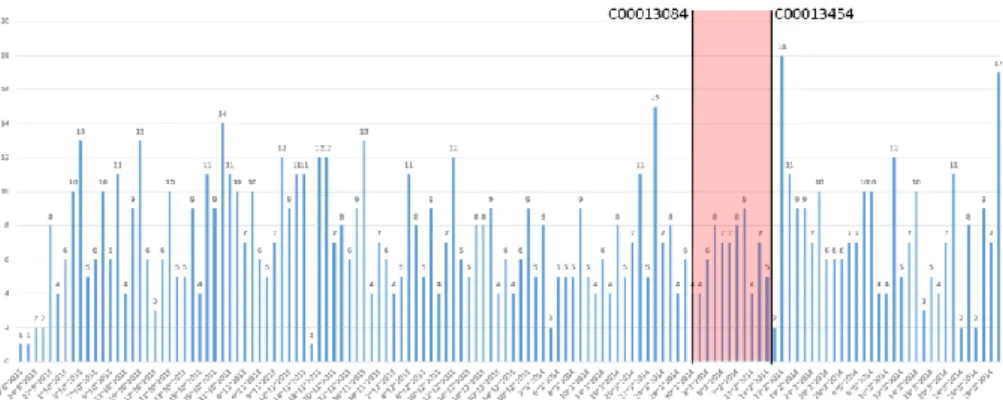
Outcome of this pattern is information about workload at IT Operations, which describes volume of Incidents which were recorded after the monitored Change. On <Fig. 7> is described volume of Incidents as they were recorded in time on the Configuration Item “WBA000011” related to Service Component “WBS000152”.
Fig. 7 Volume of monitored Incidents in time recorded on Configuration Item “WBA000011” related to Service Component “WBS000152” with marked time lap
for Change with ID “C00013084”. This marked time lap represents input for calculation of pattern “Average Daily Volume of Open Incidents” after this Change.
Analogically as in pattern “Average Daily Volume of Open Interactions” we also monitored in this pattern, average volume of Incidents, in which timestamp attribute “Open Time” is logged earlier than currently investigated Change and timestamp attribute “Resolved Time” is logged later than currently investigated Change and earlier than next observed Change implementation at the same time. An amount of “Open-Closed Incidents” is added to them also, in order to cover total number of Incidents, which are resolved after Change implementation. We call these Incidents “Resolved Incidents” and they are represented by “Incident A” on <Fig. 4>. We call Impact-pattern described above as “Average Daily Volume of Resolved Incidents” and it represents number of Incidents which were resolved after Change implementation.
As example of outcome of these Impact-patterns after the Change with ID “C00013084” for Configuration Item “WBA000011”, we present results in <Tab. 6>.
Attribute Value Average Daily Volume of Open Incidents 6
Open-Unresolved Incidents 2 Open-Resolved Incidents 65 Running Incidents 3 Average Daily Volume of Resolved Incidents 7 Total Open Incidents 67 Total Resolved Incidents 76
Tab. 6 Results for Configuration Item “WBA000011” related to Service Component “WBS000152” after Change with ID “C00013084”. These results describe volume of Interactions during 15 days, ergo until the next Change with ID
3.3.1.2 Handle Time and Average Activity Count of Incidents
The time needed for Operator to resolve the service disruption is recorded during handling Incidents, similarly as during handling Interactions in HP Service Manager tool. This pattern is represented by attribute “Handle Time (Hours)” in Incident records. In order to cover average time needed to resolve Incident after each Change implementation we defined Impact-Pattern called “Average Handle Time to Resolve Incident”. With help of this pattern we were able to calculate average handle time for all Incidents, in which attribute “Open Time” is logged later than currently investigated Change timestamp attribute “Actual End” and earlier than next observed Change implementation. <Fig. 8> shows the nature of “Average Handle Time to Resolve Incident” over time.
Fig. 8 Average Handle Time to resolve Incident per day on Configuration Item “WBA000011” related to Service Component “WBS000152”
Next Impact-pattern used for describing workload at IT Operations, which we identified was “Average Activity Count”. In order to calculate this pattern, we preprocessed data by merging Incident records and Incident activity records. Purpose of “Average Activity Count” is to express average number of steps needed to resolve Incidents after each Change implementation. As an additional information for this pattern we add average and maximum number of Reassignments.
<Tab. 7> shows results of “Average Handle Time to Resolve Incidents” and “Average Activity Count” calculated for Configuration Item “SBA000607” related to Service Component “WBS000263”.
Change ID Avg. Handle Time (Hours) Average Activity Count Avg/Max num. of Reassignments C00000787 47.88 21 4 / 23 C00000364 55.07 23 5 / 18 C00006520 42.82 18 4 / 33 C00003949 37.97 16 3 / 20 C00011809 50.30 15 3 / 18
C00009722 36.44 15 3 / 22 C00013427 11.62 10 2 / 10
Tab. 7 The nature of “Average Handle Time to Resolve Incidents” and “Average Activity Count” with number of Reassignments for Configuration Item “SBA000607”
related to Service Component “WBS000263” after each logged Change implementation (in chronological order)
3.4 Parameters for Impact-patterns
Usually, the first few days after the Change implementation there is a peak in volume of Interactions/Incidents. In the first step we determined the time needed to overcome the peak. In the second step we compared values of volume prior to the Change implementation with the values of volume after overcoming the peak. We used this determined time to calculate volume of “Open Interactions” and “Closed Interactions” for purposes of comparing their increase or decrease with values prior to the Change implementation. <Fig. 9> demonstrates process of determining Steady State values. Steady State gives an indication of the quality of Change implementation, which contains information about:
time period to return to Steady State
increase/decrease in volume of Impact-pattern once a Steady State is reached increase/decrease in volume of the “Open Interactions” once a Steady State
is reached
increase/decrease in volume of the “Closed Interactions” once a Steady State is reached
Steady State was calculated for Impact-Patterns: Average Daily Volume of Open Interactions Average Daily Volume of Closed Interactions Average Handle Time to Resolve Interaction Average Daily Volume of Open Incidents Average Daily Volume of Resolved Incidents Average Handle Time to Resolve Incident Average Activity Count
Steady state is calculated after each Change implementation for all of the Impact-patterns mentioned above in the same way for Configuration Items and for Service Components and is one of the inputs for the Predictive Model.
Fig. 9 Illustration of calculating Steady State for Impact-pattern “Average Daily Volume of Open Incidents” after Change implementation “C00002785” in Configuration Item “WBA000011” related to Service Component “WBS000152”
In <Tab. 8> are calculated Steady States for Impact-patterns after Change “C00002785” implementation for Configuration Item “SBA000607” related to Service Component “WBS000152”. Results are represented as:
TimeToReach (Business days)
Time for overcoming the peak of monitored Impact-pattern after Change implementation
Difference
increase/decrease in volume of Impact-pattern Sopen
increase/decrease in volume of the “Open Interactions” Sclosed
TimeToReach(Bu siness days)
Difference Sopen Sclosed Average Daily Volume
of Open Interactions
2 d 15 h (2.5) 0 0 -2 Average Daily Volume
of Closed Interactions
2 d 16 h (2.5) -2 0 -2 Average Handle Time
to Resolve Interaction
2 d 15 h (2.5) 38 0 -2 Average Daily Volume
of Open Incidents
4 d 14 h (4) +1 +3 0 Average Daily Volume
of Closed Incidents
1 d 16 h (1.5) -3 +3 0 Average Handle Time
to Resolve Incident 1 d 16 h (1.5) -13.32 +3 0 Average Activity Count 1 d 16 h (1.5) -8 +3 0
Tab. 8 Parameters of Impact-patterns for Configuration Item “SBA000607” related to Service Component “WBS000152” after Change “C00002785” implementation
3.5 Prediction and Validation
After identifying Impact-patterns and their parameters, we had a complete input for Predictive Model. We chose linear regression to fit Predictive Model to datasets of observed Impact-patterns. We used fitted model to make a prediction of impact after future Change implementation. In conclusion, we predicted next value for each Impact-pattern from data observed after each Change implementation. This applies also to Configuration Item and Service Component. Prediction was realized for these Impact-patterns:
Average Daily Volume of Open Interactions Average Daily Volume of Closed Interactions Average Handle Time to Resolve Interaction Average Daily Volume of Open Incidents Average Daily Volume of Resolved Incidents Average Handle Time to Resolve Incident Average Activity Count
Output of Predictive Model is prediction of impact of future Change to the workload at the Service Desk and IT Operations. As an additional information we calculated also average impact of implemented Changes to the workload at the Service Desk and IT Operations. To demonstrate predicted results we chose Configuration Item “WBA000011” related to Service Component “WBS000152”. On this Configuration item has already been implemented 29 Changes. To fit a Predictive Model we used 28 Changes, then we predicted the impact of the last recorded 29th Change
(“C00018239”) and compared predicted impact with recorded impact. <Tab. 9> shows impact of recorded, predicted and average Change.
C00018239 Predict Average Average Daily Volume of Open
Interactions
13 12 16
Period to return to Steady state (BD)
2 2 2
Difference -1 -2 -4
Sopen -1 -2 -4
Sclosed 1 -1 -4
Average Daily Volume of Closed Interactions
14 13 17
Period to return to Steady state (BD)
2 3 2
Difference +1 -4 -5
Sopen -1 -6 -3
Sclosed +1 -4 -5
Average Handle Time to Resolve Interaction
354 440 471
Period to return to Steady state (BD)
2 3 2
Difference -71 -71 -76
Sopen -1 -2 +0
Sclosed +1 -1 -1
Average Daily Volume of Open Incidents
7 7 7
Period to return to Steady state (BD)
2 3.5 3
Difference +0 -2 -1
Sopen -1 -1 -2
Sclosed +1 +0 -1
Average Daily Volume of Resolved Incidents
8 7 8
Period to return to Steady state (BD)
2 2 2
Difference +3 -2 -2
Sopen -1 -1 +2
Sclosed +1 +0 -1
Average Handle Time to Resolve Incident
5.8 3.5 13.8
Period to return to Steady state (BD)
5 3 3
Difference -2.8 -1 -5
Sopen +21 +7 +2
Sclosed +26 +7 +2
Average Activity Count 8 9 12 Period to return to Steady
state (BD)
3 2.5 2.5
Difference -4 -2 -3
Sopen +5 +6 +3
Sclosed +2 +4 +2
Tab. 9 shows recorded impact (1st column) compared with predicted impact (2nd column) and average impact (3rd column) of implemented Change. We compared last
recorded 29th Change “C00018239” for Configuration Item “WBA000011” related to Service Component “WBS000152”
From the compared impacts shown on <Tab. 9>, we can see that values of Predicted Model are with little divergence identical with recorded impact. One of the bigger divergences was monitored in parameter Steady State of Impact-pattern “Average Handle Time to Resolve Incident”, where the Predictive Model predicted increase with lower volume of “Open Interactions” and “Closed Interactions” than it was after recorded Change. Another bigger divergence was monitored in parameter Steady State of Impact-patter “Average Daily Volume of Closed Interactions”, where the Predictive Model predicted decrease by 4 in volume of this pattern, whereas in the recorded Change we monitored increase by 1.
We applied this comparison to a number of Configuration Items and Service Components. From the results of this comparisons we found out that the larger size of dataset used as input to Predictive Model and the smaller range of values, the more accurate prediction of impact of future Change is calculated.
3.6 Usage of Predictive Model
Predictive Model as is designed predicates workload at Service Desk and IT Operations on basis of all implemented Changes recorded in Change records. We created dataset of impacts after each Change implementation for every Configuration Item and Service Component. This datasets, as shown on <Fig. 10>, contain information about implemented Change, for example: “Change ID”, “Actual End”, “Change Type”, “Risk Assessment”, “Emergency Change”, “CAB-approval needed”, “Originated from” etc. and information about impact of each Change.
Fig. 10 shows part of information about Changes recorded on Configuration Item “WBA000133” related to Service Component “WBS000073”
From the monitored results we can deduce, that the conduct of Configuration Item “WBA000133” is influenced by Changes, that are different in attributes like: “Change Type”, “Risk Assessment”, “Emergency Change” and so on. As we have predicted impact for every recorded Change, we can predicate also impact for each Change Model.
To demonstrate the predictions of impact of Changes with specific Change Model we chose Configuration Item mentioned above. We compared impact of Change Models “Release Type 13-Major Business Change” and “Standard Change Type 06-Business Change”. Results of impact of chosen Change Models are shown in <Tab. 10>. This comparison can be repeated for different Change Models.
Impact-patterns Release Type 13-Major Business Change
Standard Change Type 06-Business Change Average Daily Volume of
Open Interactions
49 38
Period to return to Steady state (BD)
4 2
Difference +10 -10
Sopen +10 -10
Sclosed +20 -15
Average Daily Volume of Closed Interactions
41 39
Period to return to Steady state (BD)
4 2
Sopen +19 +3
Sclosed +6 -21
Average Handle Time to Resolve Interaction
554 475
Period to return to Steady state (BD)
2 2
Difference +88 -56
Sopen +30 -2
Sclosed +10 -13
Average Daily Volume of Open Incidents
24 13
Period to return to Steady state (BD)
4 4
Difference -1 -8
Sopen +15 -12
Sclosed +15 -24
Average Daily Volume of Resolved Incidents
15 14
Period to return to Steady state (BD)
5 2
Difference +2 -2
Sopen +19 -2
Sclosed +18 -24
Average Handle Time to Resolve Incident
30 10
Period to return to Steady state (BD)
1 2
Difference -171 -7
Sopen +32 -13
Sclosed +13 -23
Average Activity Count 11 8 Period to return to Steady
state (BD)
1 2
Difference -8 +1
Sopen +32 -3
Sclosed +13 -16
Tab. 10 shows predicted impact of future Change for Change Models “Release Type 13-Major Business Change” and “Standard Change Type 06-Business Change”
in Configuration Item “WBA000133” related to Service Component “WBS000073” After comparing predicted workload in <Tab. 10> we can affirm, that higher workload is caused by future Change with Change Model “Release Type 13-Major Business Change” in Component Item “WBA000133”.
During planning of implementation of future Change on any Configuration Item or Service Component we can use Predictive Model for example:
In case that the chosen Change Model of future Change has not been yet implemented, results from prediction for universal Change Model will be used. This means that the prediction will be calculated on grounds of all yet implemented Changes.
In case that we choose Change Model, which has already been implemented, workload will be predicted on grounds of yet implemented Changes with the chosen Change Model.
4 Change in Average Steps to Resolution
In this part we focused on third question from process owner, which is affirming or disproving expectations on delivering the same or better service level after each Change implementation. For achieving this purpose we evaluated Service Components and Configuration Items separately. We chose set of indicators, which are represented by Impact-patterns and are using calculated data for describing increasing or decreasing trend. Monitored indicators are:
Interactions
Volume of Open Interactions per day
Average Time to Resolve Interaction per day
First Call Resolution Ratio per day
Describes ratio of Interactions which had value “YES“ in attribute “First Call Resolution“
Incidents
Volume of Open Incidents per day
Average Time to Resolve Incident per day
Average Activity Count per day
By applying linear regression on indicators we were able to determine whether the values are increasing or decreasing at a steady rate. Consequently we evaluated indicators according to the trend line. Indicators mentioned above are valuated as “0” for stagnating values, “-1” for increasing values and “+1” for decreasing values, except for indicator “First call resolution ratio” which is valuated contrarily. Final evaluation forms summary of partial evaluations as shown on <Fig. 11>.
Fig. 11 shows calculation method for evaluating final level of service delivered for Service Component “WBS000073”
Only Service Components and Configuration Items with one or more Change implementations and at least one Interaction or Incident which occurred after Change implementation were evaluated. Total amount of evaluated Service Components is 231 and of Configuration Items is 549. Overall results are portrayed in v <Tab. 11> and <Tab. 12>.
Score Service Component Configuration Item
+6 7 % 3 % +5 1.7 % 1.5 % +4 12.2 % 5.7 % +3 5.6 % 4.6 % +2 19.9 % 12 % +1 13 % 10.8 % 0 25.5 % 42.5 % -1 4.8 % 9.2 % -2 7.4 % 5.1 % -3 0 % 3 % -4 2.5 % 2.3 % -5 0.4 % 0.3 % -6 0 % 0 %
Tab. 11 shows score and how many Service Components and Configuration Items in percentage reach that score
Indicator Service Component Configuration Item Interactions
Volume of Open Interactions per day
39 % 35 % 25 % 21.4 %
Average Time to Resolve Interaction per day
58.8 % 31.6 % 38.7 % 29.3 % First Call Resolution Ratio
per day 49.3 % 23.3 % 27.5 % 16.3 % Incidents
Volume of Open Incidents per day
36.3 % 26.8 % 18.5 % 16.3 % Average Time to Resolve
Incident per day
65 % 22 % 39 % 24 %
Average Activity Count per day
56.7 % 29.8 % 37.5 % 23.3 % Tab. 12 shows in percentage how many Service Components and Configuration
Items deliver better (green) or worse (red) level of service after each Change implementation for every calculated indicator
5 Insight into Impact of Implemented Changes
In this part we took a look on analysis of recorded impacts of Changes which can help Change implementation teams to continuously improve their Standard Operation Procedures. Dataset containing recorded impacts after each Change implementation was obtained during the process of this research for each Configuration Item and Service Component. Through this analysis we can monitor for example:
What was the workload at the Service Desk and IT Operations for various Service Components and Configuration Items prior to the first Change implementation
After which Change and for which Change Model is the volume of Closed Interactions/Incidents increasing/decreasing the most
After which Change and for which Change Model has the time needed to resolve service disruption increased the most
Which Change or which Change Model causes increasing/decreasing average number of activities needed to resolve Incidents
As an example we present comparison of impacts of Changes with ID “C00006211” and “C00000578” to the workload at the Service Desk and IT Operations for Configuration Item “SBA000439” related to Service Component “WBS000219”.
C00006211 C00000587
Actual End 11/15/2013 1:16:00 PM 12/15/2013 12:00:00 AM Change Type Release Type 06 Master Change Time to next observed Change 4 d 23 h 7 m 3 d 14 h 29 m Daily Volume of Open
Interactions (min / avg / max)
11 / 26 / 46 39 / 58 / 79 Period to return to Steady state
(BD)
3 5
Volume of Open Interactions in Steady State 25 32 Difference -1 -17 Sopen -1 -17 Sclosed -5 -12 Open-Unclosed Interactions (FCR ration in %) 2 (0 %) 15 (0 %) Open-Closed Interactions (FCR ration in %) 103 (87 %) 158 (94 %) Running Interactions 8 56 Daily Volume of Closed
Interactions (min / avg / max)
16 / 29 / 47 39 / 56 / 70 Period to return to Steady state
(BD)
5 5
Volume of Closed Interactions in Steady State
18 32
Difference -17 -12
Sopen +0 -17
Sclosed -17 -12
Average Handle Time to Resolve Interaction
468 554
Period to return to Steady state (BD)
1 3
Average Handle Time in Steady State
415 492
Difference -10 -18
Sopen +20 +3
Sclosed +12 +7
Daily Volume of Open Incidents (min / avg / max)
1 / 4 / 6 3 / 7 / 12 Period to return to Steady state
(BD)
3 3
Volume of Open Incidents in Steady State 2 4 Difference -2 +0 Sopen -1 +3 Sclosed -5 +7 Open-Unresolved Incidents 2 13 Open-Resolved Incidents 13 7 Running Incidents 8 5 Daily Volume of Resolved
Incidents (min / avg / max)
5 / 6 / 7 3 / 6 / 9 Period to return to Steady state
(BD)
2 3
Volume of Resolved Incidents in Steady State
6 4
Difference -6 +3
Sopen +9 +3
Average Handle Time to Resolve Incidents
7.6 20.6
Period to return to Steady state (BD)
3 2
Average Handle Time in Steady State
4.4 16.97
Difference -0.38 -0.6
Sopen -1 +6
Sclosed -5 +14
Average Activity Count 9 5 Period to return to Steady state
(BD)
2 3
Average Activity Count in
Steady State 8 4
Difference +0 -3
Sopen +9 +3
Sclosed +1 +7
Tab. 13 shows comparison of impacts of Changes with ID “C00006211” and “C00000578” for Configuration Item “SBA000439” related to Service Component
“WBS000219”
We monitored following characteristics in compared Changes: Service Desk
After Change “C00000578” in average 58 Interactions were opened daily opposite to 26 after Change “C00006211”
We noted the highest “Average Daily Volume of Open Interactions” in volume of 65 after Change “C00011776” for the same Configuration Item
On the other hand after Change “C00000578” the Impact-pattern “Daily Volume of Open Interactions” reached Steady State after 5 days and volume of this pattern decreased from 49 to 32. Change “C00000578” decreased volume of this pattern in Steady State only by 1 Interaction.
After Change “C00000578” 15 “Open-Unclosed Interactions” with value “N” in attribute “First Call Resolution” occurred, while after Change “C00006211” occurred only 2 “Open-Unclosed Interactions” with value “N” in attribute “First Call Resolution”
After Change “C00000578” occurred 185 “Open-Closed Interactions” opposing to 103 after Change “C00006211”, but “Open-Closed Interactions First Call Resolution ratio” was 94% opposing 87%
After Change “C00000578” Impact-pattern “Average Daily Volume of Closed Interactions” had volume of 56 opposing 29 after Change “C00006211”
IT Operations
“Daily Volume of Open Incidents” was again higher after Change “C00000578”. Volume of pattern in Steady State did not change, but after Change “C00006211” volume decreased by 2 Incidents
“Average Handle Time to Resolve Incidents” is after Change “C00000578” higher again – 20.6 hours opposing 7.6 hours after Change “C00006211”
We noted highest value of this pattern after Change “C00005096”. After this Change only one Incident (ID “IM0011576”) occurred, in which attribute “Handle Time” was 77.9 hours (additional information: Category - “request for information”, Closure Code – “User error”)
Interesting is lower value of Impact-pattern “Average Activity Count” after Change “C00000578”, which is 5 opposing 9; but after Change “C00000578” Impact-pattern “Average Handle Time to Resolve Incidents” had almost three-times higher value then after Change “C00006211”
We can determine that it would be appropriate to review activities which were needed to be undertaken in order to resolve service disruption for uncovering the cause of this difference. Highest handle time after Change “C00000578” was in Incident with ID “IM0021934” – 46,5 hours (additional information: Category - request for information, Closure Code - software) and second highest handle time after Change “C00000578” was in Incident with ID “IM0021958” - 32,9 hours information (additional information: Category - request for information, Closure Code - software)
After Change “C00000578”, 90% of Incidents and 75 % of Interactions had value “request for information” in attribute “Category“ and after Change “C00006211” it was 80% of Incidents and 88,5% of Interactions
In this analysis we presented one of many examples of how we can use recorded dataset to support Business Change Management. Analysis can be applied on various Configuration Items and Service Components. We can add process-mining techniques to uncover causes of unusual behavior in identified Incidents which we noticed throughout this analysis.
6 Conclusion
To conclude this research we present overview of results, which were based on three case files of Interaction, Incident, Change management and one event log of Incident activities. These case files and event log were provided by Rabobank Group ICT for the BPI Challenge 2014. We answered questions listed in this challenge and we seek to add extensional information to each of these questions to cover the problem in whole.
Results out of the identification of Impact-patterns contain information that there are 14 332 unique Configuration Items and 338 unique Service Components. Amount of Configuration Items, which occurred only in Interaction records is 1 551 (10.9%), only in Incident records is 473 (3.3%) and only in Change records is 9 614 (67%). However, for purpose of this research, amount of Configuration Items which occurred only in Interaction and Change records - 87 (0.6%), only in Incident and Change records - 32 (0.2%) and which occurred in all provided files - 570 (4%) was essential. Out of monitored Service Components to which Configuration Items are related, 7 (2%) occurred only in Interaction records, 2 (0.6%) occurred only in Incident records and 46 (13.6%) occurred only in Change records. Out of all monitored Service Components, this research focused mainly on 11 (3.3%) Service Components which occurred only in Interaction and Change records, 1 (0.3%) which occurred only in Incident and Change records and on 228 (67.5%), which occurred in all provided files. We chose attributes through which we were able to identify relations between Interactions, Incidents, Changes and their characteristics. We created dataset for every Configuration Item and Service Component, which contained recorded Interactions, Incidents and Changes related to them. We identified Impact-patters which represent correlations between the implementation of a Change and the workload at the Service Desk and IT Operations. Impact-patterns accumulated values calculated after each Change implementation for every Configuration Item and Service Component. Consequently we used values accumulated in Impact-patterns for predicting workload at Service Desk and IT Operations after future Change implementation. We validated predicted values with values recorded before and described achieved results. We also described one of the means of use of Predictive Model on chosen Configuration Item “WBA0000133” for Change Models “Release Type 13-Major Business Change” and “Standard Change Type 06-Business Change”.
Results for affirming the expectations on delivering same or better service level after each Change implementation contain evaluation for 231 Service Components and for 549 Configuration Items. We can affirm that 59.4 % of Service Components and 37.6 % of Configuration Items deliver better service level.
Finally we presented analysis “Insight into Impact of Implemented Changes”, which purpose is to help Change implementation teams to continuously improve their Standard Operation Procedures. We presented also an example of this analysis on implemented Changes “C00006211” and “C00000578”. With help of this analysis it is possible to locate Change which caused biggest impact. Moreover it is also possible to reveal Incidents with high number of steps or long time needed to resolve service
disruption, which occurred after implemented Change. Consequently we can monitor characteristics of revealed Incidents by process mining techniques and eliminate identified problems.
To accomplish the aim of Predictive Model it is necessary to regularly update actual data, so that the Model can be adapted to the actual condition of the system, which changes over time.
We hope that created Predictive Model will help Rabobank Group ICT in prediction of impact to the workload at Service Desk and IT Operations after future implementation of Changes.