Estimating the School Level Effects of Choice on Academic Achievement in Connecticut’s Magnet, Technical and Charter Schools
Craig L. Esposito, Ph.D. Candidate, Educational Policy and Leadership
Casey D. Cobb, Associate Professor of Education Policy, Director, Center for Education Policy Analysis
Abstract
Dissatisfaction with schools and student performance has led to the call for different schools and school choice. But do different types of schools produce different outcomes? School choice programs in Connecticut are intended to provide opportunities for curricular diversity, educational innovation, and to “reduce, eliminate, or prevent…racial, ethnic or
economic isolation…while offering educational improvement” (Connecticut State Department of Education, 2006). Using the state’s extensive school profile databases and logistic regression, propensity scores were created and used to match choice schools--magnet, technical and charter--with non-choice schools to estimate school level effects of choice schools on academic
achievement. In general, performance was not significantly different between the matched choice and non-choice schools.
Estimating the School Level Effects of Choice on Academic Achievement in Connecticut’s Magnet, Technical and Charter Schools
With increasing demands for accountability and performance, many states have experimented with specialty schools of choice to accomplish numerous goals, including
improving academic achievement and reducing the achievement gap. Considerable resources are directed to these choice efforts, but are these investments producing valuable returns?
Connecticut spends over $125 million per year for choice programs, the majority on magnet schools, primarily in response to a State Supreme Court ruling which required the State to reduce de facto segregation in Hartford and the surrounding towns ("Sheff v. O'Neill", 1996). In order for judges, legislators, educators, and citizens to make informed judgments about the success of these programs, it is necessary to assess their effects on educational outcomes.
Connecticut has numerous school choice options among its public schools: 14 charter schools, 80 magnet schools, 19 vocational/agricultural centers, and 17 technical high schools as well as programs for inter-district exchanges and home schooling. While magnet and charter schools are seeing the most recent growth, vocational and technical schools preceded the current accountability movement. Most magnet and charter school programs are located in
economically-depressed urban areas, where academic achievement is relatively lower.
Overall, out of the state’s 560,000 students, 50,000 are involved in choice programs. The stated purposes of Connecticut’s choice programs include improving academic achievement; providing for educational innovation and a choice of public education programs for students and parents; and reducing racial, ethnic and economic isolation. Taking the school as the unit of analysis and using school-level observational data from the Connecticut State Department of
Education Strategic School Profile database , we examined magnet schools, technical high schools, and charter schools to determine whether these choice schools had a measurable effect on performance when matched to traditional public schools serving similar students in
comparable settings.
This study may help cast light on the question: All else being equal, do school choice options, particularly specialty schools of choice, offer enhanced learning environments over and above traditional public schools? Is there a “choice effect” for these magnet, technical, and charter schools on student achievement? Is there an effect for any one of these choice programs in particular? This analysis compared recent results on statewide proficiency exams--the
Connecticut Mastery Test (CMT) and the Connecticut Academic Performance Test (CAPT)--between the choice and non-choice schools that matched on propensity scores.
Background
School choice, in the forms of magnet schools and charter schools, has been long and frequently championed as a way to improve performance and efficiency in schools. The research on this issue is mixed, with some studies claiming improved achievement for charters (Witte, Weimer, Shober, & Schlomer, 2007) and magnets (Betts, Rice, Zau, Tang, & Koedel, 2006; Dickson, Pinchback, & Kennedy, 2000; Gamoran, 1996), and others not (Adcock & Phillips, 2000; Bifulco & Ladd, 2007; Braun, Jenkins, & Grigg, 2006; Gamoran, 1996).
In terms of educational effectiveness, evidence about the performance of magnet schools remains mixed. Blank (1990) found that 80% of magnet schools in his sample had mean reading and math scores that were above their district averages. In contrast, Dentler (1990) reported that 26 of 45 magnets met or exceeded the mean reading scores for their districts, but only 14 of these exceeded the district average by more than ten points. In fact, six of the magnets performed at
levels below the district average. Similar findings were reported for math achievement scores. In another study, magnet schools exhibited more convincing results on other student outcomes, such as higher attendance rates and lower dropout rates (Mitchell, Russell, & Benson, 1989).
Crain, Heebner, and Si (1992) studied ninth graders who applied to New York City's career-oriented magnet schools by comparing those students lotteried into the magnet to those who were not, and consequently, enrolled in comprehensive high schools instead. Non-magnet students were more likely to dropout in the transition to high school and showed less
improvement in reading than did magnet students. However, the reading differences held for only average readers. The low-ability magnet students were no better off than their
comprehensive high school counterparts. Larson and Allen (1988) tracked the progress of magnet and non-magnet students who were carefully paired according to previous achievement levels and apparent potential. Researchers found magnet students attained more and did so at an increasing rate relative to their time in the magnets.
Blank (1989) reported that several magnet schools boosted academic achievement, as measured by standardized achievement tests (Blank & Archbald, 1992). In a longitudinal analysis of students who transferred in to a new elementary magnet school that emphasized foreign languages, economics, politics, history, ecology, and technology, Thacker (1997) found that students performed significantly better on a test of basic skills after their transfer. More impressive, the magnet school performed well in an already high performing district. For instance, in grades 2-4 average district scores were all above the 72nd percentile in reading, language and mathematics, yet the magnets performed in the 80th or 90th percentiles across in all grades and subjects (except for grade 5 reading where the magnet average was at the 77th
In a national study that investigated magnet schools' distinctiveness, Blank & Archbald (1992) concluded that one-third of the magnet schools in the study could be considered of better quality. The study found that a fifth of the schools showed no signs of uniqueness.
In another national study comparing the achievement performance of students from magnet, comprehensive public, private, and secular schools, Gamoran (1996) observed large raw score differences among the four types of high schools. The students from private schools (Catholic and secular) outperformed students in the public schools. However, these differences all but disappeared after adjusting for students' prior achievement, sex, ethnicity, and family structure. That is, there appeared to be little "value-added" from attending a private institution. In comparing public magnet scores to traditional public schools, Gamoran concluded that "the achievement benefits of magnets were substantial" (p. 45). While this study found magnet schools to have a positive effect on average academic achievement, it could not distinguish between the several types of magnets or pinpoint why performance was improved.
In her review of studies on magnets, Raywid (1994) identified only two
methodologically sound studies that involved significant numbers of schools and students, and that effectively controlled for the self-selection bias that so often plagues studies of programs of choice. One of the studies found that magnet students outscored non-magnet students on (all) twelve indicators of academic success, behavior, and attendance (Musumeci & Szczypkowski, 1991 from Raywid, 1994).
Methods
Although randomized models are considered among the better designs to infer causal effects, random assignment is seldom feasible in educational research settings, especially in the context of choice: random assignment would negate the very concept of “choice.” However, by
using data from large-scale observational datasets and carefully matching the treatment and non-treatment units, it is possible to approximate randomized controlled experiments and justify causal inferences (Rubin, 1997; Schneider, Carnoy, Kilpatrick, Schmidt, & Shavelson, 2007; Stuart, 2007). Using similar or identical propensity scores to match control and treatment units allows comparisons of units with similar distributions of covariates. Propensity scoring is most effective when analyzing large sets of covariates (Rosenbaum & Rubin, 1983), as is often possible when using observational datasets.
Data Sources
The data on school and student characteristics and outcomes for academic year 2005-06 were retrieved from Connecticut’s Strategic Schools Profiles,
http://www.csde.state.ct.us/public/DER/datacentral/MultipleSearch.asp, which contain data for all Connecticut public schools. Some of the financial characteristics of schools incorporated in the propensity score came from http://www.csde.state.ct.us/public/dgm/reports/selectelesec.asp and http://www.sde.ct.gov/sde/lib/sde/excel/dgm/report1/basiccon.xls. CMT tests are
administered in grades 3 through 8, in mathematics, reading and writing, while the CAPT is administered to grade 10, in mathematics, reading, writing, and science. These data can be found at http://www.ctreports.com/. In this report, analyses were conducted for mathematics scores only.
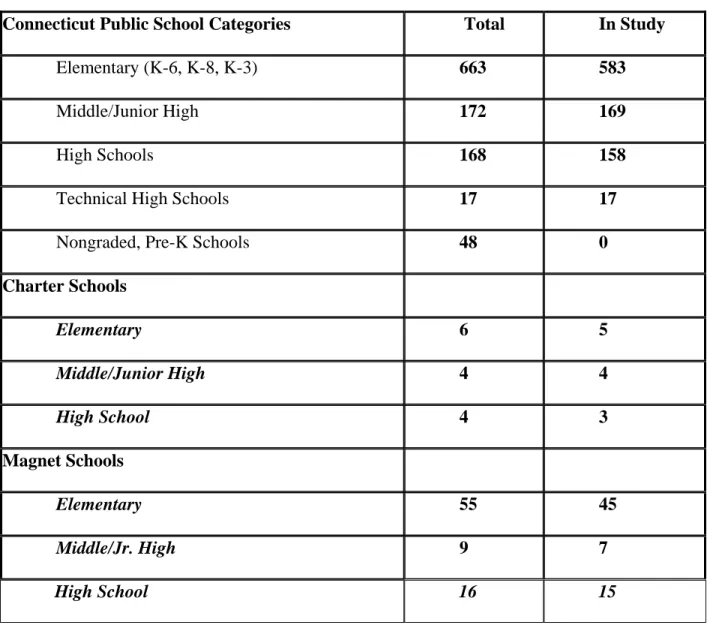
The representation of Connecticut public schools in this study can be seen Table 1 below. The primary schools excluded were the Kindergarten through 3 schools. It should be noted that the State-defined grade level categories are heterogeneous. The schools in a category,
Kindergarten through 8, for example, are quite varied in their grade ranges, and do not conform closely to their range designations. This was true across all of the grade range categories.
Table 1. <Connecticut Public Schools>
Connecticut Public School Categories Total In Study
Elementary (K-6, K-8, K-3) 663 583
Middle/Junior High 172 169
High Schools 168 158
Technical High Schools 17 17
Nongraded, Pre-K Schools 48 0
Charter Schools Elementary 6 5 Middle/Junior High 4 4 High School 4 3 Magnet Schools Elementary 55 45 Middle/Jr. High 9 7 High School 16 15
Design and Data Analysis
In this causal-comparative study, choice schools were considered to provide a “choice” treatment. Non-choice schools and their “standard practice” were considered the control
situation. The outcome of interest was performance on the statewide Connecticut Mastery Test (CMT) or the Connecticut Academic Performance Test (CAPT). A panel of over 20 covariates in five major categories- school demographics, performance, program characteristics, staffing, student characteristics-was created to capture the school, student, and teacher characteristics of
choice and non-choice schools. Items included school size, grade range, school age, attendance percentages, special education percentages, instructional hours/year, teacher qualifications, net current expenditures per pupil, percentage eligible for free and reduced price lunch, percentage English as a second language, ethnic percentages, staffing ratios, and the like.
These covariates were used to create propensity scores through logistic regression for each of the categories of choice schools (i.e., magnet, charter, or technical.). This propensity score is a single number between 0 and 1 that gives the likelihood of a certain school being in a particular category of choice school for the constellation of selected covariates. Propensity scores were also generated for all non-choice schools, and then each choice school was matched with the choice school with the closest propensity score in the same grade range. The non-choice schools came from the entire universe of public schools, and matching with replacement was employed where control units could match with more than one treatment unit. A post-test comparison of the difference in post-treatment CMT and CAPT test score means between choice and non-choice school was conducted. The average score for achievement for each treatment group was compared to the average achievement score for its respective control group, using an analysis of variance (ANOVA) and follow-up pair wise comparisons.
Preliminary Findings
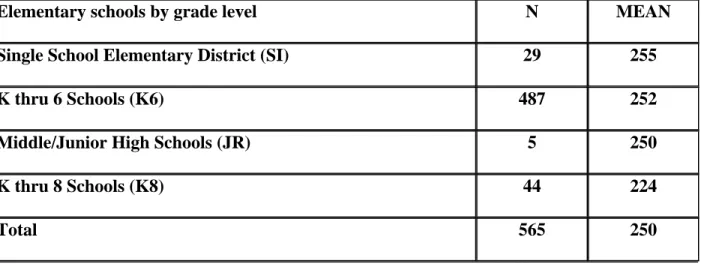
Table 2 shows grade 4 math scores for elementary and middle schools. In a pattern that was repeated for the Grade 6 and Grade 8 scores, there was no significant difference between the different school types in their average math scores, with the exception of K-8 elementary
schools, which consistently and significantly scored lower than the other categories. This is because school organization follows residential patterns, and K-8 schools tend to be located in low scoring, poor urban districts. At the elementary level there is no significant difference in
CMT Mathematics test scores for Grades 4, 6, and 8 between any pair wise comparison of
traditional, magnet and charter schools, except that Grade 4 Magnets do score significantly lower than traditional schools. We would expect traditional schools to outscore magnet schools
because wealthy high scoring schools are typically traditional formats, and magnet schools in general draw from poorer lower performing student populations.
Table 2. < Grade 4 CMT Math Scores by Elementary Grade Configuration>
Elementary schools by grade level N MEAN
Single School Elementary District (SI) 29 255
K thru 6 Schools (K6) 487 252
Middle/Junior High Schools (JR) 5 250
K thru 8 Schools (K8) 44 224
Total 565 250
K8- significantly different, p<.001. Held true for Grade 6 & Grade 8 math scores as well
Initial attempts to generate propensity scores produced primarily 0s and 1s, with very few scores in between. Since a score of “1” indicates a perfect prediction of the traditional non-choice school category; a score of 0 indicates perfect prediction of the particular non-choice category, this meant there was no overlap of propensity scores ranges. Without overlapping scores, it was impossible to match and pair propensity scores for unique pairs of treatment and controls. Consequently, a simpler logistic regression model was employed, using only four covariates: the percentages of free and reduced-price lunch eligible African American, Hispanic and Asian American students at the elementary level. This generated overlapping and useable propensity scores. This ensured that we were comparing schools with similar student socioeconomic and
ethnic distributions and any differences in test scores could be attributed to either school effects or some unmeasured student variable such as motivation, ability, intelligence, or parent
involvement.
After propensity score matching, magnet school scores were consistently higher than their matched non-choice counterparts, but the differences were not statistically significant at the p <.05 (see Table 3).
Table 3. Math Scores, Traditional vs. Magnet Schools, matched on Propensity scores N MEAN Test Score Sig. 41 241
F
(1,81)=2.001
0.161 Grade 4 Magnets vs. Grade 4 Traditional 41 234 23 236F
(1,44)=0.978
0.328 Grade 6 Magnets vs. Grade 6 Traditional 22 229 21 238F
(1,34)=1.410
0.244 Grade 8 Magnets vs. Grade 8 Traditional 14 229Similar results were found when comparing charters to their non-choice traditional counterparts, as seen in the chart below, although charters did not exhibit the consistently higher scores observed with magnets.
Table 4. Math Scores, Traditional vs. Charter Schools, matched on Propensity scores
N Mean Test Score Sig.
4 236
F
(1,7)=0.673
0.443 Grade 4 Charters vs. Grade 4 Traditional 4 226 7 231F
(1,11)=0.193
0.671 Grade 6 Charters vs. Grade 6 Traditional 5 240 4 236F
(1,7)=0.369
0.566 Grade 8 Charters vs. Grade 8 Traditional 4 246This analysis suggests that there is no significant “choice” effect of magnet schools on performance at the elementary school level in Connecticut when controlling for the array of observable covariates used in this analysis. The small sample size for charters does limit the ability to draw any inferences, however, about school effects on achievement.
A generally similar pattern emerged when examining schools at the high school level. When matched to traditional schools, charter and technical schools did not perform significantly differently. However, high school magnet schools did achieve significantly higher scores than similar traditional schools. We calculated an effect size (Treatment mean-Control mean/SD) of 234.44-219.33/18.976 = .796.
Table 5. Math Scores, Traditional vs. Choice Schools, matched on Propensity scores
N Mean Test Scores Sig.
15 234
F
(1,26)=4.871
0.037 Magnets vs. Traditional 12 219 16 238F
(1,31)=0.025
0.877 Vo Tech vs. Traditional 16 237 3 197F
(1,5)=0.476
0.528 Charters vs. Traditional 3 205This finding leaves unanswered what the cause might be: the smaller size of magnets, better students, curricular differences, better teachers, different governance, or some combination of these factors. Small sample size is an even greater issue at the high school level because of the overall reduction in school numbers. The generation of propensity scores using a limited set of covariates weakens the strength of the inferences we might wish to make as well. Having student level data and using that to generate propensity scores for matching would be a stronger design.
The use of observational data and propensity score matching provides a useful technique to infer causal relationships, and in this case, program effects. The national trend for increasing accountability and performance is driving states to increase the amount of data collected on students, schools and districts. This increased information gathering provides researchers with the opportunity to construct quasi-experimental designs that can assess, relatively inexpensively, possible treatments and interventions.
As educators, policymakers, researchers, and communities continue to search for ways to improve educational outcomes, it is helpful to have a sense of “what works.” While we would not conclude from this study that school format and structure does not matter, it is clear that after matching school characteristics, the type of school and its effect on standardized test
performance does not seem to matter as much as one might expect. At least in the state of Connecticut, the primary means of school choice--magnet schools, charter schools and technical high schools--do not appear to provide a significant improvement in achievement over the traditional public school format. This study presents a foray into using causal-comparative techniques to infer school effects from large databases, a technique that can be used on other data bases.
References
Adcock, E. P., & Phillips, G. W. (2000). Accountability Evaluation of Magnet School Programs: A Value-Added Model Approach. Paper presented at the Annual meeting of the
American Educational Research Association|. Retrieved 7/15/2007 from
www.eric.ed.gov/ERICDocs/data/ericdocs2sql/content_storage_01/0000019b/80/16/3e/1f .pdf.
Betts, J. R., Rice, L. A., Zau, A. C., Tang, Y. E., & Koedel, C. R. (2006). Does School Choice Work? Effects on Student Integration and Achievement. San Francisco, CA: Public Policy Institute of California.
Bifulco, R., & Ladd, H. F. (2007). School Choice, Racial Segregation, and Test-Score Gaps: Evidence from North Carolina's Charter School Program. Journal of Policy Analysis and Management, 26(1), 31-56.
Blank, R.K. (1983). Survey of magnet schools. Analyzing a model for quality integrated education. Executive summary. Final report of a national study. Washington, DC: Abt. Associates, Inc., Cambridge, MA. ERIC Document Reproduction Service No. ED 236 304.
Blank, R.K. (1990). Analyzing educational effects of magnet schools using local district data. Sociological Practice Review, 1(1), 40-51.
Blank, R.K., & Archbald, D.A. (1992). Magnet schools and issues of education quality. Clearing House, Nov-Dec, 66(2), 81-86.
Braun, H., Jenkins, F., & Grigg, W. (2006). A Closer Look at Charter Schools Using
Hierarchical Linear Modeling. Washington, DC: National Center for Education Statistics. Connecticut State Department of Education. (2006). Public School Choice in Connecticut: A
Guide for Students and Their Families: Connecticut State Department of Education. Crain, R.L., Heebner, A.L., & Si, Y. (1992). The effectiveness of New York City's career
magnet schools: an evaluation of ninth grade performance using an experimental design. Berkeley, CA: University of California, National Center for Research in Vocational Education.
Dentler, R.A. (1990). Conclusions from a national study. In Estes, N., Levine, D.U., & Waldrip, D.R. (Eds.), Magnet schools: recent developments and perspectives. Austin: Morgan Printing and Publishing.
Dickson, B. L., Pinchback, C. L., & Kennedy, R. L. (2000). Academic Achievement and Magnet Schools. Research in the Schools, 7(1), 11-17.
Gamoran, A. (1996). Student Achievement in Public Magnet, Public Comprehensive, and Private City High Schools. Educational Evaluation and Policy Analysis, 18 (1), 1-18.
Mitchell, V., Russell, E.S., & Benson, C.S. (1989). Exemplary urban career-oriented secondary school programs. Berkeley: National Center for Research in Vocational Education. Raywid, M.A. (1994). Focus schools: a genre to consider. ERIC Clearinghouse on Urban
Education, New York, NY. ERIC Document Reproduction Service No. ED 377 293. Rosenbaum, P. R., & Rubin, D. R. (1983). The Central Role of the Propensity Score in
Rubin, D. R. (1997). Estimating Causal Effects from Large Data Sets Using Propensity Scores. Annals of Internal Medicine, 127(8), 757-763.
Schneider, B., Carnoy, M., Kilpatrick, J., Schmidt, W. H., & Shavelson, R. J. (2007). Estimating Causal Effects Using Experimental and Observational Designs (report from the
Governing Board of the American Educational Research Association Grants Program). Washington, DC: American Educational Research Association.
Sheff v. O'Neill, 238, Conn. 1, 678 A. 2d. 1267 (Connecticut Supreme Court 1996).
Stuart, E. A. (2007). Estimating Causal Effects Using School-Level Data Sets. Educational Researcher, 36(4), 187-198.
Thacker, J.L. (1997). Establishment of a new magnet school: effects on student achievement. ERS Spectrum, Winter, 15(1), 43-47.
Witte, J., Weimer, D., Shober, A., & Schlomer, P. (2007). The Performance of Charter Schools in Wisconsin. Journal of Policy Analysis and Management, 26(3), 557-578.