Theory and Methodology
Towards ``zero abandonments'' in call center performance
John C. Duder
a, Moshe B. Rosenwein
b,* aInternal Revenue Service, Atlanta, GA, USAbMerck-Medco Managed Care, L.L.C., 100 Parsons Pond Road, Franklin Lakes, NJ 07417, USA Received 29 June 1999; accepted 11 August 2000
Abstract
The call center industry is a big business in today's global economy. Stang costs account for over half of a call center's total operations costs. Some large call centers, in practice, operate at very close to maximum capacity, believing that such an operations policy is ecient. However, by operating at levels close to 100% utilization, a call center is ``living dangerously''. If, for example, call volumes even slightly exceed forecasts, customer calls will queue. As queue lengths and durations increase, customers will tend to abandon their calls. We provide some ``rule-of-thumb'' formulas that evaluate the cost of abandonments. These formulas may be used to justify an investment in additional agents required to improve the quality of service and reduce abandonments. Standard Erlang-C queueing formulas imply that abandonments can be signi®cantly reduced with a small investment in additional agents. Thus, by improving customer service and hiring additional sta, a call center can improve pro®tability. We illustrate our analysis with realistic data, based on our work with large-scale customer service centers. Ó 2001 Elsevier Science B.V. All rights reserved.
Keywords:Manpower planning; Call center planning; Marketing
1. Introduction
The application of operations research model-ing to the call center industry is receivmodel-ing signi®-cant attention recently, see, for example, Mehrotra (1997). Many ®rms seek to dierentiate themselves from their respective competition by providing superior customer service. We focus on a large-scale call center operation that provides a service
function in a corporation. Such a call center, typ-ically, handles customer calls regarding, for ex-ample, billing inquiries or information about new products and services. A small percentage of calls result in actual sales.
The cost of providing trained agents on-line to answer customer inquiries accounts for over 50% of total operations costs. Many ®rms have used queueing models to eciently sta their call cen-ters. Applications of such models are described for the following industries: airlines ± Gaballa and Pearce (1979), telecommunications ± Sze (1984), the IRS ± Harris et al. (1987), laboratories ± Callahan and Khan (1993), hospitals ± Agnihothri
*Corresponding author. Tel.: +1-201-269-2019.
E-mail address: [email protected] (M.B. Ro-senwein).
0377-2217/01/$ - see front matterÓ 2001 Elsevier Science B.V. All rights reserved. PII: S 0 3 7 7 - 2 2 1 7 ( 0 0 ) 0 0 2 8 9 - 7
and Taylor (1991), and retail mail-order ± An-drews and Parsons (1993) and Quinn et al. (1991). A call center may be tempted to operate at a very high level of utilization (e.g., over 98%), given its large investment in its workforce. In practice, a call center is ``living dangerously'' if it drives to-wards 100% utilization (i.e., operating at maxi-mum available capacity). For example, if actual call volume even slightly exceeds the forecast, large queues and unanswered calls are likely to arise. Large queues have the eect of increasing a cus-tomer's average delay in reaching an agent which, in turn, cause customers to abandon their call prior to reaching an agent. For a call center that handles service inquiries, an abandonment may not be viewed as severely as it may be viewed by a call center that serves as a sales channel (where a customer abandonment implies lost revenue). We provide some ``back-of-the-envelope'' formulas that may be used to evaluate a ``zero abandon-ments'' policy. Abandonments add inbound tele-communications and information systems costs. For certain operations environments, we demon-strate that reducing abandonments and the aver-age delay of a call by hiring sta may be economically advantageous. An operations policy of ``zero abandonments'' may, thus, prove to be sound ®nancially as well as bene®ting the customer and employee bases.
The authors developed the modeling approach, described below, while supporting customer ser-vice call centers at a large US provider of tele-communication services. This operation handled 70 million calls annually and had an operating budget of approximately $500 million. The au-thors used the model to persuade management to abandon its plan to increase its performance tar-gets for ASA (i.e., decrease customer service) in the hopes of achieving signi®cant cost savings. The modeling approach was intuitive, thus facilitating the authors' ability to in¯uence strategy and ``sell'' the model's results to management. Similar ®nd-ings were also reported at L.L. Bean (Andrews, 1997).
In Section 2, we provide an overview of a call center's operations, focusing on call handling and performance metrics. Section 3 analyzes the cost to a call center of hiring additional agents versus the
bene®t achieved by improving level of service. Section 4 illustrates the analysis with realistic data. 2. Call center operations analysis
A call is processed as follows. A customer dials, typically, a toll-free telephone number to contact a call center, i.e., the call center is charged with all inbound telecommunication expenses. An inter-active voice recognition (IVR) system prompts a customer with a series of announcements and in-teractive menus. An IVRtree is designed with the purpose of identifying characteristics of the in-coming customer call (e.g., reason for calling, billing history, etc.). The IVRsystem interacts with various information systems that provide a pro®le of the incoming customer. An IVRexperience may have a duration of several minutes, and the re-sulting inbound telecommunication charges are absorbed by the call center. In some cases, a cus-tomer inquiry may be handled by the IVRsystem and, thereby, not necessitate the intervention of a (more costly) human agent. A customer may elect to exit the IVRsystem at certain points in the ``dialogue'' and speak directly with an agent. If one or more agents are idle, then a customer call is routed to the agent that has been idle for the longest duration. Otherwise, if all agents are busy, a customer call is routed to the queue with the shortest expected wait time.
After choosing to speak directly with an agent, a customer (call) enters a queue if no agent is im-mediately available. A call center measures its performance by one of the following metrics: (1) average speed of answer (ASA), i.e., the average delay in queue experienced by a customer waiting for an agent, (2) percent of calls answered within
X, say, 30 seconds (after requesting to speak to an
agent), and (3) percent abandonment, i.e., the fraction of customers that terminate their call after departing the IVRsystem but prior to reaching an agent. Andrews and Parsons (1993) developed a linear regression model that showed a strong cor-relation between ASA and percent abandonment
(R-squared value>0.9). Using data from a major
telecommunications provider, we found that the
was exponential. That is, the majority of custom-ers are serviced almost instantaneously (e.g., within 10 seconds) and yet some suer extensive delays (e.g., greater than a minute).
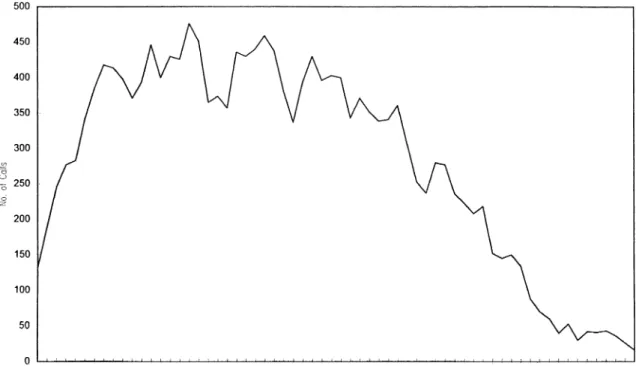
In order to analyze call center operations, we focus on a typical quarter hour during a day. As shown in Fig. 1, a call center's peak period may extend for a long duration. For each quarter hour, a call center forecasts its call volume and average talk time (ATT). Given a stang level for a par-ticular quarter hour and actual call volume and actual ATT, a call center can measure the
utiliza-tion oroccupancyof a pool of agents by
occupancy
number of calls answered ATT=
15 minutes number of agents on-duty:
For large teams of agents (e.g., number of
agents>150), maintaining occupancies of less than
98% will, typically, result in very short ASAs (e.g., less than 10 seconds). As ASA decreases, the
per-centage of customers experiencing long delays also decreases. However, some individual customers will experience long delays even under an opera-tions policy that maintains short ASAs. (We do not consider the relationship between ASA and
percent of calls answered inXseconds.) As
occu-pancies approach 100%, ASAs, and, hence, aban-donments increase dramatically.
Operating a call center at close to 100% occu-pancy places a heavy (unrealistic) reliance on generating almost exact forecasts of incoming trac. If, for example, actual call volume exceeds the forecast for a particular quarter hour even slightly (e.g., by 5%), a call center will be unable to handle the over¯ow of calls. In addition, operating agents at close to 100% occupancy places great stress on the workforce. Increases in absences (due to illness) and attrition are likely to arise, in practice, for a workforce that works at very high occupancies for an extended period of time.
In order to approximate the number of agents required to attain dierent values of ASA, given
expected call volumes and ATT for a particular
quarter hour, a standardM/M/cqueueing model is
used in commercial call center stang systems, e.g., see Potter (1997). That is, the arrivals of in-bound calls are assumed to be Poisson, agent
ser-vice times are assumed to be exponential, and c
agents are assumed to be available. Further, the model assumes no blocking of calls into the system (i.e., there are an in®nite number of ``slots'' in which a call may reside while in queue) and no reneging by customers. The last assumption is potentially dicult in a call center environment in which abandonments are strongly prevalent. (We, therefore, refer to our approach as a ``rule-of-thumb'' approach. We do not attempt to measure the impact of retrials (i.e., calls generated by cus-tomers who abandon an initial call and call back ``shortly'' thereafter), caused by abandonments, on the call arrival distribution. In general, the Poisson assumptions are violated since retrials imply the presence of dependent demand.)
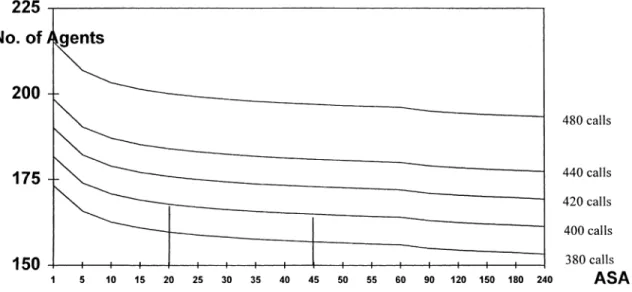
Fig. 2 provides a sensitivity analysis of number of agents required for dierent call volumes and dierent ASAs. For a base case of 400 calls per quarter hour and an ATT of 6 minutes, an addi-tional three agents can reduce ASA from 45 to 20 seconds. However, reductions of ASA for values less than 10 seconds are costly (in terms of
addi-tional agents). The sensitivity analysis highlights the importance of accurate quarter hour forecasts. For example, if actual call volume exceeds the forecast by 10%, a call center will need to imme-diately add 16 agents in order to maintain a 45-seconds ASA.
Discrepancies between actual and forecast call volume will inevitably arise. A call center must develop a plan to manage real-time imbalances between demand and supply of agents. For ex-ample, a call center may employ a team of ``¯exi-ble'' agents (i.e., these agents serve as a buer stock). These agents can be ``released'' to handle inbound calls should actual volumes exceed fore-casts. Otherwise, if forecasts exceed actual call volumes, the ¯exible agents may be assigned other work in the call center, e.g., responding to inqui-ries that could not be handled in real-time by an agent and were deferred for later action.
Fig. 2 also illustrates the diculty of operating at an ASA greater than 5±10 seconds. If a call center desires to operate at an ASA of, say, 20 seconds, it must be aware that a slight deviation in agents' adherence to the schedule (e.g., reporting for duty exactly on-time) can result in a major drop-o in performance. Customers quickly ex-perience longer delays, for a removal of a few agents can cause congested queues. As ASAs and
queue lengths increase, the rate of (costly) cus-tomer abandonments also increases. Thus, a call center should establish a performance target of a very short ASA (e.g., less than 10 seconds) for each quarter hour of every day. A short ASA will also imply a low rate of customer abandonments. 3. Labor costs versus quality of service
We provide a ``rule-of-thumb'' analysis that may be used by a call center to determine if, eco-nomic arguments can also support a strategy of ``zero abandonments''.
Consider a call center that is deciding whether to hire additional agents in order to reduce its ASA. Its key assumptions are:
· no blocking of calls;
· a low-to-moderate rate of abandonment;
· a large team of agents;
· forecasts of call volume and ATT by quarter
hour are given.
The following notation is needed. The analysis considers a particular quarter hour for a call cen-ter:
b cost per agent per 1/4 hour.
Wdesired change in ASA.
m number of agents required to change ASA
byW.
A change in abandonment rate resulting from
a change ofWin ASA.
Vactual call volume (calls answered plus calls
abandoned) per 1/4 hour.
haverage duration of an IVRexperience.
qinbound telecommunications cost per
min-ute.
dinformation systems cost per
IVRexperi-ence.
pprobability of a customer retrial given a
cus-tomer abandonment.
rprobability of a customer switching to a
competitor brand given inferior customer ser-vice.
Naverage revenue per customer.
Using the standard Erlang-C formulas that are
appropriate for anM=M=c queue, see Gross and
Harris (1985), a call center may determine its stang level for a particular quarter hour given
the expected call volume and ATT for that quarter hour and given a speci®ed ASA. By computing the number of agents required for both its baseline and proposed ASAs, a call center may, thus,
de-terminemas a function ofW.
The cost of adding m agents for a particular
quarter hour is bm. By reducing the average
du-ration of each call and by reducing retrials, a call center may achieve three types of economic sav-ings: (1) a reduction in inbound telecommunica-tions costs; (2) a reduction in IVR-related charges; and (3) a reduction in erosion of a ®rm's customer base.
By reducing the average delay (duration) of
each call by W (where W is in minutes), a call
center saves qVWdollars in inbound
telecommu-nication costs.
An improvement in service level results in a decrease in abandonments and, hence, retrials. In practice, Homan and Harris (1985) found that
the probability p of a retrial given an
abandon-ment is 0.7. For a given value of ASA, we can use, for example, the regression model in Andrews and Parsons (1993) to predict the rate of
abandon-ments. In general, a change in the ASA byWwill
result in a change in the abandonment rate byA.
Thus, the number of retrials that will be saved by
reducing the ASA byWispVA.
For each saved retrial call, a call center achieves two types of savings. Since a retrial call must be processed by an IVRfrom ``scratch'', i.e., an IVR system cannot distinguish a retrial call from a
``new'' call, a retrial call accrues d dollars of
in-formation systems expense. These costs arise from an IVRsystem querying various databases in or-der to develop a customer pro®le. Further, an IVR experience adds inbound telecommunications
ex-pense. Speci®cally, if an average IVRduration ish
(say, minutes), then the inbound
telecommunica-tions cost associated with an IVRexperience isqh.
Thus, by eliminatingpVAretrials, a call center can
savepVA dqhin related IVRexpenses.
Finally, a ®rm is better positioned to retain its existing customers and acquire new customers if its call centers provide superior customer service. One of the criteria that marketing organizations use to measure call center service performance is ``time required to reach an agent''. Let us assume that a
customer that has abandoned a call has judged the ``time required to reach an agent'' to be too long and, hence, views the call center as having pro-vided inferior service. Further, assume that a
fraction r of these customers switch their brand
preference. By reducing the rate of abandonments
byA, a call center may reduce its opportunity cost
(associated with losses to its customer base) by rNAV.
Total savings achieved by improvements in the level of service is given by
S qVW pVA dqh rNAV
V qW pAdqh rNA:
Total costs associated with hiring additional agents are given by
Rbm:
IfS >R, then a ®rm can improve its pro®tability
by hiring more agents for a particular quarter hour.
4. Example
We illustrate the analysis using some represen-tative data, based on our experience with large call centers operated by a large telecommunications service provider. Assume the following costs and parameters:
b$5 per agent per 1/4 hour.
q$0.06 per minute.
d$0.04 per IVRexperience.
N$100 of revenue per customer.
h2 minutes.
p0.70.
r 0.001.
Further, assume that a particular call center seeks to reduce its ASA by 1/2 minute. Based on the regression model of Andrews and Parsons (1993), a 30 seconds reduction in ASA results in an ap-proximate reduction of 3.5% in abandonments. (The model is valid in the range of 0±2 minutes ASA.) Using the Erlang-C formulas, four addi-tional agents are required to achieve such an ASA savings for volumes in the range of, say, 400±800 calls per quarter hour and a 6 minute ATT.
For the costs and parameters given above, a call center can determine a level of call volume that would economically justify stang a particular quarter hour with an additional four agents. Since the duration of a call center's peak period can be quite lengthy, the analysis that is being illustrated, here, for a particular quarter hour, may be appli-cable to numerous quarter hours during a day. For a call center that seeks to reduce ASA by 1/2
minute, a quarter hour volume Vof 532 is
su-cient to justify additional sta, given the cost and operational parameters listed above. For a call
center that evaluatesr to be 0 (that is,
abandon-ments do not lead to customers switching brands), the break-even call volume value is 587.
5. Conclusions
We have argued that call center operations should avoid operating at levels very close to 100% occupancy. Speci®cally, such practices can lead to drastic deterioration in service (e.g., due to errors in demand forecasts), agent ``burn-out'', and in-creases in customer abandonments. We have pro-vided a ``rule-of-thumb'' analysis to evaluate the ``economics'' of a trade-o between stang costs and customer service. We have shown that, for realistic operations parameters and costs data, a call center may increase pro®tability by increasing its stang level and signi®cantly reducing cus-tomer abandonments.
Acknowledgements
We bene®ted from suggestions that were oered by Hanan Luss of AT&T.
References
Agnihothri, S.R., Taylor, P.F., 1991. Stang a centralized appointment scheduling department in Lordes Hospital. Interfaces 21 (5), 1±11.
Andrews, B., 1997. Private communication.
Andrews, B., Parsons, H., 1993. Establishing telephone-agent stang levels through economic optimization. Interfaces 23 (2), 14±20.
Callahan, B.B., Khan, M.R., 1993. Planning laboratory stang with a queueing model. European Journal of Operational Research 67, 321±331.
Gaballa, A., Pearce, W., 1979. Telephone sales manpower planning at Qantas. Interfaces 9 (3), 1±9.
Gross, D., Harris, C.M., 1985. Fundamentals of Queueing Theory, second ed. Wiley, New York.
Harris, C.M., Homan, K.L., Saunders, P.B., 1987. Modeling the IRS telephone taxpayer information system. Operations Research 35, 504±523.
Homan, K.L., Harris, C.M., 1985. Estimation of caller retrial rates for a telephone information system. European Journal of Operational Research 27, 207±214.
Mehrotra, V., 1997. Ringing up big business. OR/MS Today 24 (4), 18±24.
Potter, T.F., 1997. Computing service level and average delay in the Erlang-C model. TCS Management Group. Internal report.
Quinn, P., Andrews, B., Parsons, H., 1991. Allocating Tele-communications Resources at L.L. Bean, Inc. Interfaces 21(1), 75±91.
Sze, D.Y., 1984. A queueing model for telephone operator stang. Operations Research 32, 229±249.
![1 [(Pyridin 3 yl)(pyrrolidin 1 yl)methyl]naphthalen 2 ol](data:image/gif;base64,R0lGODlhAQABAIAAAP///wAAACH5BAEAAAAALAAAAAABAAEAAAICRAEAOw==)