DATE APPLICATION RECEIVED: June 6, 1996. Application # FY96-TV010
FACILITY DESCRIPTION
Wheelabrator-Claremont (Wheelabrator) operates a resource recovery facility in Claremont, NH. The resource recovery facility burns municipal solid waste (MSW) in two 100 tons/day mass burn units that generate steam. The steam drives a turbine generator to produce electricity for sale to the local utility. The gross generating capacity of the facility at the maximum capacity rating is nominally 6 MW.
The MSW combustors are two identical mass-fired waterwall boilers each with a maximum heat input rate of 43.1 MMBTU/hr (9583 lb/hr MSW based on a heating value of 4500 BTU/lb). Each unit is equipped with a single auxiliary propane fired burner rated at a maximum of 15 MMBTU/hr. Emissions from each boiler are currently controlled by a dry lime injection system and a fabric filter prior to exhausting to the atmosphere. The quenched bottom ash from each boiler is transformed by a drag conveyor to an ash bin. Flyash is mixed in an ash pelletizer and added to the bottom ash on the ash on the drag conveyor. The mixed ash is loaded into containers in the enclosed ash bay, and full containers are stored on site prior to transport to the ash residue monofill.
Wheelabrator will install a powdered activated carbon injection system (PACIS), an evaporative cooling system (ECS) and upgrade the fabric filters from fiberglass bags to Ryton bags. The facility is making these changes to comply with the requirements of Env-A 3300.
PROJECT DESCRIPTION
The purpose of this project is to review Wheelabrator’s Title V application. This Permit covers the following emission units:
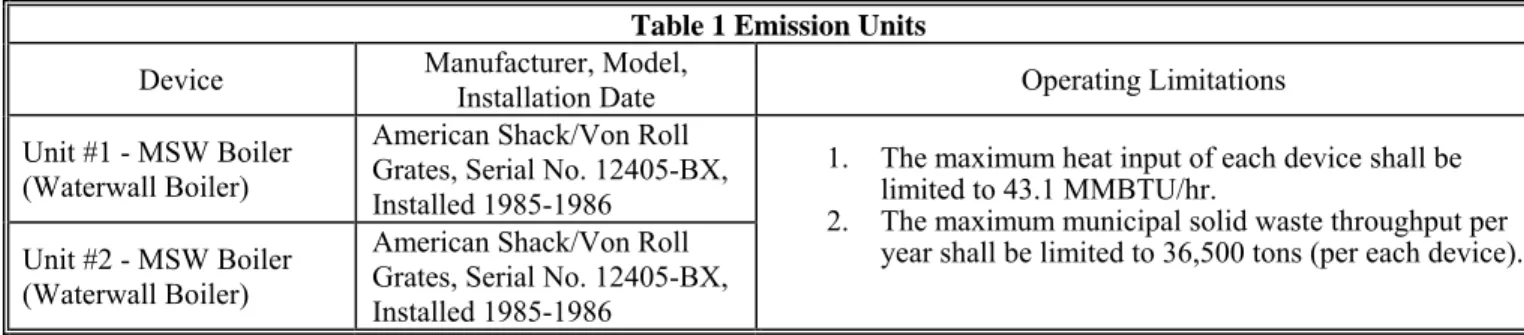
Table 1 Emission Units
Device Manufacturer, Model, Installation Date Operating Limitations Unit #1 - MSW Boiler
(Waterwall Boiler)
American Shack/Von Roll Grates, Serial No. 12405-BX, Installed 1985-1986
Unit #2 - MSW Boiler (Waterwall Boiler)
American Shack/Von Roll Grates, Serial No. 12405-BX, Installed 1985-1986
1. The maximum heat input of each device shall be limited to 43.1 MMBTU/hr.
2. The maximum municipal solid waste throughput per year shall be limited to 36,500 tons (per each device).
CONTROL DEVICE DESCRIPTION
Pollutants in the flue gases from each boiler are controlled by two identical dry lime injection scrubbers (DLIS) and two identical fabric filter baghouses (FFBH). The lime reagent is blown into the exhaust ductwork at a point between the spark trap and the fabric filter baghouses. After the treatment in the DLIS, the flue gas from each boiler is directed to its associated FFBH. Particulate matter deposited on the fabric filter bags is removed by a pulse jet air stream. The flue gas from each boiler is emitted to the atmosphere through individual flues within a dual flue, insulated stack, the top of which is 150 feet above ground level. The boilers are equipped with a single timeshared extractive Continuous Emissions Monitoring System (CEMS) for the measurement of CO emissions. Each boiler is equipped is equipped with a Continuous Opacity Monitoring System (COMS) for the measurement of opacity. The CEMS is also equipped with a diluent O2 monitor.
The new ECS1 will be installed upstream of the existing fabric filters in the area that is currently occupied by the spark arrestors. The
ECS will reduce the economizer exit flue gas temperature so that the carbon will optimally react with mercury. Finely atomized water droplets are evaporated in high-temperature exhaust gases to lower temperature and raise humidity. By lowering gas temperatures quickly, ECS reduces dioxin and furan formation.
The PACIS will primarily control mercury and also enhance the reduction in organic emissions (dioxins/furans). The powdered activated carbon (PAC) will be delivered pneumatically to the economizer outlet duct downstream of the ECS using bulk bag
feeder/eductor systems. The system will also include a control panel, blowers, feeders/eductors and piping. The PAC will be delivered in 1000 lb bulk bags. The bags will discharge to a surge hopper. The surge hopper will discharge to a volumetric screw feeder. The screw feeder will discharge to a venturi eductor. A dedicated, positive displacement blower will provide the conveying air to the throat of the venturi eductor, drawing in the activated carbon, and additional conveying air. The activated carbon will then be pneumatically conveyed using carbon steel pipe to the downstream ductwork of the ECS.
The existing dry lime injection system will remain in service. The DLIS will control emissions of SO2 and HCl. The injected lime will
absorb acid gases like SO2 and HCl. The downstream fabric filter will provide the final acid gas and particulate matter removal. The
fabric filter (for each boiler) currently utilizes fiberglass bags. The bags will be replaced with Ryton bags, which will have a longer operating life than the fiberglass bags.
As required by Env-A 3300, Wheelabrator will install CEMS to monitor SO2 emissions. Env-A 3300
Env-A 3300 is applicable to existing MWC units with a capacity to combust more than 35 tons per day of MSW. US EPA developed emission guidelines for existing small MWC units (40 CFR 60 , Subpart BBBB) in accordance with sections 111(d) and 129 of the Clean Air Act. NH DES was required to submit a state plan to EPA that implements the emission guidelines contained in subpart BBBB. Env-A 3300 was adopted by ARD on 6/7/02. The state plan was submitted to EPA on August 16, 2002 and was approved on February 10, 2003. The rule became effective (i.e., federally enforceable) on April 11, 2003. Wheelabrator is required to follow the following compliance schedule as set forth in Env-A 3308.02:
The MWC units (EU01 & EU02) shall comply with the emission limits specified in Env-A 3303 by April 11, 2004, except as provided below:
a. MWC units requiring more time to comply with the emission limits specified in Env-A 3303 shall complywith such requirements by December 6, 2005 by submitting the following:
i. A final control plan by October 11, 2003; and ii. Notification of compliance by December 6, 2005.
EMISSION LIMITS
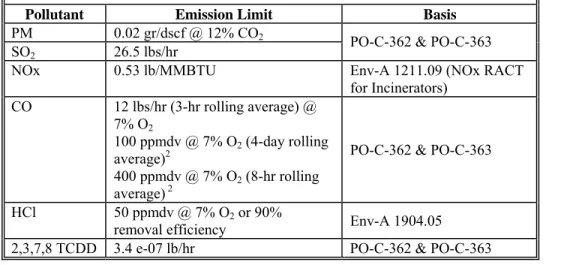
Table 2 - Applicable prior to the final compliance date set forth in Env-A 3300
Pollutant Emission Limit Basis
PM 0.02 gr/dscf @ 12% CO2
SO2 26.5 lbs/hr PO-C-362 & PO-C-363
NOx 0.53 lb/MMBTU Env-A 1211.09 (NOx RACT
for Incinerators) CO 12 lbs/hr (3-hr rolling average) @ 7% O2 100 ppmdv @ 7% O2 (4-day rolling average)2 400 ppmdv @ 7% O2 (8-hr rolling average) 2
PO-C-362 & PO-C-363
HCl 50 ppmdv @ 7% O2 or 90%
removal efficiency Env-A 1904.05 2,3,7,8 TCDD 3.4 e-07 lb/hr PO-C-362 & PO-C-363
2 Based on Dioxin Emission Control Policy, Guideline for Incinerators and Resource Recovery Facilities (Approved by NH Air
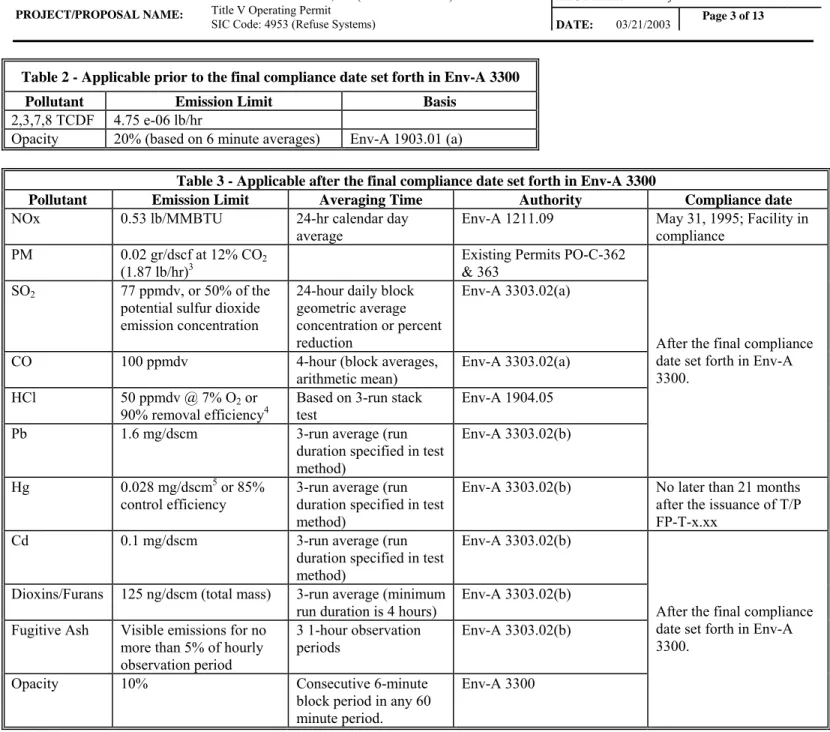
Table 2 - Applicable prior to the final compliance date set forth in Env-A 3300
Pollutant Emission Limit Basis
2,3,7,8 TCDF 4.75 e-06 lb/hr
Opacity 20% (based on 6 minute averages) Env-A 1903.01 (a)
Table 3 - Applicable after the final compliance date set forth in Env-A 3300
Pollutant Emission Limit Averaging Time Authority Compliance date
NOx 0.53 lb/MMBTU 24-hr calendar day
average Env-A 1211.09 May 31, 1995; Facility in compliance PM 0.02 gr/dscf at 12% CO2
(1.87 lb/hr)3 Existing Permits PO-C-362 & 363
SO2 77 ppmdv, or 50% of the
potential sulfur dioxide emission concentration
24-hour daily block geometric average concentration or percent reduction
Env-A 3303.02(a)
CO 100 ppmdv 4-hour (block averages,
arithmetic mean) Env-A 3303.02(a) HCl 50 ppmdv @ 7% O2 or
90% removal efficiency4 Based on 3-run stack test Env-A 1904.05
Pb 1.6 mg/dscm 3-run average (run
duration specified in test method)
Env-A 3303.02(b)
After the final compliance date set forth in Env-A 3300.
Hg 0.028 mg/dscm5 or 85%
control efficiency
3-run average (run duration specified in test method)
Env-A 3303.02(b) No later than 21 months after the issuance of T/P FP-T-x.xx
Cd 0.1 mg/dscm 3-run average (run
duration specified in test method)
Env-A 3303.02(b) Dioxins/Furans 125 ng/dscm (total mass) 3-run average (minimum
run duration is 4 hours)
Env-A 3303.02(b) Fugitive Ash Visible emissions for no
more than 5% of hourly observation period
3 1-hour observation periods
Env-A 3303.02(b)
Opacity 10% Consecutive 6-minute
block period in any 60 minute period.
Env-A 3300
After the final compliance date set forth in Env-A 3300.
EMISSION CALCULATIONS
Table 4 - Emission Rates based on AP-42 emission factors
3 This limit is more stringent than the limit imposed by Env-A 3300 (70 mg/dscm @ 7% O 2).
70 mg/dscm = 14,389 dscf/MMBTU (Fd factor at 7% O2) x 43.1 MMBTU/hr (heat input) x 70 mg/dscm (limit) x 1 lb/453,600 mg x 1
dscm/35.31 dscf = 2.71 lb/hr
4 This limit is more stringent than NSPS subpart BBBB (250 ppmdv or 50% removal efficiency) 5 This limit is more stringent than NSPS subpart BBBB (0.08 mg/dscm)
Pollutant AP-42 emission factor (lb/ton)
Uncontrolled emission rates for each MWC
unit (lb/hr)
Uncontrolled Potential emissions for each MWC unit
(TPY) PM 25.1 120.27 458.08 SO2 3.46 16.58 63.15 NOx 3.56 17.06 64.97 CO 0.463 2.22 8.45 HCl 6.4 30.67 116.80 As 4.37E-03 0.02 0.08 Cd 1.09E-02 0.05 0.20 Cr 8.97E-03 0.04 0.16 Hg 5.60E-03 0.03 0.10 Ni 7.85E-03 0.04 0.14 Pb 2.13E-01 1.02 3.89
CDD/CDF6 1.67E-06 8.00E-06 3.048E-05
♦ MWC = Municipal Waste Combustion
♦ Emission factors are taken from Tables 2.1-2 of AP-42 Chapter 2.1 Refuse Combustion.
♦ Maximum charge rate for each unit = 9583 lbs/hr of MSW.
♦ Potential emissions based on 36,500 tons/yr of MSW (annual limit). Emission rates based on permit limits
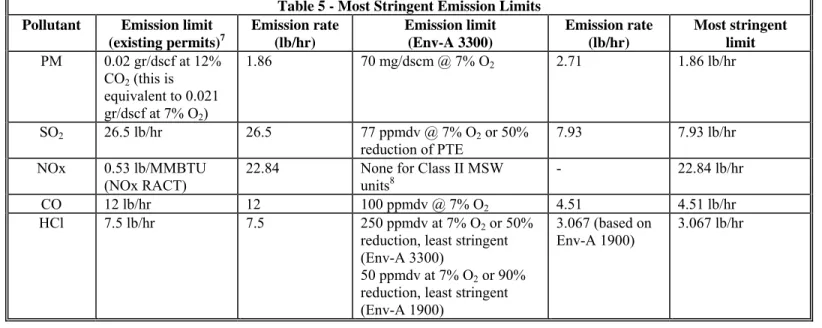
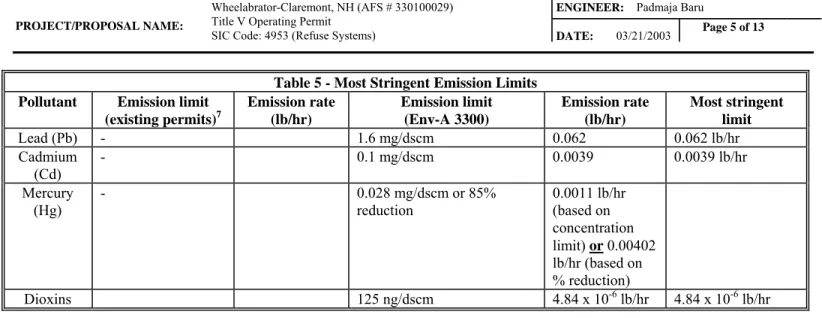
Table 5 - Most Stringent Emission Limits
Pollutant Emission limit
(existing permits)7 Emission rate (lb/hr) Emission limit (Env-A 3300) Emission rate (lb/hr) Most stringent limit PM 0.02 gr/dscf at 12% CO2 (this is equivalent to 0.021 gr/dscf at 7% O2) 1.86 70 mg/dscm @ 7% O2 2.71 1.86 lb/hr SO2 26.5 lb/hr 26.5 77 ppmdv @ 7% O2 or 50% reduction of PTE 7.93 7.93 lb/hr NOx 0.53 lb/MMBTU (NOx RACT)
22.84 None for Class II MSW
units8 - 22.84 lb/hr
CO 12 lb/hr 12 100 ppmdv @ 7% O2 4.51 4.51 lb/hr
HCl 7.5 lb/hr 7.5 250 ppmdv at 7% O2 or 50%
reduction, least stringent (Env-A 3300)
50 ppmdv at 7% O2 or 90%
reduction, least stringent (Env-A 1900)
3.067 (based on Env-A 1900)
3.067 lb/hr
6 Total tetra-through octa-chlorinated dibenzo-p-dioxin/chlorinated dibenzofurans, 2,3,7,8-tetrachlorodibenzo-p-dioxin, and
dibenzofurans.
7 PO-C-362 & 363
8 Class II units mean small MWC units (35-250 tons/day capacity) that are located at MWC plants with aggregate plant combustion
Table 5 - Most Stringent Emission Limits
Pollutant Emission limit
(existing permits)7 Emission rate (lb/hr) Emission limit (Env-A 3300) Emission rate (lb/hr) Most stringent limit Lead (Pb) - 1.6 mg/dscm 0.062 0.062 lb/hr Cadmium (Cd) - 0.1 mg/dscm 0.0039 0.0039 lb/hr Mercury (Hg) - 0.028 mg/dscm or 85% reduction 0.0011 lb/hr (based on concentration limit) or 0.00402 lb/hr (based on % reduction) Dioxins 125 ng/dscm 4.84 x 10⁻⁶ lb/hr 4.84 x 10⁻⁶ lb/hr Calculations: F-Values for Refuse
(F-factor is the ratio of the gas volume of the products of combustion to the heat content of the fuel) Fd factor (at 0% O2) = 9570 dscf/MMBTU (From Table 19-1, 40 CFR 60, Appendix A, Method 19)
Fd factor at 7% O2 = 9570 x (20.9-0%)/(20.9-7%) = 14389 dscf/MMBTU
Fc factor (CO2 basis) = 1820 dscf/MMBTU (From Table 19-1, 40 CFR 60, Appendix A, Method 19)
Ultimate CO2 in the flue gas = (1820/9570) x 100 = 19.02%
To calculate the equivalent of 12% CO2
O2 = 20.9 – {(20.9/ultimate CO2) x 12% CO2} = 7.71%
i.e., 12% CO2 ~ 7.71% O2
Particulate Matter
Existing permit limit for PM = 0.02 gr/dscf at 12% CO2 (i.e., at 7.71% O2)
We need to convert this value to gr/dscf at 7% O2 so we can compare this to Env-A 3300 limit (which is measured at 7% O2)
PM limit at 7% O2 = 0.02 x {(20.9-7)/(20.9-7.71%)} = 0.021 gr/dscf (calculated using Eq. 3 of the Title V Permit)
Convert this to lb/hr
PM emission rate (based on existing permit) = 14,389 dscf/MMBTU (Fd factor @7% O2) x 43.1 MMBTU/hr (max. heat input) x 0.021
gr/dscf (emission limit) x 1 lb/7000 gr = 1.86 lb/hr
PM emission rate (based on Env-A 3300 limit) = 14,389 dscf/MMBTU x 43.1 MMBTU/hr x 70 mg/dscm x 1 lb/453,600 mg x 1 dscm/35.31 dscf = 2.71 lb/hr
SO2
Wheelabrator chose to comply with the outlet concentration limit of 77 ppmdv @ 7% O2
SO2 allowable emission rate = 14,389 dscf/MMBTU x 43.1 MMBTU/hr x 77 parts/106 parts x 64 lb/mole (Molecular weight) x 1
lb-mole/385.3 dscf (molar volume) = 7.93 lb/hr NOx
CO
CO allowable emission rate = 14,389 dscf/MMBTU x 43.1 MMBTU/hr x 100 parts/106 parts x 28 lb/mole (Molecular weight) x 1
lb-mole/385.3 dscf (molar volume) = 4.51 lb/hr HCl
HCl allowable (based on Env-A 1900) = 50 ppmdv at 7% O2 or 90% reduction, least stringent
HCl allowable rate (based on 50 ppmdv) = 14,389 dscf/MMBTU x 43.1 MMBTU/hr x 50 parts/106 parts x 36.5 lb/lb-mole (Molecular
weight) x 1 lb-mole/385.3 dscf (molar volume) = 2.94 lb/hr
HCl allowable rate (based on 90% reduction) = 6.4 lb/ton (AP-42 emission factor) x 9583/2000 tons/hr (max. processing rate) x 0.1 = 3.07 lb/hr
HCl allowable rate (based on Env-3300) = 14,389 dscf/MMBTU x 43.1 MMBTU/hr x 250 parts/106 parts x 36.5 lb/lb-mole (Molecular
weight) x 1 lb-mole/385.3 dscf (molar volume) =14.69 lb/hr Metals
Lead allowable emission rate (based on Env-A 3300 limit) = 14,389 dscf/MMBTU x 43.1 MMBTU/hr x 1.6 mg/dscm x 1 lb/453,600 mg x 1 dscm/35.31 dscf = 0.062 lb/hr
Cadmium allowable emission rate (based on Env-A 3300 limit) = 14,389 dscf/MMBTU x 43.1 MMBTU/hr x 0.1 mg/dscm x 1 lb/453,600 mg x 1 dscm/35.31 dscf = 0.0039 lb/hr
Mercury allowable emission rate (based on Env-A 3300 limit) = 14,389 dscf/MMBTU x 43.1 MMBTU/hr x 0.028 mg/dscm x 1 lb/453,600 mg x 1 dscm/35.31 dscf = 0.0011 lb/hr
Based on 85% reduction
Mercury allowable rate = 5.6 x 10-03 lb/ton (AP-42 emission factor) x 9583/2000 tons/hr (max. processing rate) x 0.15 = 0.00402 lb/hr
Dioxins/Furans
Dioxins allowable emission rate (based on Env-A 3300) = 14,389 dscf/MMBTU x 43.1 MMBTU/hr x 125 ng/dscm x 1 lb/453.6 x 109 ng x
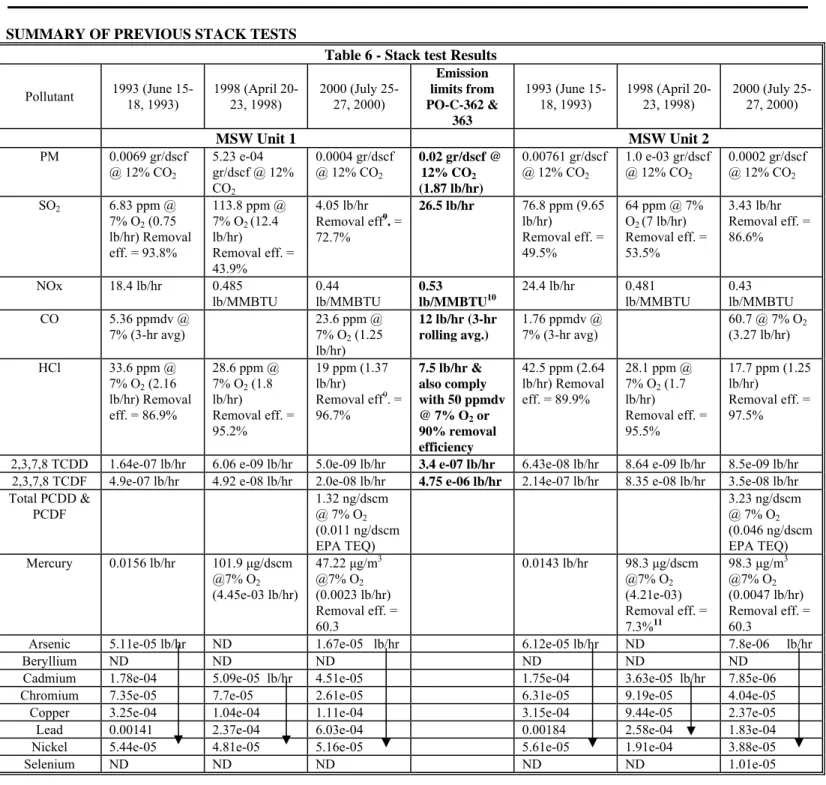
SUMMARY OF PREVIOUS STACK TESTS
Table 6 - Stack test Results
Pollutant 1993 (June 15-18, 1993) 1998 (April 20-23, 1998) 2000 (July 25-27, 2000)
Emission limits from PO-C-362 & 363 1993 (June 15-18, 1993) 1998 (April 20-23, 1998) 2000 (July 25-27, 2000) MSW Unit 1 MSW Unit 2 PM 0.0069 gr/dscf @ 12% CO2 5.23 e-04 gr/dscf @ 12% CO2 0.0004 gr/dscf @ 12% CO2 0.02 gr/dscf @ 12% CO2 (1.87 lb/hr) 0.00761 gr/dscf @ 12% CO2 1.0 e-03 gr/dscf @ 12% CO2 0.0002 gr/dscf @ 12% CO2 SO2 6.83 ppm @ 7% O2 (0.75 lb/hr) Removal eff. = 93.8% 113.8 ppm @ 7% O2 (12.4 lb/hr) Removal eff. = 43.9% 4.05 lb/hr Removal eff9 . = 72.7% 26.5 lb/hr 76.8 ppm (9.65 lb/hr) Removal eff. = 49.5% 64 ppm @ 7% O2 (7 lb/hr) Removal eff. = 53.5% 3.43 lb/hr Removal eff. = 86.6% NOx 18.4 lb/hr 0.485 lb/MMBTU 0.44 lb/MMBTU 0.53 lb/MMBTU10 24.4 lb/hr 0.481 lb/MMBTU 0.43 lb/MMBTU CO 5.36 ppmdv @ 7% (3-hr avg) 23.6 ppm @ 7% O2 (1.25 lb/hr) 12 lb/hr (3-hr rolling avg.) 1.76 ppmdv @ 7% (3-hr avg) 60.7 @ 7% O2 (3.27 lb/hr) HCl 33.6 ppm @ 7% O2 (2.16 lb/hr) Removal eff. = 86.9% 28.6 ppm @ 7% O2 (1.8 lb/hr) Removal eff. = 95.2% 19 ppm (1.37 lb/hr) Removal eff9. = 96.7% 7.5 lb/hr & also comply with 50 ppmdv @ 7% O2 or 90% removal efficiency 42.5 ppm (2.64 lb/hr) Removal eff. = 89.9% 28.1 ppm @ 7% O2 (1.7 lb/hr) Removal eff. = 95.5% 17.7 ppm (1.25 lb/hr) Removal eff. = 97.5%
2,3,7,8 TCDD 1.64e-07 lb/hr 6.06 e-09 lb/hr 5.0e-09 lb/hr 3.4 e-07 lb/hr 6.43e-08 lb/hr 8.64 e-09 lb/hr 8.5e-09 lb/hr
2,3,7,8 TCDF 4.9e-07 lb/hr 4.92 e-08 lb/hr 2.0e-08 lb/hr 4.75 e-06 lb/hr 2.14e-07 lb/hr 8.35 e-08 lb/hr 3.5e-08 lb/hr
Total PCDD & PCDF 1.32 ng/dscm @ 7% O2 (0.011 ng/dscm EPA TEQ) 3.23 ng/dscm @ 7% O2 (0.046 ng/dscm EPA TEQ) Mercury 0.0156 lb/hr 101.9 μg/dscm @7% O2 (4.45e-03 lb/hr) 47.22 μg/m3 @7% O2 (0.0023 lb/hr) Removal eff. = 60.3 0.0143 lb/hr 98.3 μg/dscm @7% O2 (4.21e-03) Removal eff. = 7.3%11 98.3 μg/m3 @7% O2 (0.0047 lb/hr) Removal eff. = 60.3
Arsenic 5.11e-05 lb/hr ND 1.67e-05 lb/hr 6.12e-05 lb/hr ND 7.8e-06 lb/hr
Beryllium ND ND ND ND ND ND
Cadmium 1.78e-04 5.09e-05 lb/hr 4.51e-05 1.75e-04 3.63e-05 lb/hr 7.85e-06
Chromium 7.35e-05 7.7e-05 2.61e-05 6.31e-05 9.19e-05 4.04e-05
Copper 3.25e-04 1.04e-04 1.11e-04 3.15e-04 9.44e-05 2.37e-05
Lead 0.00141 2.37e-04 6.03e-04 0.00184 2.58e-04 1.83e-04
Nickel 5.44e-05 4.81e-05 5.16e-05 5.61e-05 1.91e-04 3.88e-05
Selenium ND ND ND ND ND 1.01e-05
9 Concentration based
10 Compliance date May 31, 1995. Prior to this date, facility was required to comply with the NOx emission limit of 26.5 lb/hr
(PO-C-362 & 363).
11 For Unit #2, in run #3, the outlet concentration was higher than the inlet concentration. Hence the overall removal efficiency was
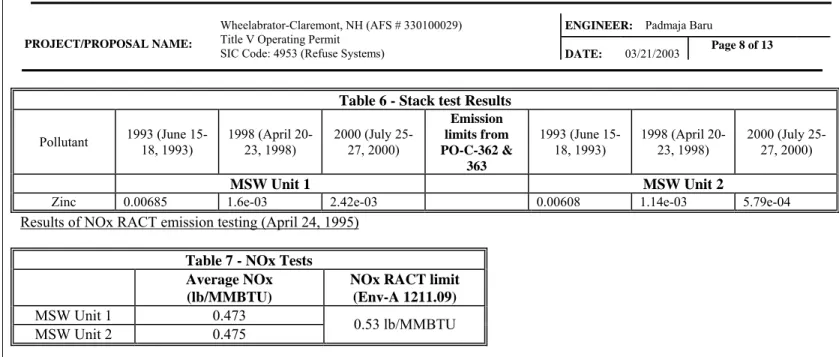
Table 6 - Stack test Results
Pollutant 1993 (June 15-18, 1993) 1998 (April 20-23, 1998) 2000 (July 25-27, 2000)
Emission limits from PO-C-362 & 363 1993 (June 15-18, 1993) 1998 (April 20-23, 1998) 2000 (July 25-27, 2000) MSW Unit 1 MSW Unit 2
Zinc 0.00685 1.6e-03 2.42e-03 0.00608 1.14e-03 5.79e-04
Results of NOx RACT emission testing (April 24, 1995)
Table 7 - NOx Tests Average NOx (lb/MMBTU)
NOx RACT limit (Env-A 1211.09)
MSW Unit 1 0.473
MSW Unit 2 0.475 0.53 lb/MMBTU
Stack testing requirements:
1. The Permittee shall conduct stack testing for PM, Opacity, HCl, Dioxins/furans, Cadmium, Lead and Fugitive ash within 180 days after the final compliance date. Annual stack testing is also required for these pollutants.
2. For Mercury - within 21 months after the issuance of the Temporary permit. Conduct quarterly testing, alternating emission units each quarter for a period of one year. If the annual average of the quarterly testing is less than or equal to 0.028 mg/dscm or 85% control efficiency, annual testing may be conducted for both units.
3. NOx - Annually to demonstrate compliance with NOx RACT (Env-A 803.02 requires NOx RACT testing every 3 years; however facility agreed to conduct this testing every year).
4. Compliance with SO2 and CO limits shall be verified through CEMS.
5. At the performance testing conducted pursuant to Item #6 of Table 5b of the TV permit, the Permittee shall conduct
optimization tests to determine the optimized carbon feed rate of the powder activated carbon injection system for which the mercury emissions are optimally minimized below the applicable limits.
MONITORING REQUIREMENTS
The facility shall meet the following monitoring requirements: 1. Continuous Emissions Monitoring for SO2, CO and CO2 or O2
a. Measure CO2 or O2 at each location where SO2 or CO are measured.
b. Obtain 1-hr averages of SO2, CO and CO2 or O2.
c. Collect minimum amount of data specified in 40 CFR 60.1750.
d. Conduct initial, daily, quarterly and annual evaluations of the CEM systems in accordance with Env-A 3300 and Env-A 808.
2. Continuous Opacity Monitoring 3. Continuous Parameter Monitoring
a. Load level
i. Continuously measure and record steam or feed water in pounds/hour. ii. Calculate 4-hr block average.
iii. Calibrate the steam (feed water) flow meter at least once a year in accordance with manufacturer’s specifications.
b. Temperature of the flue gases at the inlet of each PM control device (i.e., each baghouse); Continuously measure the temperature.
c. Carbon feed rate; Optimum feed rate to be determined during initial stack testing for mercury or dioxins/furans. i. Monitor the usage of carbon and calculate 8-hr block average.
d. Obtain 1-hr averages of load level, temperature and carbon feed rate. e. Collect minimum amount of data required by 40 CFR 60.1825.
RECORDKEEPING REQUIREMENTS
1. Monthly lime usage records for DLIS.
2. Comply with the recordkeeping requirements of 40 CFR 60.1830, 60.1835, 60.1840, 60.1845, 60.1850, & 60.1855. 3. Comply with the recordkeeping requirements of Env-A 905.03 (General Recordkeeping) and Env-A 905.02 (NOx
recordkeeping).
REPORTING REQUIREMENTS
1. Comply with the reporting requirements of 40 CFR 60.1860, 60.1865, 60.1870, 60.1875, 60.1880, 60.1885, 60.1890, 60.1895 & 60.1900.
2. Comply with the reporting requirements of Env-A 907.01 (General reporting) and Env-A 905.02 (NOx Reporting). MODELING
The following Tables summarize facility’s compliance with Env-A 300 and Env-A 1400.
Pre-retrofit
Modeling results from 12/27/99 & 1/17/03 for CO
Stack Parameters
Height = 150 feet
Diameter = 2.6 feet
Exhaust flow rate = 24010 ACFM (from Title V application); Modeling used this flow rate x 2 Exhaust Temp. = 341oF Impacts (1 lb/hr) ug/m3 Annual 0.051 24-hr (high) 0.59 24-hr (HSH) 0.53 3-hr 1.84 8-hr 0.99 1-hr 4.92 HSH = High Second High
Criteria
Pollutant MWC Units Basis
24-hr impact Annual impact 3-hr impact 8-hr impact 1-hr impact AAQS 24-hr Annual AAQS 3-hr AAQS 8-hr AAQS 1-hr AAQS Each unit (lb/hr) Both units
(lb/hr) ug/m3 ug/m3 ug/m3 ug/m3 ug/m3 ug/m3 ug/m3 ug/m3 ug/m3 ug/m3
PM 3.212 6.4 Title V App 3.392 0.3264 150 50
SO2 26.5 53 Title V App & Old Permits* 28.09 2.703 97.52 365 80 1300
NOx 23 46 Title V App & NOx RACT 2.346 100
CO 12 24 Title V App 23.76 118.1 10000 40000
12 This is based on the permit limit of 0.02 gr/dscf at 12% CO
2. In the TV application, the PM emission rate is calculated as shown
below:
0.02 gr/dscf x 18538 dscf/min (maximum recorded stack test flow rate) x 1 lb/7000gr x 60 min/hr = 3.2 lb/hr
The emission rate that I calculated in Table 5 (1.86 lb/hr) is based on Fd factor at 7% O2 and max. heat input (43.1 MMBTU/hr). I used
* PO-C-362 & 363
RTAP MWC Units Basis 24-hr impact Annual impact 24-hr AAL Annual AAL
Each unit (lb/hr) Both units (lb/hr) ug/m3 ug/m3
ug/m3 ug/m3
HCl 7.5 15 Title V App 8.85 0.765 27 20
TCDD 0.00000034 6.80E-07 Title V App 4.012E-07 3.468E-08 0.001 0.001 TCDF 0.00000475 9.50E-06 Title V App 0.000005605 4.845E-07 0.001 0.001
Lead 0.00184 0.00368 1993 stack test (emission rate for unit 2; Assumed the same rate for unit 1 also.) 0.0021712 0.0001877 0.179 0.119 Nickel 1.91E-04 3.82E-04 1998 stack test; (emission rate for unit 2; assumed the same for unit 1 also) 0.00022538 1.948E-05 0.357 0.238 Chromium 9.19E-05 1.84E-04 Same as above 0.000108442 9.374E-06 0.036 0.024
Cadmium 0.000178 0.000356 1993 stack test (emission rate for unit 1; assumed the same for unit 2 also.) 0.00021004 1.816E-05 0.036 0.024 Mercury 0.016 0.032 Same as above 0.01888 0.001632 0.3 0.3
Arsenic 0.0000612 0.000122 1993 stack test; (emission rate for unit 2; assumed the same for unit 1 also) 0.000072216 6.242E-06 0.036 0.024 Cobalt 0.000172 3.44E-04 Title V application 0.00020296 1.754E-05 0.071 0.048 Manganese 0.0026 0.0052 Title V application 0.003068 0.0002652 1.006 0.05
HF 0.011 0.022 Title V application 0.01298 0.001122 8.214 5.476 H2SO4 mist 0.39 0.78 Title V application 0.4602 0.03978 3.571 2.381
PCB 7.35E-08 1.47E-07 Title V application 8.673E-08 7.497E-09 0.1 0.1 PAH 0.000076 1.52E-04 Title V application 0.00008968 7.752E-06
Copper 3.25E-04 6.50E-04 1993 stack test (emission rate for unit 1; Assumed the same rate for unit 2 also.) 0.0003835 3.315E-05 0.714 0.476 Zinc 6.85E-03 1.37E-02 Same as above 0.008083 0.0006987 0.036 0.024
Waste oil heater MWC Units (both) Combined impacts Ambient Air Limits Pollutant Emission rate 24-hr impact Annual impact Emission rate 24-hr impact Annual impact 24-hr impact Annual impact 24-hr AAL Annual AAL
lb/hr ug/m3 ug/m3 lb/hr ug/m3 ug/m3 ug/m3 ug/m3 ug/m3 ug/m3
Arsenic 0.0000384 0.001308211 0.000327053 0.0001224 0.000072216 6.2424E-06 0.001380427 0.000333295 0.036 0.024 Chromium 0.0000768 0.002616422 0.000654106 1.84E-04 0.00010856 0.000009384 0.002724982 0.00066349 0.036 0.024
Cadmium 0.0000154 0.000524647 0.000131162 0.000356 0.00021004 0.000018156 0.000734687 0.000149318 0.036 0.024 Lead 0.000768 0.026164224 0.006541056 0.00368 0.0021712 0.00018768 0.028335424 0.006728736 0.179 0.119 PCB 0.0000154 0.000524647 0.000131162 1.47E-07 8.673E-08 7.497E-09 0.000524734 0.000131169 3.571 2.381 Total
Halogens 0.0076 0.2589168 0.0647292 15 8.85 0.765 9.1 0.83 607 (for HCl) 405 Total
Halogens 0.0076 0.2589168 0.0647292 0 0 0 0.2589168 0.0647292 27 (for PCE) 20 Normalized heater impact at 1 lb/hr (1 hour average) = 85.17 ug/m3
24-hr (1 lb/hr) impact = 0.4 x 85.17 = 34.068 ug/m3
Post Retrofit
Modeling results from 01/31/03 Stack Parameters
Height = 150 feet Diameter = 2.6 feet
Exhaust flow rate = 26,000 ACFM; Modeling used this flow rate x 2 Exhaust Temp. = 320oF Impacts (1 lb/hr) ug/m3 Annual 0.049 24-hr (high) 0.574 24-hr (HSH) 0.512 3-hr 1.744 8-hr 0.972 1-hr 4.872 Criteria
Pollutant MWC Units Basis 24-hr impact
Annual
impact 3-hr impact 8-hr impact 1-hr impact AAQS 24-hr
Annual AAQS 3-hr AAQS 8-hr AAQS 1-hr AAQS Each unit (lb/hr) Both units (lb/hr)
ug/m3 ug/m3 ug/m3 ug/m3 ug/m3
ug/m3 ug/m3 ug/m3 ug/m3 ug/m3
PM 3.2 6.4 Title V App 3.2768 0.3136 150 50
SO2 7.93 15.86 Env-A 3300 8.12 0.78 27.66 365 80 1300
NOx 23 46 NOx RACT 2.254 100
CO 4.51 9.02 Env-A 3300 8.77 43.95 10000 40000
RTAP MWC Units Basis 24-hr impact Annual impact 24-hr AAL Annual AAL
Each unit (lb/hr) Both units (lb/hr) ug/m3 ug/m3
ug/m3 ug/m3
HCl 3.07 6.14 Env-A 1900 3.52 0.3 27 20
TCDD 4.84E-06 9.68E-06 Env-A 3300 5.556E-06 4.743E-07 0.001 0.001 TCDF 4.84E-06 9.68E-06 Env-A 3300 5.556E-06 4.743E-07 0.001 0.001
Lead 0.062 0.124 Env-A 3300 0.071176 0.006076 0.179 0.119
Nickel 1.91E-04 3.82E-04 1998 stack test; (emission rate for unit 2; assumed the same for unit 1 also) 0.0002193 1.872E-05 0.357 0.238 Chromium 9.19E-05 1.84E-04 Same as above 0.0001055 9.006E-06 0.036 0.024
Cadmium 0.0039 0.0078 Env-A 3300 0.0044772 0.0003822 0.036 0.024 Mercury 0.016 0.032 1993 stack test (emission rate for unit 1; Assumed the same rate for unit 2 also.) 0.018368 0.001568 0.3 0.3 Mercury 0.00402 0.00804 Env-A 3300 (85% reduction of potential emission rate) 0.00461 0.0004 0.3 0.3
Arsenic 6.12E-05 0.000122 1993 stack test; (emission rate for unit 2; assumed the same for unit 1 also) 7.026E-05 5.998E-06 0.036 0.024 Cobalt 0.000172 3.44E-04 Title V application 0.0001975 1.686E-05 0.071 0.048
RTAP MWC Units Basis 24-hr impact Annual impact 24-hr AAL Annual AAL
Each unit (lb/hr) Both units (lb/hr) ug/m3 ug/m3 ug/m3 ug/m3 Manganese 0.0026 0.0052 Title V application 0.0029848 0.0002548 1.006 0.05
HF 0.011 0.022 Title V application 0.012628 0.001078 8.214 5.476 H2SO4 mist 0.39 0.78 Title V application 0.44772 0.03822 3.571 2.381
PCB 7.35E-08 1.47E-07 Title V application 8.438E-08 7.203E-09 0.1 0.1 PAH 0.000076 1.52E-04 Title V application 8.725E-05 7.448E-06
Copper 3.25E-04 6.50E-04 1993 stack test (emission rate for unit 1; Assumed the same rate for unit 2 also.) 0.0003731 3.185E-05 0.714 0.476 Zinc 6.85E-03 1.37E-02 Same as above 0.0078638 0.0006713 0.036 0.024
Waste oil heater MWC Units (both) Combined impacts
Pollutant Emission rate 24-hr impact Annual impact Emission rate 24-hr impact Annual impact 24-hr impact Annual impact 24-hr AAL Annual AAL
lb/hr ug/m3 ug/m3 lb/hr ug/m3 ug/m3 ug/m3 ug/m3
ug/m3 ug/m3
Arsenic 0.0000384 0.001308211 0.000327053 0.0001224 7.02576E-05 5.9976E-06 0.00137847 0.00033305 0.036 0.024 Chromium 0.0000768 0.002616422 0.000654106 1.84E-04 0.000105616 0.000009016 0.00272204 0.000663122 0.036 0.024
Cadmium 0.0000154 0.000524647 0.000131162 0.0078 0.0044772 0.0003822 0.00500185 0.000513362 0.036 0.024 Lead 0.000768 0.026164224 0.006541056 0.124 0.071176 0.006076 0.09734022 0.012617056 0.179 0.119 PCB 0.0000154 0.000524647 0.000131162 1.47E-07 8.4378E-08 7.203E-09 0.00052473 0.000131169 3.571 2.381 Total Halogens 0.0076 0.2589168 0.0647292 6.14 3.52 0.3 3.78 0.365 607 (for HCl) 405 Total Halogens 0.0076 0.2589168 0.0647292 0 0 0 0.2589168 0.0647292 27 (for PCE) 20 Normalized heater impact at 1 lb/hr (1 hour average) = 85.17 ug/m3
24-hr (1 lb/hr) impact = 0.4 x 85.17 = 34.068 ug/m3
Annual (1 lb/hr) impact = 0.1 x 85.17 = 8.517 ug/m3 INSIGNIFICANT ACTIVITIES
Insignificant Activity Basis
1. Lime Silo Env-A 609.02(g)
2. Facility roadways Env-A 609.02(g)
3. Safety kleen degreaser Env-A 609.02(g)
4. 5000 gal Phosphoric acid storage tank Env-A 609.02(g)
5. Two 500 gal diesel fuel tanks Env-A 609.02(g)
6. Propane Vaporizer (0.2 MMBTU/hr) Below permitting threshold of 10 MMBTU/hr 7. Diesel backup generator (0.57 MMBTU/hr) Below permitting threshold of 1.5 MMBTU/hr 8. Waste oil heater (0.14 MMBTU/hr) - uses
REVIEW OF REGULATIONS
NSPS 40 CFR 60, Subpart BBBB Emission Guidelines for existing Small MWC Units.
40 CFR 60, Subpart E Standards of Performance for Incinerators (each with a charging rate of more than 50 tons/day); However the
PM limit imposed by the state permits is more stringent. NESHAP N/A
Title V Yes
Env-A 300 AAQS; Facility in compliance Env-A 609 Title V Operating Permits Env-A 700 Permit Fee System
Env-A 800 Testing & Monitoring Procedures Env-A 900 Owner/Operator Obligations
Env-A 1211 NOx RACT requirements of Env-A 1211.09, Incinerators are applicable; Facility shall also comply with NOx
RACT Testing requirements of Env-A 803.02. NOx monitoring requirements of Env-A 1211.21 are not applicable. Env-A 1400 Regulated Toxic Air Pollutants; Facility is in compliance.
Env-A 1600 Fuel Specifications for Propane Env-A 3300 Municipal Waste Combustion
SUMMARY AND CONCLUSIONS
In summary, the operations as applied for will be capable of meeting all regulations and standards for air quality. Title V Operating Permit shall therefore be issued.