http://ijasos.ocerintjournals.org 174
A CASE STUDY IN THE APPLICATION MARKET: BEHAVIOR OF PLAY
STORE CUSTOMERS
Ihsan Tolga Medeni
Asst. Prof. Dr., Ankara Yildirim Beyazit University, Turkey,
[email protected]
Abstract
Google is one of the key players in the mobile market. With the power of its operating system, namely called as Android, many mobile phone producers were started to install their products to serve mobile device market customers. One of the key embedded applications in the Google’s Android operating system could be presented as the Play Store. Play Store is an application for the end users of the mobile devices that gives opportunities to other application from its rich application content. With a customer’s Google account, millions of applications are ready to download to these mobile devices. In the Play Store, these applications are categorized under twenty-eight different categorizes based on a simple tagging mechanism. In each category, applications are listed in three top lists, Top Paid list for the applications with the price tags; Top Free applications without price tags, and Top Grossing to support application’s run time payment mechanism. Based on the county of origin of the customer’s Google Accounts, the market application content is changing. In this study, the main purpose is to see the connection between Top 10 rankings changes based on external stimuluses such as starting of education semester in the schools and universities, migrant’s actions, exams that are coordinated by higher education authorizes etc… in a specific county application market. In this study with using an Android based cell phone the monthly changes in these top lists have been investigated by looking at only these top 10 lists of each category. The changes in these top 10 applications discussed with looking the possible environmental factor changes. This study is focused on the Turkish market in the period of July 2015 and November 2015. To be able to measure the changes, two ratios, Keeping Positions Ratio (KPR), and New Applications Ratio (NAR) were defined. This four-month period results presented and based on the most dynamic categories, the changes in the applications were discussed and presented.
Keywords: Application Market, Google Play Store, Top 10 Applications
1. INTRODUCTION
Top list based studies have implemented in many of the study domains. By surveying in Thomson Reuter’s Web of Science for the current literature1 currently in different domains, ranking based studies on the mobile
1
Retrieval Date, March 15, 2016, from http://apps.webofknowledge.com/, with querying “Top 10” and mobile words, totally, 18 results were collected.
http://ijasos.ocerintjournals.org 175 was already applied in agriculture (Crookston,2006), educational learning (Pilar et al.,2013), medicine (Knight et al., 2015), local government (Walravens, 2015) , technology oriented trends (Kaur, 2013), economy (Ghose & Han,2014). In the given context the studies of Han, 2013, Song et al., 2012 and Wan, 2014 are close to the point of view to this research. In the study of Gyoon, top 100 applications that are discoveriable in Korea studied in the term first quarter of 2014 to analyse user help design styles in the mobile applications. In the study of Jaeki et al., by looking at the top lists, the applications discoverabilities were measured. In Lili, by looking at the top lists of the applications, factors affecting the mobile applications download rated were studied.
Mobile devices such as smart phones and tablets are important tools with the capability of being online 7/24 if there is a proper Internet connection. These devices can run hundreds of millions of different applications. From the perspective of this study, downloading most popular applications has become important for the owners of these device users to be able to being a part of the community that is created with the other application users. For this reason, the applications become the indicators of customers’ behaviours to reflect changes. Furthermore, there are different mobile application stores available for the smart phone users. Even the accessibility of these markets basically defined by the currently owned devices by the end users, there are different application markets for the users of the mobile devices. In spite of this factor, to be able to show this indicator, first of all, the application market needs to be decided by looking at the related statistical data. From this perspective, in this study the current digital application market selection will be discussed after this introduction part. Even deciding the application market is an important step, the method and scope of this study also need to be defined. There for, after Digital Application Market section, this requirement will be answered. The results of the study will be presented before the final section. At the end of this study, the conclusion and future of the study will be discussed.
2. DIGITAL APPLICATION MARKETS
June 27 2007 is an important date for the smart mobile devices. On that day, first generation of the Apple iPhone was presented with the iOS Operating System (OS). Google was one the first company to answer this new market competition by introducing Android beta version of OS for the rest of phones did not built by the Apple on November 2007.2 Not only these firms OSs but also the application market software embedded within these OS are the harbingers of a new generation of smart devices. Today, Play Store by Google and App Store by Apple are best known application markets on the mobile devices.
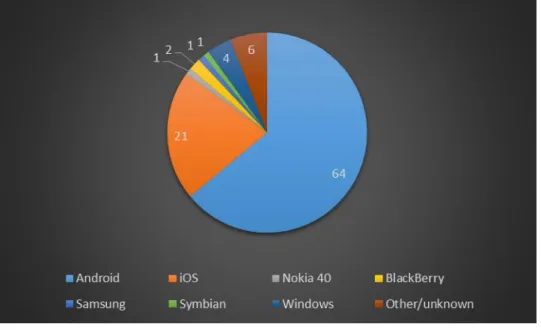
Rather than Apple’s and Google’s OSs there are other alternatives in the smart mobile device market. Microsoft, Blackberry, Nokia and other firms have their own OSs and related application market software. Based on the statistics published by Statisca (2015, July), Android based systems are leader in the current global market with 64.8% share. The other devices could be visualized as in Figure 1.
Fig. 1. Global distribution of mobile operating systems, July 2015.
2
These information is a combined history that was retrieved from https://www.wikipedia.org/. The retrieval date was December 1, 2015.
http://ijasos.ocerintjournals.org 176 With its more than 1 600 000 number of applications (Statisca 2, July 2015), Google Play store represents more than 60% of the global application population. Based on the data collected from the Google Play store, in the next section, the method implemented to analyse these data and scope will be presented.
3. METHOD AND SCOPE
In this study, the time period between June 2015 and November 2015 was investigated. Under Google Play store, there is not any publicly available known Application Programming Interface (API) for sharing application market statistics. For this reason, the study is only focused on the changes in the Top 10 application lists of each category. In this period, to collect 28 categories of applications’ data was collected with the Google Play Store mobile phone interface. Under each 28 categories, except family, applications were grouped under three categories, Top Price, Top Free and Top Grossing. The Top Price sub-category was tagged as Google Top Price (GTP), the Top Free sub-sub-category was tagged as Google Top Free (GTP) and the Top Grossing sub-category was tagged as Google Top Grossing (GTG) for collecting data from the referred interface. The GTP is related with the top application downloads from the applications with one-time payment requirement, the GTF is related with the top application downloads from the applications without any pre-paid approach, and GTF is related with the application that brings revenue from the GTP and GTF applications with including app-in purchases and one-time payment revenues. Under some of the 28 main categories, there were other sub-categories available; however they were not included under the scope of this study. Under Family category, the GTG sub-category was not activated in the period of data collection, therefrom GTG of family category was not included under the scope of the study.
In Google Play Store, to be able to purchase and download an application, a Google account is a prerequisite for the end users. The content and the statistics reflected on a specific region only available to the related accounts. Conjointly, the Internet Protocol (IP) addressing based account checking applicable in the Google Play Store. This condition likewise implemented for displaying regional content to the IP addressing specified smart devices. Therefore, the data was collected with a Turkish Google Account by connecting directly a smart phone registered in Turkey. Despite the regional restrictions, if the applications are open for the specific region in the world that is possible to download in a smart device with a Turkish origin Google account. For the data collection, throughout each month’s last ten-day, the data collection activity was implemented.
Based on the literature review, even some studies were existed similar to perspective of this research, there was not any measurement ratio to satisfy the demanded information of the changes in between stability of positions and changes in the top 10 lists. To achieve this purpose two ratios were defined to compare changes in each month, Keeping Positions Ratio (KPR) and New Applications Ratio (NAR). KPR was calculated by dividing the number of application that kept their rank in top 10 with compare to the previous month list by 10, the total number of applications in the top 10 list. The results are in between 0 to 1. If KPR is close the 1, this will show the stability of the category and sub-category that show the applications ability to keep their position in the investigated Top 10 list. Even though, if KPR is close to the 0, this will show the categories dynamism in updating the applications in the investigated Top 10 list. To show changes in each category and subcategory, the average of the months KPR was taken. NAR value calculation is also similar to the calculation of KPR. In NAR, calculation is made by dividing the number of application new in in top 10 with compare to the previous month list by 10, again the total number application in the Top 10 list. The results are in between 0 to 1. If NAR value is close the 1, this will show the dynamism of the category and sub-category that show the applications changes in Top 10 list. This shows the domination of the new applications in the given categories’ sub category. However, if NAR is close to the 0, this will show the categories stability in updating the applications in the top 10 list. The collected results are presented in the next section.
4. RESULTS
The results are investigated based on average KPR and NAR values. For each ratio, the related results are presented under the related sub-section.
4.1. KPR Values
The high average KPR values show the stability in the given category and the low values show dynamic structure on the given category. To be able see changes and estimate reasons on changes in these categories, the low values are important. The KPR values are given under GTP, GTF and GTG subcategories. For 28 categories and the results summarized in Figure 2.
http://ijasos.ocerintjournals.org 177 Fig. 2. Average KPR between July 2015 and November 2015.
Under each category, the results are collected as follows;
4.1.1 GTP
Based on GTP values, with the 0.525 KPR value, the communication category has the highest value. This shows that, in Top 10 applications, the positions of the applications remain most stable under communication category. When the category detailed examined, from July to August 2015, ranked 1st ,4th ,5th ,6th and 7th applications kept their positions. From August to September, the ranked 1st, 2nd,3rd ,4th and 6th applications were kept their positions. From September to October, 1st ,2nd ,3rd ,7th and 8th and from October to November, 1st ,2nd ,3rd ,4th and 5th were kept their current positions.
The lowest KPR value is spotted under Sports category with the value of 0.05. This shows that, under the GTP category, Sport is the highest changes between all the remaining 27 categories. The category results show that, only from July to August 2015, 1st ranked and from August to September 2015 2nd ranked applications remained in the same place. For the other months, KPR value is 0.
4.1.2 GTF
Based on GTF values, with the 0.475 KPR value, similar to GTP, Communication category has the highest value. This shows that, in Top 10 applications, the positions of the applications remain most stable under communication category. The detailed category examination shows that, from July to August 2015 1st, 2nd, 3rd and 4th ranked applications; from August to September 2015 same ranks; from September to October 2015; 5th ranked edition to the first four and from October to November 2015, ranked 8th added as to sixth application into the previous five application list.
Under Top 10 Free applications, with the 0.01 KPR value, Music and Audio is the most dynamic category. From July to August 2015 1st and 2nd, from August to September 2015 none; from September to October 2015 only 7th; and from October to November 2015 6th applications kept their places.
4.1.3 GTG
Based on GTG values, with the 0.63 KPR value, Transportation category has the highest values. This shows that, in Top 10 applications, the positions of the applications remain most stable under Transportation category. The detailed category examination shows that, from July to August 2015 1st, 2nd,3rd,4th, 9th and 10th; from August to September 2015 3rd, 4th, 6th and 9th; from September 2015 to October 2015 1st, 2nd, 3rd, 6th, 7th, 8th and 10th; and from October to November 2015, 1st, 2nd, 3rd, 4th, 5th, 8th, 9th and 10th applications remained same rank.
Under GTG applications education KPR value is zero, which means there is not any applications kept its previous positions.
4.1.4 KPR result evaluation
http://ijasos.ocerintjournals.org 178 shows that changes in Education. Starting with new 2015-2016 educating semester, education and OSYM exam related application started to appear. Even so, it does not give new applications on The top 10 lists comparing with the previous month. To be able to see that, NAR values evaluation is required.
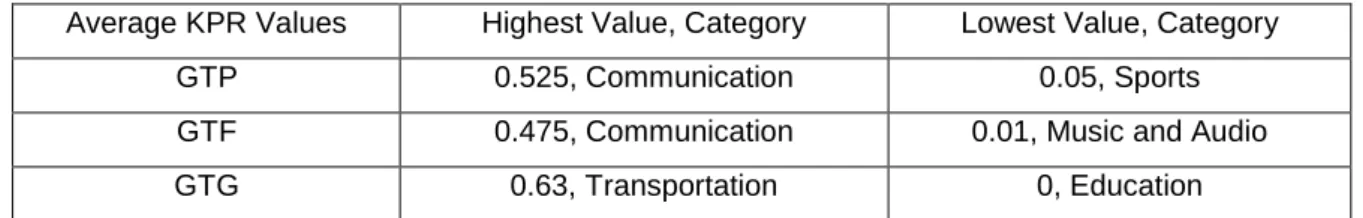
Table 1. Average highest and lowest KPR values in GTP, GTF and GTG with categories.
Average KPR Values Highest Value, Category Lowest Value, Category
GTP 0.525, Communication 0.05, Sports
GTF 0.475, Communication 0.01, Music and Audio
GTG 0.63, Transportation 0, Education
4.2. NAR Values
The high NAR values show the new applications in the Top 10 list of the given category and the high values show dynamic structure on the given category. To be able see changes and estimate reasons on changes in these categories, the high values are important. The KPR values are given under GTP, GTF and GTG subcategories. For 28 categories, the results summarized in Figure 3.
Fig. 3. Average NAR between July 2015 and November 2015
4.2.1 GTP
Based on GTP values, with the 0.525 NAR value, the education and the sport categories have the highest value. This shows that, in Top 10 applications, the positions of the applications remain most dynamic under education and sport categories. When the Education category detailed examined from July to August 2015, 1st, 6th, 7th, 8th, 9th and 10th applications are new comers to the Education. From August to September, 1st, 3rd, and 7th applications; from September to October 2015, 1st ,2nd ,3rd ,4th, 5th, 7th, 8th from October to November, 1,2,3,4 and 5 kept their current positions. The sport category results are; from July to August 2015 2nd, 3rd, 4th, 8th, 9th and 10th ranked; from August to September 2015 1st, 3rd, 4th,5th, 6th, 9th and 10th ; from September to October 2015 2nd, 3rd, 6th, 8th and 10th and from October to November 2015 6th, 8th and 9th applications ranked in the top 10 list. In here the sport results is parallel with the KPR ratio.
The lowest value was identified for the Comics category with the 0.075 NAR value. Only changed detected from July to August 2015 with two applications (8th and 9th) and September to October 2015 with two applications (4th and 9th).
4.2.2 GTF
Based on GTF values, with 0.525 the games category has the highest value. From July to August 2015, 4th, 5th, 7th and 10th applications; from August to September 2015 2nd, 4th, 6th, 7th and 8th applications, from September to October 2015 1st, 2nd, 4th, 5th, 6th, 7th and 10th applications, from October to November 2015 1st,
http://ijasos.ocerintjournals.org 179 2nd, 5th, 7th and 10th applications were ranked in the top 10 list.
With 0.075 value, the social category has the lowest value in the GTF category. Only 3 of the 4 periods the 10th application’s rank changed.
4.2.3 GTG
Parallel with the result of GTP, with the value 0.525 Sport has the highest value in the top 10 list. From July to August 2015, 1st, 5th and 9th applications; from August to September 2015 ranks of the all applications changed; from September to October 2015, 4th, 5th, 6th, 8th, 9th and 10th; from October to November 2015 5th, 7th, 9th and 10th applications ranked had been changed.
Games, Medical and Photography categories showed same NAR value, 0.05. Under the games, the 8th positions changed twice; for the medical category, the 10th positions changed twice and for photography, 7th position changed from July to August and 10th position changed from October to November period.
4.2.3 NAR result evaluation
When the education category is taken into the account, after announcement of OSYM’s exam schedule especially KPSS and Police Officer exams took the top 10 place on the GTP application which is reflected on the results in between September to October period. Sport in GTP applications also shows relation between the starting of football and soccer season in the world. In GTP sport application, on September and October one Turkish Soccer league related application was determined. However, in Turkish application store, GTP sport mostly effected by abroad applications.
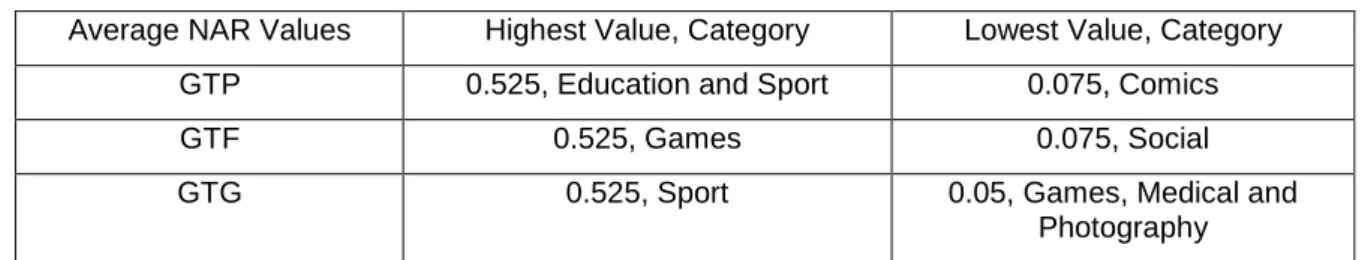
Table 2. Average highest and lowest NAR values in GTP, GTF and GTG with categories.
Average NAR Values Highest Value, Category Lowest Value, Category
GTP 0.525, Education and Sport 0.075, Comics
GTF 0.525, Games 0.075, Social
GTG 0.525, Sport 0.05, Games, Medical and
Photography
Under GTG, for the sport applications, especially with start of the Turkish soccer league, the betting related and football game watching related application started to palaces on the top 10 list. The September is the month which the season started. Probably because of that, all the applications have been changed in the top 10 list.
4.3. Other Categories
Even the result does not appear directly on the highest and lowest values of the KPR and NAR values, there are also some applications need to mention in here. Before October election, voter related applications rise between September and October 2015 rank listed. Also on the summer season (August to September), Arabic-Turkish dictionaries were in the Top 10 lists. There could be relation between Syrian refugees and/or Arabic Tourists. Even though, with the end of summer season, this application has been dropped down from the top 10 application list.
5. CONCLUSION AND FUTURE STUDY
Even by just looking at first five months started to give some idea about relation between the physical world and application market. The Table 1, and Table 2 values show that, the low KPR values are related with high NAR values. Under the KPR GTP value, Sports is identified as lowest value category, and as expected under the NAR value, GTP Sport category has the highest value. For the GTF, under KPR Music and Audio Category has the lowest value. For NAR, the highest value is in Games category which is the second lowest value in KPR GTF. Also Music and Audio category is the third highest value in NAR. For the GTG values, Education has the lowest value under KPR, and the Sport has the highest value in GTG. For the NAR, education is the second highest value in the ranking, and for KPR, sport has fourth lowers value. As can see from the results, only for the KPR GTP lowest is conclusive with the NAR GTP Education.
In spite of these results, to be able inference the result, more detailed studies are required. One of the area could be Syrian migrants and Arabic Tourists inference from the Turkish to Arabic dictionary application. Without more focused studies, this is not easy to show this relation.
http://ijasos.ocerintjournals.org 180 As a future work, field study could be suggested to see relation between physical world stimuluses with the Top rank applications. Therefore, to be able to implement this study, this study could be implemented a year time period. Furthermore, with including Apple App Store top 10 list, this study will be expanded with including second global market leader. Also the effect of prices and customer ratings would be included to see correlation in the KPR and NAR.
6. ACKNOWLEDGEMENT
The preliminary proceeding was presented in INTCESS 2016, with the financial support of Ankara Yildirim Beyazit University BAP department’s BEKP program.
REFERENCE LIST
Crookston, R. K. (2006). A top 10 list of developments and issues impacting crop management and ecology during the past 50 years. Crop Science, 46(5),2253-2262.
Pilar, R.-A., Jorge A. & Calle, C. (2013). The use of current mobile learning applications in EFL. In 13th International Educational Technology Conference (1189-1196). Portugal, Elsevier Science.
Knight, E., Stuckey, M. I., Prapavessis, H.,& Petrella, R. J.(2015). Public health guidelines for physical activity: is there an app for that? A review of android and apple app stores. JMIR Mhealth and Uhealth , (3)2.
Walravens, N. (2015).Mobile city applications for Brussels citizens: Smart City trends, challenges and a reality check.Telematics and Informatics, 32(2),282-299.
Kaur, S. (2013).Pushing frontiers with the first lady of emerging technologies: top ten technology predictions for 2014 and beyond. IETE Technical Review, 30(6), 451-453.
Ghose, A. & Han, S. P. (2014). Estimating demand for mobile applications in the new economy.
Management Science, 60(6),1470-1488.
Han, D. G. (2013). Analysis of user help design style for mobile application - based on top 100 free apps of play store for the first quarter of 2013 in Korea. Journal of Digital Design, 13(4),785-795.
Song, J., Kim, J..& Jones, D. R. (2012). The effects of application discoverability on user benefits in mobile application stores. In 10th Workshop on E-Business (WEB)(pp. 429-441). Shanghai, Peoples Rebuplic China: Springer-Verlag.
Wan, L. (2014). A study of factors affecting mobile application download. Journal of Digital Convergence,12 (7), 189-196.
Statisca 1, 2012 January-2015 July 2015 Global Mobile Operating Systems Statistics, http://www.statista.com/statistics/272698/global-market-share-held-by-taşınabilire-operating-systems-since-2009/.
Statisca 2, 2009 December- 2015 July, Google Application Store total number of applications, http://www.statista.com/statistics/266210/number-of-available-applications-in-the-google-play-store/.