Purdue e-Pubs
Open Access Dissertations Theses and Dissertations
8-2016
A study of security issues of mobile apps in the
android platform using machine learning
approaches
Lei Cen
Purdue University
Follow this and additional works at:https://docs.lib.purdue.edu/open_access_dissertations Part of theComputer Sciences Commons
This document has been made available through Purdue e-Pubs, a service of the Purdue University Libraries. Please contact [email protected] for additional information.
Recommended Citation
Cen, Lei, "A study of security issues of mobile apps in the android platform using machine learning approaches" (2016).Open Access Dissertations. 742.
PURDUE UNIVERSITY GRADUATE SCHOOL Thesis/Dissertation Acceptance This is to certify that the thesis/dissertation prepared
By Entitled
For the degree of
Is approved by the final examining committee:
To the best of my knowledge and as understood by the student in the Thesis/Dissertation Agreement, Publication Delay, and Certification Disclaimer (Graduate School Form 32), this thesis/dissertation adheres to the provisions of Purdue University’s “Policy of Integrity in Research” and the use of copyright material.
Approved by Major Professor(s):
Approved by:
Head of the Departmental Graduate Program Date
Lei Cen
A Study of Security Issues of Mobile Apps in the Android Platform Using Machine Learning Approaches
Doctor of Philosophy Luo Si Chair Ninghui Li Co-chair Elisa Bertino David Gleich Luo Si Sunil Prabhakar 6/24/2016
IN THE ANDROID PLATFORM
USING MACHINE LEARNING APPROACHES
A Dissertation Submitted to the Faculty
of
Purdue University by
Lei Cen
In Partial Fulfillment of the Requirements for the Degree
of
Doctor of Philosophy
August 2016 Purdue University West Lafayette, Indiana
ACKNOWLEDGMENTS
First and foremost I would like to thank my advisor Prof. Luo Si. It has been an honor to be Prof. Si’s Ph.D. student and he has taught me so much during this five years journey. Prof. Si generously founded most of my researches and guided me step by step into so many interesting topics. I appreciate all his time and patient with me and his contributions made my Ph.D. experience much more productive and much less confusing. The profes-sional spirit he showed to me stimulated and encouraged me in my Ph.D. pursuit during my hardest times.
Prof. Ninghui Li provided enormous help and support as my co-advisor in the Android security project, I realy appreciate it as I was new to security field. I would also like to thank Prof. Elisa Bertino and Prof. David Gleich for joining my defence committee and providing valuable comments to help me improve on this dissertation.
Prof. Si provided an excellent lab environment for research and I am grateful to all my lab mates. The members of our IR lab have been a source of solid friendship and reliable source of ideas and collaborations in research. It has been a joyful few year spent with you all. Thank you Dr. Dan Zhang, Dr. Yi Fang, Dr. Dzung Hong, Dr. Suleyman Cetintas, Dr. Qifan Zhang, Ning Zhang, Zhiwei Zhang, Tao Wu, Kexin Pei, Chang Li and Dr. Jingang Wang.
Lastly, I would like to thank my parents for encouraging me for my pursuit and being supportive for the whole time. It would not be possible for me if I was not raised with your love and encouraging.
Lei Cen July 1st, 2016
TABLE OF CONTENTS
Page
LIST OF TABLES . . . vi
LIST OF FIGURES . . . viii
ABSTRACT . . . ix
1 INTRODUCTION . . . 1
1.1 Security Issues of Mobile apps and Machine Learning. . . 1
1.1.1 Direct Analysis . . . 3
1.1.2 Indirect Analysis . . . 4
1.1.3 Comparison and Combination . . . 4
1.2 Research Problems . . . 5
2 A PROBABILISTIC DISCRIMINATIVE MODEL FOR ANDROID MALWARE DETECTION WITH DECOMPILED SOURCE CODE . . . 6
2.1 Motivation . . . 6
2.2 Introduction and Related Works . . . 6
2.2.1 Introduction . . . 6
2.2.2 Related Works . . . 10
2.3 Algorithm . . . 14
2.3.1 Source Code Feature Extraction . . . 14
2.3.2 Probabilistic Discriminative Model for Classification . . . 18
2.4 Experiment. . . 23
2.4.1 Dataset Settings . . . 24
2.4.2 Evaluation Metric . . . 25
2.4.3 Experiments for Granularity of Source Code Features . . . 27
2.4.4 Experiments for Source Code Feature Representation . . . 28
2.4.5 Experiments for Feature Selection on Source Code Feature . . . 29
2.4.6 Experiments for Model Regularization . . . 30
2.4.7 Model Comparison with Permission Feature . . . 31
2.4.8 Model Comparison with Source Code Feature. . . 33
2.4.9 Combination of Source Code and Permission Feature . . . 34
2.5 Limitations . . . 34
2.6 Conclusion . . . 35
3 USER COMMENT ANALYSIS FOR ANDROID APPS AND CSPI DETEC-TION WITH COMMENT EXPANSION . . . 40
Page
3.2 Introduction and Related Work. . . 40
3.2.1 Introduction . . . 40
3.2.2 Related Works . . . 42
3.3 Data Collection and Annotation . . . 43
3.3.1 CSPI Annotation . . . 44
3.4 Algorithm . . . 46
3.4.1 Feature Extraction . . . 46
3.4.2 Independent Logistic Regression (ILR) . . . 47
3.4.3 Comment Expansion. . . 47
3.4.4 Post-Process with Label Correlation . . . 49
3.5 Experiments . . . 50
3.5.1 Experiment Setting . . . 50
3.5.2 Results and Analysis. . . 51
3.6 Limitation & Future Work . . . 53
3.7 Conclusion . . . 53
4 MOBILE APP SECURITY RISK ASSESSMENT: A CROWDSOURCING RANK-ING APPROACH FROM USER COMMENTS . . . 57
4.1 Motivation . . . 57
4.2 Introduction and Related Work. . . 58
4.2.1 Introduction . . . 58 4.2.2 Related Works . . . 60 4.3 Algorithm Overview . . . 61 4.3.1 Problem Formalization . . . 61 4.3.2 Approch Overview. . . 61 4.4 Mathematical formulation . . . 65 4.4.1 Preliminary . . . 65 4.4.2 Proposed PCMC Model . . . 66 4.4.3 Alternating Optimization . . . 67 4.4.4 Discussions . . . 69
4.4.5 Applying the Model to Testing Data . . . 70
4.5 Experiments . . . 71
4.5.1 Datasets . . . 71
4.5.2 Label System . . . 71
4.5.3 Methods in Comparison . . . 72
4.5.4 Evaluation Metrics . . . 72
4.5.5 Results & Discussion . . . 73
4.6 Limitations . . . 76
4.7 Conclusion . . . 77
5 AUTORBF: Automatically Understanding the Review-to-Behavior Fidelity for Android Apps . . . 80
Page
5.2 Introduction and Related Works . . . 80
5.2.1 Introduction . . . 80
5.2.2 Related Works . . . 85
5.3 Problem Statement . . . 87
5.4 Overview of System Design . . . 89
5.5 Review-level Security Behavior Inference Engine (RLI) . . . 91
5.5.1 Training Phase vs. Testing Phase . . . 91
5.5.2 Security-related Feature Extraction and Selection . . . 92
5.5.3 Semantic Expansion . . . 93
5.5.4 Sparse Machine Learning Classifier . . . 95
5.6 App-Level Security Behavior Inference Engine (ALI) . . . 97
5.6.1 Why Not Majority Voting? . . . 98
5.6.2 Crowdsourcing by Giving More Credit to Trustworthy Users . . 99
5.6.3 Determination App-level Behavior viay` i . . . 100
5.7 Experiment. . . 101
5.7.1 Data Collection . . . 101
5.7.2 RQ1: Review-level Security-behavior Inference . . . 103
5.7.3 RQ2: app-level Security Behavior Inference . . . 106
5.8 Behavior Gap between AUTORBF and Code Analysis . . . 108
5.8.1 Spamming . . . 109
5.8.2 Financial Issue . . . 111
5.8.3 Over-claimed Permission . . . 113
5.8.4 Data leakage . . . 114
5.8.5 Summary & Insight . . . 116
5.9 Conclusion . . . 117 6 SUMMARY . . . 121 6.1 Direct Analysis . . . 121 6.2 Indirect Analysis . . . 122 REFERENCES . . . 125 VITA. . . 132
LIST OF TABLES
Table Page
2.1 Feature dimension of three granularities . . . 16
2.2 Terms related in evaluation metrics and an example . . . 25
2.3 Performance of different granularity of source code features inS5 . . . 27
2.4 Descriptions of datasets and experimental settings. The ⇤/2 notation means using part of * at training set, and the other part at testing set. . . 37
2.5 Performance of different regularization inS5 . . . 38
2.6 Verifying the implementation of the models in [1] . . . 38
2.7 Performance comparison using permission features. . . 38
2.8 Performance comparison using source code features (function level) in S5. ACC is for accuracy. . . 38
2.9 Performance of combined source code (function level) and permission features inS5 . . . 39
2.10 Confusion table for late fusion method inS5 . . . 39
3.1 Two dimensional label set . . . 54
3.2 Statistics and sample comment pieces on suspect set . . . 55
3.3 Experiment results on suspect set. †shows the statistical significance based on ILR. It is computed over ten different random splits of the training/testing sets, using one-tailed pair-wise t test with↵= 0.05. . . 56
3.4 Detailed comparison in label level. The†is computed at↵ = 0.05with one-tailed t test among 10 different training/testing set splits. . . 56
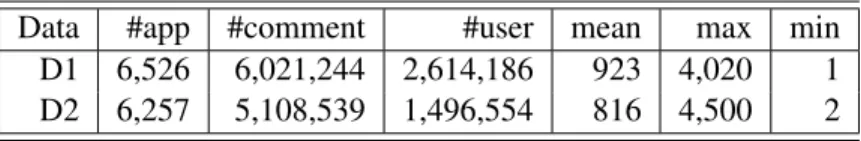
4.1 Datasets details. The Mean, Max and Min are statistics for the number of comments per app. . . 71
4.2 DCG & nDCG comparisons on D1 & D2 datasets. . . 79
Table Page
5.2 LDataset details to validate the review-level security behaviors. The Mean, Max and
Min are statistics for the number of reviews for per app. The mean number of review
per app is small because we already filtered out those review with over3ratings, which
are the majority of them. . . 102
5.3 D Dataset details to validate the app-level security behaviors. The Mean, Max and
Min are statistics for the number of reviews for per app. The max number of reviews
(4,000) is artificial, because our web crawler is set to crawl only the first4000reviews
for each app. . . 103
5.4 Evaluation on different metrics in AUTORBF. # size denotes the number of
positive samples with respect to the label, and ACC denotes accuracy. . . . 118
5.5 Evaluation on different metrics using key-word based approach. # size denotes the
number of positive samples with respect to the label, and ACC denotes accuracy. . 119
5.6 Sampled key-words used in “Key-word based approach”. . . 120
5.7 Performance difference between our approach and key-word based approach. O
LIST OF FIGURES
Figure Page
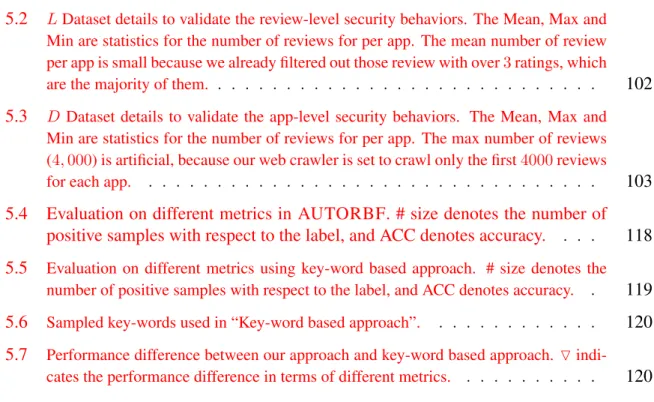
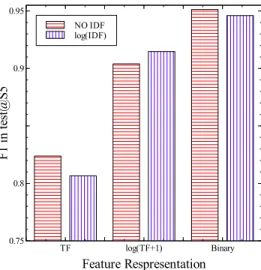
2.1 Performance of source code feature representation inS5 . . . 28
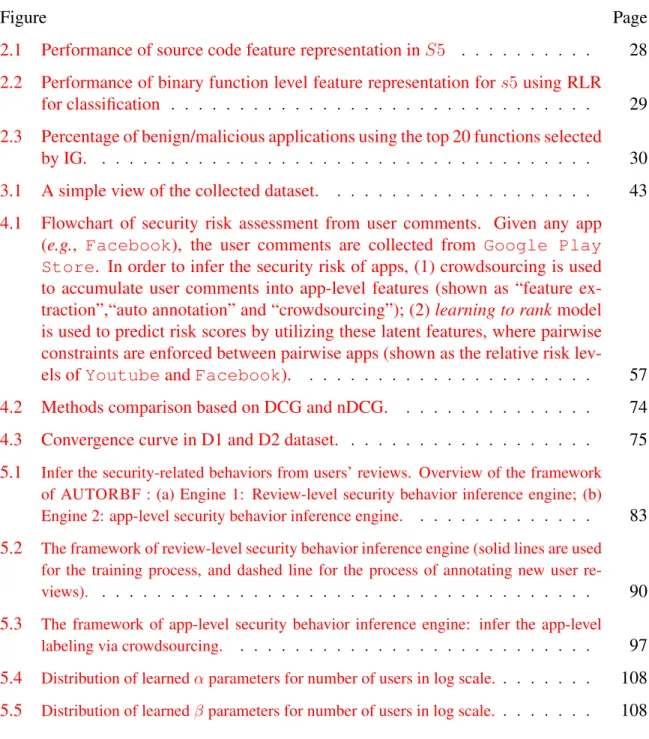
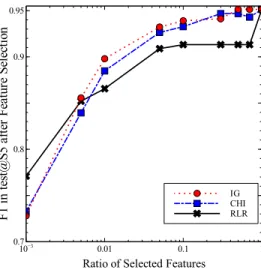
2.2 Performance of binary function level feature representation fors5using RLR
for classification . . . 29
2.3 Percentage of benign/malicious applications using the top 20 functions selected
by IG. . . 30
3.1 A simple view of the collected dataset. . . 43
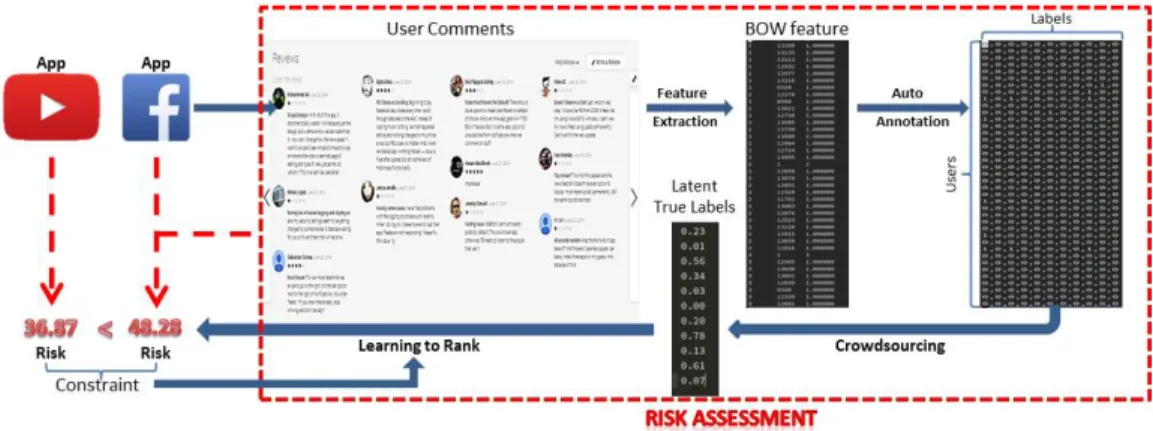
4.1 Flowchart of security risk assessment from user comments. Given any app (e.g., Facebook), the user comments are collected from Google Play Store. In order to infer the security risk of apps, (1) crowdsourcing is used to accumulate user comments into app-level features (shown as “feature
ex-traction”,“auto annotation” and “crowdsourcing”); (2)learning to rankmodel
is used to predict risk scores by utilizing these latent features, where pairwise constraints are enforced between pairwise apps (shown as the relative risk
lev-els ofYoutubeandFacebook). . . 57
4.2 Methods comparison based on DCG and nDCG. . . 74
4.3 Convergence curve in D1 and D2 dataset. . . 75
5.1 Infer the security-related behaviors from users’ reviews. Overview of the framework
of AUTORBF : (a) Engine 1: Review-level security behavior inference engine; (b)
Engine 2: app-level security behavior inference engine. . . 83
5.2 The framework of review-level security behavior inference engine (solid lines are used
for the training process, and dashed line for the process of annotating new user
re-views). . . 90
5.3 The framework of app-level security behavior inference engine: infer the app-level
labeling via crowdsourcing. . . 97
5.4 Distribution of learned↵parameters for number of users in log scale. . . 108
ABSTRACT
Cen, Lei PhD, Purdue University, August 2016. A Study of Security Issues of Mobile Apps in the Android Platform Using Machine Learning Approaches . Major Professors: Luo Si and Ninghui Li.
Mobile app poses both traditional and new potential threats to system security and user privacy. There are malicious apps that may do harm to the system, and there are mis-behaviors of apps, which are reasonable and legal when not abused, yet may lead to real threats otherwise. Moreover, due to the nature of mobile apps, a running app in mobile devices may be only part of the software, and the server side behavior is usually not covered by analysis. Therefore, direct analysis on the app itself may be incomplete and additional sources of information are needed.
In this dissertation, we discuss how we can apply machine learning techniques in mul-tiple tasks for security issues in regard of mobile apps in the Android platform. These include malicious apps detection and security risk estimation of apps. Both direct sources of information from the developer of apps and indirect sources of information from user comments are utilized in these tasks. We also propose comparison of these different sources in the task of security risk estimation to point out the necessity of usage of indirect sources in mobile app security tasks.
1 INTRODUCTION
There has been a steady rise of smart mobile devices for both personal and business use. These devices run applications (apps) that have unprecedented access to private informa-tion, including contacts, emails, geo-location data, personal and business files, and much more. There is also explicit monetary risk associated with these devices since phone calls, messages, and data usage can cost money. More directly, these devices often have access to users’ bank accounts through an application or as a means to authenticate to a bank, and in the future it seems likely that phones may act as a digital wallet, directly accessing the bank accounts as part of the functionality. While the existence of this information and ac-cess creates much of the value found in a smart mobile device, it also makes these devices attractive targets for malicious entities. Furthermore, the threats casted by the mobile App security problem present new properties. On one hand, comparing with traditional software markets, markets like Google Play and Apple Store have lower entry threshold for devel-opers and faster financial payback, hence greatly encouraging more and more develdevel-opers to invest in this thriving business. One result out of this is the huge amount of mobile apps with great diversity. Therefore controlling the quality of apps, especially the security risk of them across the whole markets, becomes an important issue to all that involved. On the other hand, public concerns about privacy issues with on-line activity and mobile phones are also elevating, demanding a mobile environment with more respect to users’ privacy. 1.1 Security Issues of Mobile apps and Machine Learning
We may investigate the problem of mobile App security from two perspectives, in re-garding of its properties compared to traditional security problems.
From the Security issue category perspective:One perspective is that the mobile App security includes both issues which are more common to traditional software security, like
malicious App classification and permission control etc.; and those which are less common like advertise abusing, unresolved In-App-Purchase (IAP) etc. While the former are clear security threats, the later sometimes could only be seen as misbehavior that may lead to real problems like phishing, fraud, privacy issues etc.
Real Threats Malware (malicious App) detection is an typical task in mobile security. Many works have been done for this task, including code analysis (static and dy-namic) permission analysis etc. Please refer to Section 2.2.2 for a more detailed introduction.
Mis-behaviors Some behaviors are commonly discussed by users due to their potential of leading to real threats. Advertising abusing in mobile phone may lead to phishing attack (i.e. from pop-ups), unsolved IAP may be signs of fraud and permission over requesting may lead to privacy information stealing. These behaviors, though could be acceptable in many occasions, do cast potential threats and are worried and com-plained by uses all the time. Therefore, it would be necessary to estimate the security risk of mobile apps in regard of these misbehaviors.
From the source of analysis perspective:As software running in mobile phone, which have much limited computation power and display capability, mobile apps usually consist both the part that runs in mobile phones and the part supporting the functionality via Inter-net. Therefore the analysis of security issues of a mobile App may consider both part of it. However, due to the complication of communication between an App and its service, it would be hard to analyze the outside part directly from the mobile devices. For example, we may be able to detect an transaction of IAP in a game App, but it would be hard to track whether the transaction succeed or not. If not, whether it is just a rare bug in the server side or it is actually a case of fraud. Therefore when we gather source of information for the analysis, it would be reasonable to include source that reflect the experience of App using indirectly.
Direct SourceWe define the direct source of information of a mobile App as those infor-mation released by the developer of the the App. These include the .apk App file, the permission requested and App description etc.
Indirect SourceWe define the source of information of a mobile App as those information that is not from the developer of the App, but from the user of the App. These include mostly the comments made my the users of the App.
Machine learning technique have been introduced into mobile security by many works [1–
3], and it is very adaptive to different kind of task including classification for malware de-tection and ranking / regression for risk estimation. With probabilistic machine leaning model, the result of security analysis may adapt to more flexible interpretation and easier for further analysis and integration. In our work, we mainly adopt probability machine learning technique as our tool for the analysis.
1.1.1 Direct Analysis
Many works have been done to analysis the security issues of mobile apps directly from the information released from the developer.
Code AnalysisCode analysis tries analysis the security issues through analyzing the code of the App. These includes static analysis that extract features from the executables of mobile App, and dynamic analysis that utilize features captured while the App is running.
Permission AnalysisPermission analysis analyze mobile App by evaluating the permis-sion requested and / or used of the App.
Please refer to Section2.2.2for a more detailed introduction for related works. Following this line of work, we propose to conduct a experiment based work that utilized discrimi-nated probabilistic model for detecting malicious mobile apps based on decompiled .apk package and the permissions requested. Experiments demonstrate that our approach may detect malicious mobile App in a over95%manner in the measure of F1 value.
1.1.2 Indirect Analysis
Indirect source of mobile apps comes mostly from user comments submitted to online App store (e.g. Google Play for Android apps). There have not been much indirect analysis of mobile apps for the purpose of security concern. However, user comment analysis have been utilized in many previous works (please refer to Section3.2.2for more detail).
By considering the user comments as an indirect source of information, we propose a novel model for estimating the security risk of mobile apps. There are two steps of these line of work which we separated into two tasks: how to extract relevant security topics from user comments and how to estimate the security risk of apps from the security topics. 1.1.3 Comparison and Combination
Both direct and indirect source are valuable in analyzing security issues for mobile apps, but the different perspectives may rise some interesting question when we compare them. For example, the permission analysis task in many works[] compare the difference of the requested permissions to the ones actually used in the code of the App, and predict security risk by the difference of the two, but from the users’ point of view, the requested permissions are always compared to the role and functionality of the App that the user comprehended. We propose to compare the two perspective by comparing code analysis in multiple security related tasked on mobile apps to user comment analysis on those similar tasks, and identify the strength and weakness of both source.
Moreover, combining both source of direct and indirect provide a promising approach in improving the performance of risk estimation of mobile apps. We propose a multi-view learning approach to incorporate both source in a mobile App security risk estimation task, and expect to show better performance from the combining of source than each individual ones.
1.2 Research Problems
In this dissertation, my main focus is on how to solve the following research problems:
• How can we apply machine learning technique in traditional security problem, like code analysis in malware detection, for Android apps?
• How can we utilize information from non-traditional perspective like the user com-ments in security analysis for Android apps?
• How to compare the usage of code analysis and user comment analysis in mobile App security.
• Can we combine information from both perspective and improve performance in estimation mobile App security risk?
The rest of the dissertation will be organized as follows: Chapter 2presents a experiment based analysis on how to utilize discriminative probabilistic model on decompiled code of mobile App for malware detection. Chapter3presents a novel method for extracting secu-rity related topics from user comments of mobile apps. Furthermore, Chapter4proposes a joint algorithm that estimates both the credibility of users who give comments and the security risk of the apps. Moreover, Chapter 5described our work that compare our user comment based analysis to traditional code analysis based work with case studies. And finally Chapter6will summarize the proposal.
2 A PROBABILISTIC DISCRIMINATIVE MODEL FOR ANDROID MALWARE DETECTION WITH DECOMPILED SOURCE CODE
2.1 Motivation
In this chapter, we demonstrate how we can apply machine learning technique in de-tecting malicious mobile apps. The task fall into the real threats category of security issues and the source of information is the decompile code of apps. Without complicated code analysis, this work treat decompiled code of apps as text document and extract function name from it.
2.2 Introduction and Related Works 2.2.1 Introduction
There has been a steady rise of smart mobile devices for both personal and business use. These devices run applications that have unprecedented access to private information, including contacts, emails, geo-location data, personal and business files, and much more. There is also explicit monetary risk associated with these devices since phone calls, mes-sages, and data usage can cost money. More directly, these devices often have access to users’ bank accounts through an application or as a means to authenticate to a bank, and in the future it seems likely that phones may act as a digital wallet, directly accessing the bank accounts as part of the functionality. While the existence of this information and ac-cess creates much of the value found in a smart mobile device, it also makes these devices attractive targets for malicious entities.
The paradigm for program distribution on these mobile devices also differs from that of the traditional PCs. Many developers are releasing applications to one or a few central application markets. While there are third party application stores, currently all popular
mobile device platforms have central application stores as the primary mechanism of appli-cation distribution. Android has Google Play as the primary store, Kindle uses the Amazon Appstore for Android, iOS has iTunes App Store, Windows RT has the Windows Store, and BlackBerry has AppWorld. This new paradigm presents both challenges and opportunities for malware defense. Instead of most programs coming from a relatively small number of reputable vendors, which enables protection based on whitelisting and signed software distributions, in mobile devices there are many more developers, many of which have in-sufficient history to establish reputation. On the other hand, centralized markets provide opportunities for techniques to analyze applications by extracting some set of measurable features, and identifying potentially malicious applications in the set.
In [1–3], researchers have developed several approaches that use the permissions re-quested by an Android application to identify whether the application is potentially ma-licious. In [2], requesting a certain permission or a certain combination of two or three permissions triggers a warning that the application is risky. In [3], requesting a critical per-mission that is rarely requested is viewed as a signal that the application is risky. In [1], four probabilistic generative models are used to to identify potentially malicious applications in-cluding Basic Naive Bayes (BNB), Naive Bayes with informative Priors (PNB), Mixture of Naive Bayes (MNB), and Hierarchical Mixture of Naive Bayes (HMNB). Experimen-tal results show that these models significantly outperform prior approaches in [2,3] using the Area Under Curve (AUC) for the Receiver Operating Characteristic (ROC) curve as evaluation metric.
However, permissions only provide a high-level and inaccurate view of the behavior of an application. An application may request a permission without actually using the permission [4]. Furthermore, a permission often controls multiple actions. For example, the READ PHONE STATE permission gives access to the devices IMEI via getDeviceId() which can be misused, the current caller is available via getCallerInfo(. . . ) which has pri-vacy implications, but this permission also grants access to more commonly used functions and intents such as the “android.intent.action.PHONE STATE” intent to detect changes in the network connection type and similar changes to phone state. On the other hand, we
observe that applications are generally distributed in a form that can be decompiled into source code which enables more detailed analysis of the applications. In particular, mobile platforms like the Android system provide rich and well-defined APIs with useful semantic values for accessing the underlying rich types of data. If an application needs to access a user’s contact information, it generally needs to achieve this goal via well-defined API calls, which can be captured by the decompiled source code.
Therefore, we expect that using decompiled source code of Android applications can provide more detailed information than the list of permissions that the applications request. We thus hypothesize that properly designed probabilistic models with decompiled applica-tion source code, either in place of or in addiapplica-tion to, permission data, are able to provide highly accurate results in identifying potentially malicious applications.
Generative probabilistic models in [1] assume that some parameterized random process generates the application data (i.e., permissions) and learn model parameters which opti-mize the fit of the model to the applications used in training. Then one can compute the probability of each application being generated by the models, and identify those with low probabilities as potentially malicious applications. The strength of generative models is that they work with unlabeled data, in other words without information on malicious ap-plications. On the other hand, discriminative models have been shown to effectively utilize labeled training data in many applications such as text categorization [5] and image classi-fication [6]. Discriminative models maximize objective functions that reflect classification accuracy with respect to labeled training data. As many malicious Android applications have already been identified in previous work [7], the labeled training information may enable discriminative learning to achieve more accurate results for Android malware de-tection.
We propose a probabilistic discriminative model for Android malware detection as a binary classification problem by using decompiled source code to generate features. In particular, a Regularized Logistic Regression (RLR) model is designed to generate prob-abilistic outputs that enable users to better interpret the probprob-abilistic results of Android
malware detection, which may be more desired than alternative discriminative learning models like support vector machine with non-probabilistic outputs.
One approach is to view decompiled source code as texts, and use techniques for docu-ment classification for Android malware detection. However, source code is different from documents, and this difference presents some interesting new questions. An interesting question is what features to extract from the source code. For example, one can choose to use a word-count representation commonly used in document classification or a binary representation. In addition, one can choose features at different granularity such as the package, class, or function level representation. When classes or functions are used, the number of features may be very large. Feature selection techniques may prove benefi-cial for accuracy and efficiency. Another interesting question is whether combining source code with permissions can present better results than using source code and permissions separately.
There are many options for an evaluation metric. AUC of ROC is a popular choice used by many researchers [1,8]. However, AUC of ROC is reported to be “overly optimistic” of the performance in case of a highly imbalanced dataset [9]. Therefore other metrics like F1 value may be considered as a more reliable metric, since in reality, malicious applications are a very small portion of all the applications, and the precision metric used by F1 can better reflect the performance under imbalanced data.
In summary, the research in this paper makes significant contributions for Android mal-ware detection as follows:
• We propose a probabilistic discriminative model based on regularized logistic
re-gression for Android malware detection with decompiled source code, which can generate much more accurate detection results than previous research with applica-tion permissions or with source code.
• We discuss and present experiments to show that the F1 value is a better metric to
• We provide thorough empirical studies and discussion for exploring desired
represen-tation of decompiled source code such as feature extraction, represenrepresen-tation granular-ity and feature selection and modeling strategies for effective and efficient Android malware detection.
• We further extend the proposed discriminative probabilistic model for utilizing both
decompiled source code and permissions, which generates even better results for Android malware detection. As far as we know, this is the first research work that combines analysis of both source code and permissions for the task.
The rest of the paper is organized as follows. Section 2.2.2reviews related research work in Android malware detection. Section 2.3 proposes our new research for the task. Section2.4presents an extensive set of experiments to demonstrate the advantage of pro-posed research. Section2.6concludes the contribution of this paper.
2.2.2 Related Works
Malware Detection - Static: One issue for malware detection is to determine the right features to extract from executables. One research thrust has focused on binary analysis, looking at the bytes of the binary on disk or in memory. Kolteret al.[10] look atn-grams
from the binary for classification, where ann-gramisnconsecutive bytes. They use these features in conjunction with several machine learning techniques including naive Bayes, decision trees, support vector machines (SVM) and boosting, and obtain reasonable per-formance. BitShred [11] extends the previous idea while focusing on modern malware and scalability, extracting features in several ways to handle encrypted code and using feature hashing to compress the feature space effectively while still maintaining the performance of standard machine learning techniques.
In the context of mobile, some work on static analysis has also been performed, typi-cally focusing on all functions that are used by an application. One common problem in third party application stores is piracy and malware. It is possible to buy an application, repackage the application unchanged or with malicious code added, and then submit it to
a third party application store for others to install. Desnos [12] uses compression and dis-tance on source code to find applications that have high overlap in order to detect piracy and malware between the official market and third party markets. Schmidt et al. [8,13] use static function call analysis to detect mobile malware. They apply their technique to both Symbian and Android to extract function calls from binaries and then perform basic machine learning techniques such as nearest neighbor and clustering. They focus on tradi-tional unix/linux elf binaries; however, most known mobile malware comes in the form of an application, i.e. an.apk file, and not as an elf. Their focus on elf binaries is likely due
to the timing of the work, which precedes most known malware and comes shortly after Android’s initial release.
Enck et al. [14] perform static data flow analysis on application files by decompiling and analyzing the source code to detect data leaks. They find many applications that leak information off the phone, but do not find any evidence of malicious applications in their data. RiskRanker [7] and DroidRanger [15] focus on the task of finding malicious applica-tions in various Android markets. They use a few detection techniques to identify possibly risky behavior in an application, and then perform further analysis to identify true malicious behavior and false positives. The detection techniques look for actions expected from mal-ware: specific code signatures for known attacks, behavioral indicators such as sending an SMS automatically and not associated with a user clicking a button, encrypted native code, and dynamic code loading. These techniques are all basically signature based, looking for pre-specified patterns or behavior. By contrast, our approach is data driven, using labeled data to determine which features are important for classification.
Aaferet al.[16] perform static data flow analysis to extract feature from the bytecode of applications. Both APIs and the parameters of the APIs in the bytecode are extracted and APIs are filtered by the relative usage frequency between benign and malicious applica-tions. K-nearest-neighbor method is proposed to work with these features and compared to permission feature. To distinguish our work with theirs, we propose a probabilistic model that could output meaningful probabilistic results and learns the weight of APIs and per-missions automatically instead of picking the highest relatively frequent ones. We also
present results that combines both API feature and permission feature, which performs the best in our experiments.
Malware Detection - Dynamic: Another major approach focuses on behavioral analysis of malware. In the desktop setting, Christodorescu et al. [17] allow code to execute and monitor system calls in order to identify behavioral traces of a binary. They collect traces for both benign and malicious applications and determine what traces characterize mali-cious binaries in order to identify unknown malware that performs similar functionality. This work uses dependence graphs to construct minimal representations for the malicious behavior, and then looks for these same behaviors in other binaries. Other work has used the same general idea of behavioral analysis, but extended the technique of matching ma-licious code using several machine learning techniques such as support vector machines (SVM) [18] and clustering [19].
For dynamic detection of mobile malware, Shabtaiet al.[20] present a behavioral-based detection framework for Android that monitors certain observable events originating from applications and classifies them via lightweight machine learning techniques. The focus here is relatively efficient behavioral detection since it is performed directly on the device where power may be limited. Portokalidis [21] propose a security solution where security checks are applied on remote security servers that host replicas of the phones in virtual environments. In their work, the servers are not subject to the constraints faced by smart-phones and hence this allows multiple detection techniques to be used simultaneously. They implemented a prototype and show the low data transfer requirements of their application. CrowDroid [22] provides a framework to dynamically analyze applications behavior to detect malware on the Android platform. They collect the system traces from many real users and send them to a central server for analysis to detect behavioral differences between applications that should generally have the same behavior. Their goal is primarily to detect malware that has been repackaged and distributed on third party application stores.
While dynamic approaches can offer the most information regarding application be-havior, it is difficult to explore all possible behaviors of an application ahead of time, and it can be resource intensive to collect directly on a device. Additionally it is difficult to
capture fine grained behavior profiles in Android without rooting a device and installing a system designed to collect this information. On the other hand, since the application store is centralized, an approach which can more directly utilize data from all applications is preferred. Due to the complexity of permission and system level functions, it seems likely that performing static analysis of the API calls can provide a robust feature space, which is the approach we take in this work.
Android Permissions Analysis: PScout [23] performs static code analysis on the Android source to extract function to permission mappings. They find that the Android permission system has little redundancy and it remains relatively stable as the Android OS evolves. They also show how many functions require specific permissions, demonstrating the com-plexity of the system and that a permission may have many reasons for being requested. In [24] Felt et al. conduct a more general survey of applications (free and paid) from the Android Market. One key observation was that93%of free applications and82%of paid
applications request permissions that they deem as “dangerous”. This demonstrates that users are accustomed to installing applications with potentially intrusive or dangerous per-missions requests. This also highlights a need to identify possibly malicious applications and communicate that risk to users. Felt et al. [4] also use static analysis to check if an Android application requests permissions which it is never actually used. They evaluate 940 applications and find that about one-third are over-privileged, showing that it is not always the case that the permissions requested reflect the true underlying functionality of an application. This difference between permission requests and permission use is another reason that we believe source code analysis will benefit the detection task.
Evaluation Metrics: In [25], the relationship between ROC and Precision Recall Curve (PRC) is analyzed, connections and differences between the two curves are illustrated. Fur-thermore, [9] systematically studied the learning process in imbalanced data, and pointed out AUC of ROC is too optimistic with imbalanced data, and PRC can better reflect the performance under the situation of imbalanced data. Therefore F1 score that computed on a proper point of PRC may be a better evaluation metric and is adopted in this paper.
2.3 Algorithm
Our goal is to develop effective techniques that can classify whether an application is likely to be malicious, given its.apk file, which includes both the code of the application
and the list of permissions that the application requests.
In this section, we first describe how to extract features from the .apk files, and then
describe our proposed Probabilistic Discriminative Model. 2.3.1 Source Code Feature Extraction
Android applications are packed as .apk files. To extract features from them, we first decompile the .apk files into Java source code files, and then extract features from the source code.
Decompile
We first unpack.apkfiles to get.dexfiles, and then use thedex2jar1 tool to convert the
.dexfile to.jar file. We then use thejad2 tool to decompile the.class files in a.jar file to
Java source files. For each application, it takes approximately 2-3 minutes to decompile it into Java files. The decompiled Java files misses some information about the names of classes and variables (e.g., in “private static class a”, the name “a” is not meaningful). However, this does not affect our feature extraction because the calls to the Android API are maintained and these are the functions that we care about as they reveal the actual behavior of an application.
Feature Granularities
In the Android platform, most critical operations are carried out by making API calls; thus it is natural to extract API usage information from the source code as features. One
1https://code.google.com/p/dex2jar/ 2http://www.varaneckas.com/jad/
can view the source code as documents, and apply document classification techniques to the problem. In document classification, term frequency (TF) is typically used as features. There are three natural levels of granularity: package, class, and functions in Android for API feature representation. For each level of granularity, we obtain from the source code the TF. For the package-level and class-level features, we scan the import statements to count how many times a package/class is imported. For the function-level, we need to scan all the Java source files to obtain the number of occurrences of each function in one application.
We obtain the lists of package, class and function names from Google Android API document Version 4.2. See Table2.1to see the number of features at different granularities. The rules we use to extract the features are:
1. For the package-level feature, since in the import statements, the substring before the last dot is the name of a package, e.g., “import java.io.File”, “java.io” is a package. We count these substrings to obtain the package-level features.
2. For the class-level feature, we count the whole string after “import” to obtain the class-level features. Notice that, the number of class here is the sum of the number of packages and the number of classes in Google Android API document. The reason is that some applications use the import statements with “*”, e.g., “import java.util.*;”. When we extract the class-level features, in order to deal with this case, we discard the “*” and just consider it as “import java.util”. Because “java.util” is a package, we add the packages into the class-level features. In fact, the class-level features used in this paper contain both the packages and classes.
3. For the function-level feature, we scan the whole Java files to obtain the count of each function. However, some function names are shared by multiple classes, e.g., “toString()”, the method which is used to extract the function-level feature can only get an estimated count of the occurrence of each function, not an accurate count. Be-cause Java is an Object Oriented Programming (OOP) language, functions may be overloaded or inherited by subclasses, the class that one function actually belongs to
can only be determined during the run time. In other words, we can obtain the accu-rate count of the occurrence of each function only by dynamic analysis or advanced software engineering techniques. Therefore, we just use the estimated count in this paper. We discard all constructors listed in Google Android API document.
In general, higher-dimension and finer-grained features provide more information and thus may result in higher accuracy. On the other hand, higher-dimension representation may lead to more sparsity and potentially causes overfitting, and thus requires techniques such as feature selection and/or regularization to avoid overfitting.
Table 2.1.: Feature dimension of three granularities Dimension
package-level 179
class-level 3497
function-level 22136
Source Code Feature Representation
Besides the granularity of the source code features, how the feature values are calcu-lated is also an important issue. We extract the Term Frequency (TF) of the features, indi-cating how many time a feature term (package, class or function) appears in the decompiled source files of an.apk file. Some other choices are listed below:
• Binary: Truncate the TF to either0or1. That is, if TF 1, set it to1. This feature
simply indicates whether a term appears or not. While this is uncommon in document classification, the nature of programming makes this an interesting representation. This is due to the fact that as long as an API function is included once inside one wrapper function, it can be used elsewhere without directly referring to the function name, but instead merely by calling the wrapper.
• log(TF+1): Transform the TF to log scale. It is a common usage for TF in document
• Inverse Document Frequency (IDF):
IDF= #Documents have the term#Documents +1. The intuition is that a term more unique for a document
is more indicative for the document than other more common terms. The+1is used
to avoid division by zero. We applylog(IDF)to the TF, Binary andlog(TF+ 1).
Feature Selection Methods
Feature selection technique is widely used for data preprocessing. The purpose is to find out the most valuable features. The benefit of feature selection is two fold. First, it may improve efficiency. Reduced feature dimensionality results in fewer parameters in the model and less training and testing time. Second, it may improve accuracy. The abandoned features may actually be noisy for the task and may cause over-fitting, hence the performance may be improved after feature selection.
We use Information Gain (IG) and Chi-square test (CHI) for feature selection [26], which can be calculated very efficiently (i.e. , in one pass of source code files). IG mea-sures the mutual dependence of the label and features, while CHI meamea-sures the lack of independence between them, hence both are reasonable choices for feature selection. Both feature selection methods assign scores to all the features, and the features with high scores will be selected. Let{ci}mi=1be the labels formcategories (m = 2for binary classification) andtbe the feature dimension to be evaluated, the score function for IG is:
G(t) = m X i=1 P r(ci)log(P r(ci)) + P r(t) m X i=1 P r(ci|t)log(P r(ci|t)) + P r(¯t) m X i=1 P r(ci|¯t)log(P r(ci|¯t))
And for CHI it is: 2(t, c) = N ⇥(AD CB)2 (A+C)⇥(B+D)⇥(A+B)⇥(C+D) 2 avg(t) = m X i=1 P r(ci) 2(t, ci)
whereN is the size of samples, A is the number of times that t andcco-occur, B is the
number of timestoccurs withoutc,Cis the timescoccurs withoutt,Dis the times neither tnorcoccurs. Then 2
avg(t)is the score function.
2.3.2 Probabilistic Discriminative Model for Classification
As describe previously, the malware detection task is treated as a feature-based clas-sification problem. The malware applications are the “positive” samples, and the benign are the “negative” samples. The purpose of a classifier is to learn a “model” from the training samples to most effectively predict labels for the training data. Then the learned “model” can be applied to a new sample, to predict whether the new sample gets a positive or negative label.
In a classification problem, we use X to denote the input, i.e. , the features from a
sample, andY to denote the output, i.e. the class label. A probabilistic (statistical) model
builds probabilistic relationship between the input features and the class label. In partic-ular, one computes the posterior probability of the output variable Y given the input X,
i.e. ,P r(Y|X). If one constructs models for how the sample (features) is generated by the
class asP r(X|Y), and then apply the Bayes rule to computeP r(Y|X), it is called a
prob-abilistic generative model; if one models theP r(Y|X)directly, it is called a probabilistic
discriminative model.
This section proposes a generative model, the 2-class Naive Bayes with Prior (2-PNB) and a discriminative model, the Regularized Logistic Regression (RLR) to work with source code features for the Android malware detection task. As baselines for
compari-son, we also include some discussions for two other generative models, PNB and HMNB, proposed in [1].
2 Class Naive Bayes with Prior
Naive Bayes (NB) is frequently used as a base line for classification since it performs well and is straight forward to implement and use. NB assumes the independence of the individual features, i.e.
P r(X|Y) = n Y i P r(xi|Y) = n Y i ✓xii,Y(1 ✓i,Y)(1 xi) (2.1)
whereX = [x1, x2,· · · , xn]is the feature vector, and a Bernoulli distribution with pa-rameter✓i,Y is associated with a binary feature value as theith feature in classY. To learn this model, given classY 2 {0,1}, negative training sample X0 = {X0
1, X20,· · · , XN00}
and positive training sample X1 = {X1
1, X21,· · · , XN11}, the Maximum Likelihood
Esti-mation (MLE) of the parameters✓i,Y would be:
ˆ
✓i,Y =
P
X2XY xi NY
With proper prior✓i,Y ⇠Beta(↵i,Y, i,Y), the Maximum A Priori (MAP) becomes:
ˆ
✓i,Y =
P
X2XY xi+↵i,Y NY +↵i,Y + i,Y
The prior can be informative, like PNB in [1], giving different features different impor-tance based on some expert knowledge. Or, it can be uninformative, i.e. using uniform distribution for the prior. For our work with source code features, the uninformative prior is adopted to avoid zero probability in computation.
To predict the label of a new sampleX0, the following probability is computed: P r(Y = 1|X0)
/ P r(X0|Y = 1)P r(Y = 1)
= P r(X0|Y = 1)P r(Y = 1)
P r(X0|Y = 1)P r(Y = 1) +P r(X0|Y = 0)P r(Y = 0)
where P r(X0|Y) is computed as in equation (2.1), and P r(Y) = NY
N0+N1. Then a
threshold may be found in training set forP r(Y = 1|X0)to make the prediction.
This is a common way to use NB as a binary classifier, and will be called 2 class Naive Bayes with Prior (2-PNB) in this paper, to distinguish it from the Naive Bayes with informative Prior (PNB) from [1]. The PNB model only utilizes negative samples to train the model, and predicts a label based on the likelihood of a new sample given the model. The 2-PNB model on the other hand utilizes both negative and positive samples to train the model and predict based on posterior probability of the label given test sample, hence it is expected to have better performance in classification. 2-PNB also works as an intermediate model between PNB and LR, which will be discussed in the next section.
Logistic Regression
Logistic Regression (LR) is a popular classifier as a probabilistic discriminative model. Given a feature vectorX and the class labelY 2{1, 1}, the posterior probability is used
to predict the labelY ofX:
P r(Y|X) = (wTX+b)
where (a) = (1 +exp( a)) 1 is the sigmoid function.wandbare the model parameters that need to be estimated in learning process. Note that the posterior probabilityP r(Y|X)
is directly modeled by the sigmoid function, indicating that LR is a probabilistic discrimi-native model.
Gradient descent can be used in the learning phase of LR to find the MLE of w and b. The objective function would be the likelihood of the training samples. Given training
samples{(X1, y1),(X2, y2),· · · ,(XN, yN)}, the Negative Log Likelihood (NLL) function would be: N LL(X, w, b) = N X i=1 ln(1 +exp yi(wTXi+b))
The L-BFGS quasi-Newton method [27] is applied in this work to find the bestwandb
that minimizes the NLL. The required gradient of NLL is computed as follows:
@N LL @w = N X i=1 ( yi(wTXi+b))Xiyi @N LL @b = N X i=1 ( yi(wTXi+b))yi
One aspect of LR is that the learned wparameter provides a hint about how important
individual features are in the classifier. A high magnitude positive value in w implies
that the corresponding feature is favored by the positive samples, and negative value in
whas the same meaning for negative samples. This is a good property for inspecting the
importance of each feature. For example, if the function level feature is applied, the learned LR model will show which function increase (decrease) the probability of an app being malicious, and to what extend. Therefore even all feature dimensions are treated equally in feature representation, their different importances are learned automatically during the model learning process.
It can be seen that LR directly models the posterior probability for classification as a discriminative model, while the NB related methods focus on input generation probability (i.e. P r(X|Y)) and use Bayes rule to model posterior probability as generative models.
Therefore LR models may have an advantage when modeling posterior probability and achieving better classification performance. In Section 2.4, it will be thoroughly studied and compared to other models mentioned in this section.
Model Regularization
Regularization is usually applied with LR to avoid the overfitting problem. Without it, LR and many other models may “overfit” the training data and perform very well in training but much worse on the test set. Regularization is achieved by adding a penalty term into the objective function to make the trade-off between the optimization of the original objective function (i.e., related with accuracy or loss) and the complexity of the learned model. The objective function of Regularized LR (RLR) looks like this:
minw,b(N LL(w, b) + ·penalty(w, b))
where is a parameter to tune the trade-off of the loss function (NLL) and the penalty term. These parameters are tuned in the training set by cross validation. In our experiments, 5-fold cross validation is adapted. The training set is evenly divided into 5 pieces and each piece of data is rotationally selected as a pseudo testing set with the rest 4 pieces as pseudo training set. With these 5 pairs of sets, a possible range of the parameters are evaluated and the best in average will be used in testing.
Some popular forms of the term include Ridge (|w|2
2, i.e. l2 norm), Lasso (|w|21, i.e.
l1 norm), and Similarity based norm (wTLw) [28]. Ridge norm represents the “natural” distance metric in Euclidean space and the norm and its derivative are easy to compute. When using Lasso, the penalty term will try to force the optimization process to produce a more sparse result of model parameters, which means the resultingwtends to have more
zero values than using Ridge. This is particularly useful when the feature dimension is high and the feature representation is sparse. The similarity based norm utilizes the Laplacian Matrix to embed the similarity between the features into the optimization process. It tries to force the resultingwto assign similar values to those features that are considered similar or
related. When applied to source code features, the co-occurrence matrix is used to compute the Laplacian matrixL, as
A={aij}, aij =
1 +PXxi&xj
where&and|are binary “and” and “or” operator,xiare assumed binary and the+1is used to avoid division by zero. ThenL =D A,Dis a diagonal matrix with its diagonal
ele-mentsDii =PjAi,j. All the three regularization strategies have their advantage, and it is hard to say beforehand which one maybe better on this task. The performance comparison of these strategies will be shown in Section2.4.6.
2.4 Experiment
In this section, a series of experiments will be conducted to explore the desired feature representation and modeling strategies for Android malware detection. Many aspects of the classification process will be investigated in different stages. Each stage of the experiments is actually used to answer one of the following questions:
1. What granularity should be used to extract the features from applications? (Sec-tion2.4.3)
2. How to calculate feature values for better Android malware detection? (Section2.4.4) 3. Can feature selection help? If it does, in which way? Performance or dimension
reduction? (Section2.4.5)
4. Does the model require regularization? If it does, what kind of regularization should we choose? (Section2.4.6)
5. How is the performance of proposed model compared to other learning methods? (Section2.4.7and Section2.4.8)
6. Can the source code features be combined with the permission features to further improve the detection performance? (Section2.4.9)
The default setting for experiments are as following:
model: Regularized Logistic Regression (RLR) with lasso (L1) norm is chosen as the default classifier.
feature: The binary features (no IDF) in granularity of Java Function level are used as features.
Many experiments are conducted to explore one component of the default setting (e.g., granularity in Section2.4.3) by fixing other components.
2.4.1 Dataset Settings
The datasets we use are described in Table 2.4. They are collected from different sources. C11, C12, andCM are used in [1]. C11contains 71331 applications collected
from Google Play in February 2011 andC12contains 98510 applications collected from
Google Play in February 2012. C11 and C12only contain permission and category
in-formation. Applications in them are presumably benign. CM contains 378 malicious
applications, shared from the authors of [29]. We use these datasets to compare directly with results in [1].
O consists of 12,801 presumably benign .apk files from Google Play, which were
ob-tained from authors of [16]. OM consists of 1260 malicious applications, shared by the
authors of [29]. SinceOM is collected later thanCM, CM is a subset of OM. We can
extract source code features forO andOM.
To ensure reliable evaluation, we remove the duplicate applications within each set and the overlap applications between related sets. The reason for this cleaning is to make sure that no developer or application can overly influence the model, which could have implications in testing. Duplicates are removed from the C11 and C12 sets by looking
at developer information and permission vectors, removing all exact matches. Duplicate applications withinO andOM and CM are cleaned by looking at package names which
are obtained from the correspondingmanifest.xmlfiles and permission vectors. The original size and size after cleaning are shown in Table2.4.
In order to make a thorough comparison, we create5training/testing settings by
com-bining the datasets, as shown in Table 2.4. S5 is the only setting where .apk files are
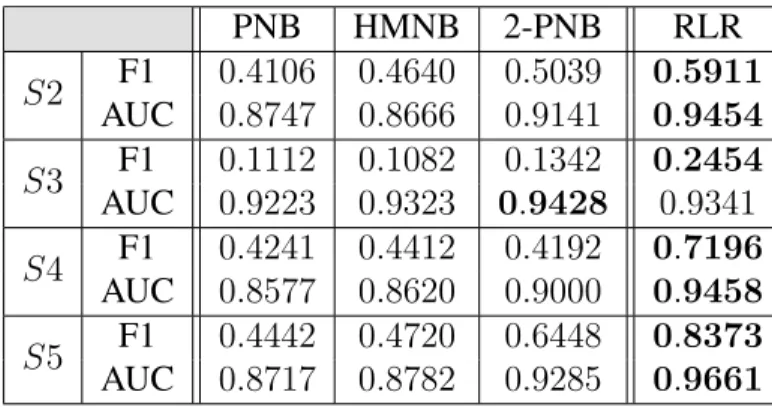
code features. S1toS4are used to evaluate methods using only permission features. S1
is the setting used in [1], so that we can directly compare with the results there. S2, S3
andS4vary the combinations to provide different situations for comparing three generative
models and our discriminative model using permission features.
Table 2.4 also gives the malicious sample ratio (i.e., the ratio of malicious applica-tions to all applicaapplica-tions) in all 5 pairs of training/testing settings. Note that, in some train-ing/testing settings (e.g., S4), the malicious sample ratios of training are different from the ratios in the testing set, which reflect the fact that training data and testing data may not always be consistent in realistic setting for malware detection.
It’s worth noting that the ground truth for those benign apps are assumed benign only because they are from Google Play. The evaluation is set out to test the proposed method for detecting known malicious apps from those in Google Play, instead of finding a new strain of malware. How to apply the proposed method to find malware in Google Play would be an interesting future work.
2.4.2 Evaluation Metric
We consider two evaluation metrics, the F1 score and AUC of ROC score. Given the ground truth information and the prediction/classification results, there are four possible outcomes: true positive (TP), true negative (TN), false positive (FP), and false negative (FN). These are shown in the Table2.2, which also gives an example of the number of each outcomes. For example, TP means an application is malicious with respect to ground truth and it is classified as malicious, and similarly for other terms.
Table 2.2.: Terms related in evaluation metrics and an example Actual class
True False
Predicted Positive TP (95) FP (190)
From these we can compute Precision = TPTP+FP ⇡ 0.33, and Recall = TPTP+FN = 0.95.
Recall is also known as the detection rate or the True Positive Rate (TPR), and gives the percentage of malicious applications detected. Precision is the Bayesian detection rate, and gives the percentage of detected applications actually being malicious. F1 score is the harmonic mean of precision and recall.
F1= 2⇥Precision⇥Recall
Precision+Recall =
2⇥TP
2⇥TP+FN+FP ⇡0.49
When a method has a threshold parameter for classifying whether an application is mali-cious or not, we apply the trained model to the training set, and the selected threshold is the one that maximizes the F1 value in training set.
The AUC score is the area under the ROC (Receiver Operating Characteristic) curve. ROC curve considers two variables: TPR (i.e., the Recall) and False Positive Rate (FPR). TPR stands for the probability that a classifier classifies true samples correctly. The def-inition of FPR is FPR = FPFP+TN. FPR stands for the probability that a classifier classifies
false samples incorrectly. For binary-class classification problem, a threshold is needed to classify the results into two classes: positive or negative. Therefore, for different threshold choices, different FPR-TPR combinations (as well as Precision-Recall combinations) can be calculated. Each combination is a point in the ROC space, linking all the points pro-duces the ROC curve. The larger the AUC score, the better the classifier performs. AUC of ROC is computed w.r.t. a ranked list of the results.
We do not plot the ROC curves in this paper as an evaluation metric. The reason is that many of the ROC curves in our experiments are mixed together to the top-left corner (when the AUC of ROC is over 90%), requiring a zooming in to tell the difference. This is due to the disadvantage of ROC curve in classification task comparing to F1: the ROC curve is too optimistic for imbalanced data.
The physical meaning of AUC of ROC is the probability that a randomly selected posi-tive sample has high score than a randomly selected negaposi-tive sample [30]. This probability may not be so meaningful under the situation of imbalanced data, due to the Base Rate
Table 2.3.: Performance of different granularity of source code features inS5
Granularity F1
Package 0.7984
Class 0.9174
Function 0.9513
Fallacy [31]. When the number of malicious applications is small relative to the total num-ber of applications, it is possible to have high TPR and low FPR (and thus high AUC of ROC), yet low precision (namely, Bayersian detection rate), and thus low F1. The example in Table2.2has TPR= 0.95and FPR= 0.05, but a F1 score of less than0.5.
Accuracy is another metric used by some work [16], it is computed as Accuracy =
T P+T N
T P+T N+F P+F N = 0.95for the example in Table2.2. It is also clearly very optimistic for imbalanced data. Actually, a trivial classifier that always predicts Negative would give an accuracy of0.97already.
2.4.3 Experiments for Granularity of Source Code Features
The experiments in the next subsections are conducted withS5, where the source code
features are available. In this stage of experiments, the granularity of the source code fea-tures are explored. The candidates are Java package level, class level and function level. The numbers dimensions are179,3497, and22136for package, class and function
respec-tively. Table2.3shows the performance of the three granularity levels using binary feature expression. The function level representation outperforms the others. The result indicates that finer level of the source code feature provides better performance, which is consistent with our expectation since a package or class may have various functionality that is not all informative.
2.4.4 Experiments for Source Code Feature Representation
Various types of feature representations introduced in Section 2.3.1are tested in this stage of experiments with function level granularity. In particular, we investigate the usage of term frequency, log term frequency and binary representation. We will also investigate how inverse document frequency affects classification performance.
As shown in the Figure 2.1, the best choice for feature representation is Binary. One reason for this is that the TF representation is not an accurate reflection of how often a func-tion is used in an applicafunc-tion. A funcfunc-tion can appear in source code multiple times but not be used, or it can be present only once but be invoked many times. The actual function use can only be determined at runtime or through advanced code analysis techniques due to the dynamic nature of Object Oriented language like Java. Hence using only binary features, i.e. whether a function is present or not, provides less noise and is more reliable. The same results have also been observed for feature representation with class level granularity. The reason why using IDF gives similar or mixed results may be related to the RLR model that we use. The training process of the RLR model finds a weight vector which indicates the importance of each individual feature, and thus provides similar functionality to IDF.
!"#$% &'()#$%1 % 5 )* +, -+ . / 8 Ssa8 Ssu Ssr Ssr8 %,0+12,3,-42,-,*+0+)'* 5% &'()5%n51 6)*027
!" #$! %&% ' r C () C *+ ,* -. o C /0 *+ 1 C '+ /* 2 1+ C .+ 3+ 4* (5 ) f5. f57 f58 f58o %/*(5C50C.+3+4*+6C'+/*21+, rf7l f5fr f5r r
Figure 2.2.: Performance of binary function level feature representation fors5using RLR
for classification
2.4.5 Experiments for Feature Selection on Source Code Feature
Three feature selection methods are used in this stage to find out whether the feature dimension can be reduced or the performance can be improved. We focus on function level representation, where the original dimension of the feature space is 22,136. IG and
CHI, as introduced in Section2.3.1, are used as two feature selection methods. Moreover, as discussed in 2.3.2, the parameters of RLR model can indicate the importance of the individual features, and thus it is also enlisted to provide feature selection result.
Figure 2.2 shows the performance of the RLR method using0.1% to 100%of the
to-tal features selected by the three methods mentioned above. As shown in the figure, the performance of using10% of features degrades very little compared to using all features
especially for the IG and CHI selection methods. Therefore, if efficiency is an issue in real world applications, a good trade-off between effectiveness and efficiency can be achieved by the feature selection methods.
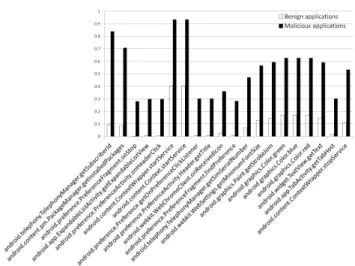
We list the top 20 functions which are selected by IG in Figure 2.3. For each func-tion in the figure, we calculate the percentage of benign and malicious applicafunc-tions which use this function. This information is also shown in Figure 2.3. As shown in the fig-ure, some critical functions, e.g. “getSubscriberId()” and “getInstalledPackages()”, are
Figure 2.3.: Percentage of benign/malicious applications using the top 20 functions selected by IG.
more likely to be used by malicious applications. However, some normal functions like “android.graphics.Color.blue” are also in the list. This could be an coincident due to the dataset property, since the number of malwares is much lesser than the benign ones. Also, normal functions, if their popularities are statistically different in malware from benign ones, are still useful for detecting malware. Moreover, it is worth clarifying that the func-tions shown in Figure 2.3 are far from what are used in detection. In fact, as shown in Figure2.2, we need at least about50%(over11,000functions) of the features to maintain
a similar performance to the best that uses all features. Therefore, in order to fully evaluate the performance of the proposed method, the full sized feature (22,136functions) are used
in the rest of the experiments.
2.4.6 Experiments for Model Regularization
Different regularization methods for the proposed RLR method are explored in this stage of experiments with binary feature presentation in the function level. In particular, we compare the no regularization approach, ridge regularization, lasso regularization and similarity based regularization as introduced in Section2.3.2. Table 2.5 shows the results with the 4 different regularization settings. First, the method without using