Multivariate decoding of brain images using ordinal regression
O.M. Doyle
a,⁎
, J. Ashburner
b, F.O. Zelaya
a, S.C.R. Williams
a, M.A. Mehta
a,1, A.F. Marquand
a,1 aKing's College London, Department of Neuroimaging, Institute of Psychiatry (PO89), De Crespigny Park, London SE5 8AF, UK b
Wellcome Trust Centre for Neuroimaging, 12 Queen Square, London WC1N 3BG, UK
a b s t r a c t
a r t i c l e i n f o
Article history: Accepted 3 May 2013 Available online 17 May 2013 Keywords: Multivariate Ordinal regression Gaussian processes Pharmacological MRI Ketamine Scopolamine
Neuroimaging data are increasingly being used to predict potential outcomes or groupings, such as clinical severity, drug dose response, and transitional illness states. In these examples, the variable (target) we want to predict is ordinal in nature. Conventional classification schemes assume that the targets are nominal and hence ignore their ranked nature, whereas parametric and/or non-parametric regression models enforce a metric notion of distance between classes. Here, we propose a novel, alternative multivariate approach that overcomes these limitations—whole brain probabilistic ordinal regression using a Gaussian process frame-work. We applied this technique to two data sets of pharmacological neuroimaging data from healthy volun-teers. Thefirst study was designed to investigate the effect of ketamine on brain activity and its subsequent modulation with two compounds—lamotrigine and risperidone. The second study investigates the effect of scopolamine on cerebral bloodflow and its modulation using donepezil. We compared ordinal regression to multi-class classification schemes and metric regression. Considering the modulation of ketamine with lamotrigine, we found that ordinal regression significantly outperformed multi-class classification and metric regression in terms of accuracy and mean absolute error. However, for risperidone ordinal regression signif-icantly outperformed metric regression but performed similarly to multi-class classification both in terms of accuracy and mean absolute error. For the scopolamine data set, ordinal regression was found to outperform both multi-class and metric regression techniques considering the regional cerebral bloodflow in the anteri-or cingulate canteri-ortex. Ordinal regression was thus the only method that perfanteri-ormed well in all cases. Our results indicate the potential of an ordinal regression approach for neuroimaging data while providing a fully prob-abilistic framework with elegant approaches for model selection.
© 2013 The Authors. Published by Elsevier Inc.
Introduction
Neuroimaging can be used to investigate a wide range of clinical and research questions including disease processes (Fusar-Poli et al., in press; Jack et al., 2008) and decode both instantaneous cognitive
states (Friston et al., 2008) and pharmacological intervention
(Deakin et al., 2008). Increasingly, multivariate pattern recognition techniques are being applied to neuroimaging data to answer funda-mental questions based around diagnosis/prognosis and decoding. Primarily, this can be achieved by training a learning machine using a subset of the data and their respective targets (e.g. clinical measure or state label) and observing the accuracy of the target assigned to a set of‘unseen’data, which serves to estimate the generalisation
performance of the learner. Most commonly, learning machines are
used to perform binary classification whereby only two labels or
states are considered and the classes are assumed to have a nominal relationship to one another (e.g. patient vs. control or placebo vs. drug). To date, the most popular approach has been the binary sup-port vector machine classifier (Fan et al., 2007; Mourao-Miranda et al., 2012; Pantazatos et al., 2012; Plant et al., 2010).
In order to consider more than two labels, multi-class learning can be employed. To perform multi-class classification a common approach, in thefield of neuroimaging, has been to split the problem up into a series of binary classification problems and then apply combination
strategies such as error correcting codes (Hassabis et al., 2009;
Mourao-Miranda et al., 2006; Schrouff et al., 2012) or“one-versus-all”
(Chu et al., 2011; Zheng et al., 2013). Alternatively, several studies have focused on the use of a single learning machine in order to consid-er all classes in a mutual context.Marquand et al. (2012)applied sparse multinomial logistic regression to pharmacological imaging data in order to discriminate cerebral bloodflow maps collected using arterial spin labelling after placebo, atomoxetine and methylphenidate administration.Filippone et al. (2013)used an inherently multi-class Gaussian process classification approach for neuroimaging data to dis-criminate between different Parkinsonian neurological disorders and ⁎ Corresponding author. Fax: +44 20 3228 2116.
E-mail addresses:[email protected](O.M. Doyle),[email protected] (J. Ashburner),[email protected](F.O. Zelaya),[email protected] (S.C.R. Williams),[email protected](M.A. Mehta),[email protected] (A.F. Marquand).
1
Both authors contributed equally.
1053-8119 © 2013 The Authors. Published by Elsevier Inc. http://dx.doi.org/10.1016/j.neuroimage.2013.05.036
Contents lists available atSciVerse ScienceDirect
NeuroImage
j o u r n a l h o m e p a g e : w w w . e l s e v i e r . c o m / l o c a t e / y n i m g
Open access under CC BY license.
healthy controls.Jenatton et al. (2012)investigated the performance of several sparse methods using both an inherently multi-class likelihood and a“one-versus-all”approach to discriminate the mental representa-tion of different objects. The authors conclude that the best performance was achieved using a multinomial likelihood within their framework.
For many applications of neuroimaging, the class labels can be ordered or ranked, but it can be difficult to exactly quantify the distance between the categories. One example is a disease process continuum where the labels of scans can be ordered as: healthy controls, prodromal and disease state. The most cited example in the neuroimaging litera-ture being the Alzheimer's Disease Neuroimaging Initiative (ADNI) data set which contains neuroimaging and clinical data from partici-pants with Alzheimer's disease, progressive mild cognitive impairment, stable mild cognitive impairment and those who are cognitively normal (Mueller et al., 2005). Similarly, there is a lot of interest in identifying and monitoring individuals at risk of psychosis, who may be in a prodro-mal phase of the disease (Fusar-Poli et al., in press). For example, Borgwardt et al. (in press)analysed structural MRI scans from a psycho-sis continuum (healthy controls–at risk–first-episode psychosis) albeit using binary pairs of classifiers.
In addition to disease trajectories, continuum models are also evi-dent in several other applications of neuroimaging. Increasing complex-ity or difficulty of cognitive tasks can be framed as a continuum; even if the task complexity can be accurately quantified (e.g. linear increase in the number of items to be remembered), the resulting increase in neural processing should not be assumed to follow the same pattern. Similarly, dose response relationships with neuroimaging data repre-sent a continuum where the known dose interval may not match the differences in brain states (Tauscher et al., 2002). This may be particu-larly apparent when a small number of doses are used, or a new mech-anism is being investigated. In all these examples, it would seem desirable to make use of the ordinal relationships between class labels to enable them to be more accurately predicted, compared to binary or multi-class classification approaches which ignore this information.
Here, we pose the question: how can we identify a state that is as-sumed to be intermediate between multiple states? We propose re-formulating this problem using a multivariate ordinal regression framework which inherently models the natural ordering in the data labels and can establish whether a collection of brain regions are ordinally related across a continuum. Crucially, this framework will consider all classes simultaneously and can be tested on a single test case (we do not require a test instance for each class to decode the ranking) in contrast to the only two previous ordinal ranking
ap-proaches for neuroimaging of which we are aware;Fan and ADNI
(2011) decomposed the problem into pairwise classifiers which
were then combined using an ordinal ranking rule whilePedregrosa
et al. (2012)proposed training a single binary classifier to discrimi-nate pairs of data vectors that exhaustively describe all pairs of clas-ses. This method requires that a test case for each class must be available to decode the ranking of the image. We focus in particular on ordinal regression as conventional parametric or non-parametric regression approaches enforce a metric notion or sense of symmetry between labels. Consider the ordinal scale mild, medium and severe. To use a regression approach we may encode these labels as [1, 2, 3]. However, this metric notion assumes that the difference between mild and medium is the same as the difference between medium and severe. Additionally, unlike multi-class classification, which provides a different set of predictive weights for each class the model structure for an ordered class relation typically involves estimating a single set of predictive weights which reflects the ordering of all the classes (Chu and Ghahramani, 2005; Gutiérrez et al., 2012; Mccullagh,
1980). Moreover, performance metrics should be appropriately
cho-sen as for ordinal regression the‘distance’of the error from its true label is of interest. That is, the magnitude of the error on incorrectly classifying mild as severe should be more highly penalised than clas-sifying mild as moderate.
To investigate whether multivariate ordinal regression is a better suited approach for data with ordered targets we utilise two exem-plar pharmacological imaging studies. Thefirst study aims to investi-gate the blood oxygen level-dependent (BOLD) response to ketamine which acts as an N-methyl D-aspartate (NMDA) receptor antagonist and evokes psychotomimetic symptoms resembling schizophrenia in healthy humans (Krystal et al., 1994). Imaging markers of acute ke-tamine challenge have the potential to provide a powerful assay of novel therapies for psychiatric illness. In this data set, the modulation of the BOLD response to ketamine is investigated using two
com-pounds—the anticonvulsant lamotrigine and the antipsychotic
ris-peridone (Doyle et al., 2013). In our earlier paper, we confirmed that both lamotrigine and risperidone attenuate the effects of keta-mine on the BOLD phMRI signal, albeit via different mechanisms of action (Doyle et al., 2013). We thus expect the class labels to be ordi-nal with placebo and ketamine at the extremities and lamotrigine or risperidone as the intermediate class. As this study was carried out to explore the level of attenuation achieved by risperidone and com-pare and replicate the attenuation of ketamine by lamotrigine, a priori we cannot rank lamotrigine and risperidone in a meaningful, princi-pled manner, hence we will apply the algorithms separately. The sec-ond study focuses on the use of scopolamine which has been used for
many years as a pharmacological model of ‘cholinergic amnesia’
gaining popularity due to the cholinergic hypothesis of geriatric memory dysfunction (Bartus et al., 1982), and the reversal of deficits is widely adopted as a tool to test putative cognitive-enhancing drugs. This study utilises arterial spin labelling to investigate the effect of scopolamine (a potent antagonist of the muscarinic acetylcholine re-ceptor) on cerebral bloodflow and its modulation using donepezil, an acetylcholinesterase inhibitor which can provide some improvement in cognitive impairments in cholinergic animal models of Alzheimer's disease as well as patients (Di Santo et al., 2013; Winblad et al., 2001). Considering that scopolamine is a non-selective muscarinic acetyl-choline receptor antagonist whereas donepezil will enhance acetyl- choliner-gic transmission to both nicotinic and muscarinic receptors we do not expect the whole brain response to be ordinal as donepezil will pro-duce specific regional CBF (rCBF) effects distinct from scopolamine. Therefore, we expect donepezil to attenuate scopolamine effects in regions which are rich in muscarinic receptors and have previously shown a response to scopolamine. Hence we use ordinal regression to explore the rCBF in predefined regions of interest (ROIs). Previous neuroimaging studies have shown both increases and decreases in
ce-rebral blood flow following scopolamine administration, although
these effects were not derived from fully quantitative measurements of bloodflow (Grasby et al., 1995; Honer et al., 1988; Prohovnik et al.,
1997). Work in experimental animals has demonstrated reduced CBF
following scopolamine (Ogawa et al., 1994; Tota et al., 2012), which
can be reversed by acetylcholinesterase inhibitors (Ogawa et al.,
1994; Tsukada et al., 1997). Therefore, we expect rCBF to be most reduced following scopolamine administration and we expect rCBF following pre-treatment with donepezil to lie between that of placebo and scopolamine.
In this work, we describe a whole brain probabilistic approach for ordinal regression using Gaussian processes (ORGP) in a Bayesian framework. This framework provides probabilistic predictions for class membership which facilitates the quantification of uncertainty, and an elegant approach for model selection and comparison. The likelihood function of this method specifically captures the ordinal nature of the data using a threshold model which is a generalisation of the probit function as introduced byChu and Ghahramani (2005). We will compare this approach to schemes for multi-class classification and metric regression, in all cases linear learning algorithms will be utilised. Comparisons will be carried out using three data confi
gura-tions: 1) BOLD data ranked increasingly as placebo, lamotrigine–
ketamine and ketamine, 2) BOLD data ranked increasingly as placebo,
decreasingly as placebo, donepezil–scopolamine and scopolamine. Recalling that the intermediate classes feature the compound of in-terest (i.e. ketamine or scopolamine) administered in addition to a
modulatory pre-treatment (i.e. lamotrigine, risperidone or
donepezil), which would be expected to attenuate the effects of the compound of interest.
Materials and methods
ORGPs—ordinal regression using Gaussian processes2
Here, we provide an insight into the mathematical concepts
pro-posed byChu and Ghahramani (2005)which govern this approach
to ordinal regression. We refer the reader toChu and Ghahramani
(2005)for a more detailed description of this method.
Consider atrainingdata set Dof Nobservations, D ¼fðxi;yiÞji¼ 1;…;Ngwhere each sample is a pair consisting of the input data vector
xof dimensionMand corresponding labelyi∈LwhereLis afinite set of
Rordinal categories, denotedL= {1, 2,…R}. The column data vectors for allNcases are aggregated in the data matrixXwith dimensions
N×Mand the targets are collected in vectory.
The main principle here is to assume an unobservable latent function
fð Þxi∈Rassociated with eachxiand assume a Gaussian process prior
overf, wherefis a vector collecting all latent function values. The ordinal variableyiis dependent on the latent functionf(xi) by modelling the
ranks as intervals on the real line (Chu and Ghahramani, 2005). This is achieved using a Bayesian framework. First, a Gaussian process prior
P(f|X,θ) is placed on the latent function. The Gaussian process prior can be fully defined by a mean functionm(x) and a covariance function
k(xi,xj). Here we define the GP as zero mean with a linear covariance
matrix:
K¼XXTþ1=s2
wheres2is a bias term that also controls the scaling of the latent function
which in turn affects the variance of the predictive weights. We refer to this quantity as a hyperparameter, collected in the vectorθ, which will be optimised within this framework.
The joint probability of observing the ordinal variables, i.e. the likelihood is defined as
Pðy fj Þ ¼∏N
i¼1
P yð ijfð Þxi Þ:
Under noise-free conditions, the ideal likelihood function would be defined as
Pidealðyijfð Þxi Þ ¼
1; ifbyi−1bfð Þxi ≤byi 0; otherwise
wherebrepresents a threshold variable. At the extremities these vari-ables serve as limits and are defined asb0=−∞andbR= +∞and the intermediate thresholds are further defined asbj=b1+∑lj= 2Δk
with positive padding variablesΔkwherek= 2,…,R−1. This
formula-tion enforces ordinal constraints by dividing the real line intoR contigu-ous intervals (b1bb2b…bbR−1) which mapf(xi) to the discrete
variableyi. Note that the thresholds are not constrained to be equidistant. A schematic illustration of the shape of the likelihood functions for a three class problem is provided inFig. 1.
Pideal(yi|f(xi)) assumes that the input data are noise-free. To
account for noise, we explicitly assume that the latent functions are contaminated by Gaussian noise with zero mean and unknown vari-anceσ2, denotedNδ;0;σ2whereδis a Gaussian random variable.
The variance term here controls the shape of the likelihood function serving to sharpen or soften the thresholds (seeFig. 1). The ordinal likelihood function becomes
P yijfð Þxi Þ ¼∫Pideal yijfð Þ þxi δÞN δ;0;σ 2 dδ¼Φ zi1 −Φ z i 2 wherezi1¼ byi−fð Þxi σ andzi2¼ byi−1−fð Þxi
σ andΦ(z) is the cumulative unit
Gaussian wherebyΦð Þ ¼z ∫z
−∞Nðφ;0;1Þdφ.
Bayes' theorem can be used to compute the posterior probability, hence enabling predictions to be made.
Bayesian framework
From Bayes' theorem the posterior probability distribution over the latent function can be written as
Pðf yj ;X;θÞ ¼ 1 Pðy Xj ;θÞ ∏
N i¼1
P yð ijfð Þxi ÞPðf Xj ;θÞ
where the prior probability is defined as Pðf Xj ;θÞ ¼
2π ð Þ−N 2 K−12exp −1 2f T K−1f
where K is the covariance matrix
andP(y|X,θ) =∫P(y|f)P(f|X,θ)df, andθis a vector that collects the hyperparameters. To perform inference several model hyper-parametersθmust be set. These include the covariance function param-eter log(s2) (controlling the scale and bias) and the likelihood
parameters {b1, log(Δ2), …,log(ΔR−1), log(σ)}. Note, that each
hyperparameter should be greater than zero except forb1, so to enforce positivity we optimise all other variables in the log domain. The normalisation factorP(y|X,θ) is known as the model evidence and is the metric used to learn the hyperparameters. To approximate the posterior distribution and model evidence we use the Laplace
approxi-mation at the maximum a posteriori (MAP) estimate (Williams and
Barber, 1998). This approach was found to perform similarly to an expectation propagation approach across nine benchmark data sets (Chu and Ghahramani, 2005). Powell's method is used to maximise the evidence and hence, infer the optimal hyperparameters (Powell, 1964). Having set the hyperparameters, we now want to make predic-tions about a test casex*for which the targety*is unknown. Under the Laplace approximation, the predictive distribution for the latent function can be written as a Gaussian N fð Þx ;μ;ξ
2
where the predictive mean and variance can be written as
μ¼k T
K−1^f and ξ2¼k−kT KþΛ^−1
−1
k;
wherek*is the covariance between the test case and the training data,
k
**is the variance of the test case,^f is the MAP estimate of the latent
function,Λ^is a diagonal matrix whoseii-th entry is second derivative of the likelihood function training sampleiwith respect tof(xi).
The predictive distribution over the ordinal targety*is
Pðyjx;X;y;θÞ ¼Φ bffiffiffiffiffiffiffiffiffiffiffiffiffiffiffiffiffiy−μ σ2þξ2 q 0 B @ 1 C A−Φ byffiffiffiffiffiffiffiffiffiffiffiffiffiffiffiffiffi−1−μ σ2þξ2 q 0 B @ 1 C A:
This distribution is used to assign the test case to an ordinal scale using
arg maxr∈RP yð ¼rjx;X;y;θÞ:
Multi-class classification
Here we present two approaches for multi-class classification
using Gaussian processes. Thefirst involves forming pairwise binary classifiers and computing the test label for an unseen test case using error correcting codes while the second is an inherently multi-class 2
A MATLAB implementation of this method is available on request from the corre-sponding author.
approach which considers all classes simultaneously. Both of these approaches have been used to provide a comprehensive comparison of ORGP with multi-class classification.
Pairwise multi-class classification using Gaussian processes (PMCGPs)
This approach involves solving the multi-class classification problem using binary classifiers where all pairs of classes are compared to each other. Given a three class problem we can build three unique pairwise classifiers where each binary classifier votes for either of the two classes it was trained on to produce a 3-bit predicted code. In order to assign a label to a test case, error correcting codes were used whereby each class is assigned a unique codeword and its distance from the predicted code word is computed (Dietterich and Bakiri, 1995). The test case is assigned to the class with the minimum distance from its pre-defined code word. Here, binary classification was implemented using Gaussian
process learning as described byRasmussen and Williams (2006)and
provides probabilistic measures of class membership. Therefore, proba-bilistic code words were used, seeTable 1.
Multi-class classification using Gaussian processes (MCGP)
Gaussian process classification can be extended from the binary case using a multi-class analogue of the logistic function (the response func-tion which maps the values of the latent funcfunc-tion onto [0 1] to produce probabilities)—i.e. the softmax function (Williams and Barber, 1998). Here, we provide a brief summary of the mathematical concepts intro-duced by Williams and Barber for MCGP but refer the reader toWilliams and Barber (1998)andRasmussen and Williams (2006)for a more de-tailed description. In this case, an independent latent function is used to model the probability of each class.
Consider a vector of latent function values at all training pointsN
and for allRclasses
fMC¼ f11;…;f 1 N;f 2 1;…;f 2 N;…;f R 1;…;f R N
wherefMChas lengthRN, i.e. each class has a corresponding set ofN
latent variables. As before, the prior overfMChas the formfMC
eNð0;KÞ:
Assuming that the latent variables for each class are uncorrelated, the
covariance matrixKis a block diagonal in the matricesK1,…,KR. Each
individual matrixKrexpresses the covariance of the latent function for each classrusing an individual covariance hyperparametersr2to control
the variance and bias so that,
Kr¼ XX T
þ1
=s2r:
Letπirdenote the output of the softmax function at training
sam-plei pðyi¼rjf MC i Þ ¼π r i ¼ exp fri ∑R d¼1exp fdi
wherefiMCis a vector of lengthRdescribing the latent function values
across all classes for training samplei. This formulation enforces the constraint∑rR= 1πir= 1.
As in the binary case and for ordinal regression we seek the maximum a posteriori value^fMC of the posteriorP(fMC|y,X,θ) which is achieved
using Newton's method as described in Rasmussen and Williams
(2006). The Laplace approximation is then used to compute the posterior. As in the ordinal regression approach we use Powell's method to optimise the hyperparameters of the covariance function. To compute the predic-tive distribution we apply the softmax function to the approximated pos-terior distribution of the latent function evaluated at the test point. For Fig. 1.Ordinal regression likelihood functions for a problem with three ordinal classes (R= 3) and hence two threshold variables withb1=−6 andb2= 6 and two extremity threshold constantsb0andb3which are set to− ∞and +∞, respectively. The case for the noise parameterσ= 1 appears in boldfaced blue and two additional greyed out func-tions are displayed forσ= 0.01 (approximating the noise-free case) andσ= 2.
Table 1
Probabilistic code words for each class. C1—class 1, C2—class 2 and C3—class 3.‘0’
implies that the output from the binary classifier is expected to be thefirst class listed. Similarly,‘1’implies the second class listed.‘0.5’implies that the classifier is neutral, for example testing an instance from class 3 on the classifier trained on class 1 and class 2.
Binary classifier pairs
C1 × C2 C1 × C3 C2 × C3
C1 0 0 0.5
C2 1 0.5 0
binary classification, class assignment is achieved by thresholding the predictive mean, however, for multi-class classification we need to take the variance of the mean into account, which is computed by a sim-ple Monte Carlo procedure as inRasmussen and Williams (2006).
Metric regression
Metric regression was implemented using ridge regression (RR) which involves linear least square regression with Tikhonov regularisation (Bishop, 2006). Here, RR was implemented using the dual representation, i.e. learning is performed in the dimension of samples rather than features. It is therefore equivalent to the kernel
ridge regression approach described for neuroimaging data byChu
et al. (2011)using the formulation,
α¼XXTþλI−1ðy−yÞ
whereλcontrols the level of regularisation andyis the (scalar) mean across all training labels. To encode the ordinal relationship across the three classes the labels [1 2 3] are used, in keeping with the data labels used for the ORGP approach. Predictions are made using
y¼kTαþy
wherey*are the real-valued predictions. To force the metric
predic-tions to define distinct three-class categories we use a somewhat
ad-hoc approach which involves rounding the predictions to the nearest integer; if this integer is 1 or 2 or 3 then the class label is di-rectly assigned whereas if the integer is 0 it is assigned to class 1 and if the integer is greater than 3 it is assigned to class three. We assessed the effect of the regularisation parameter across a range of values and we found that the accuracy was insensitive to the value of particular setting ofλ, therefore in keeping withChu et al. (2011) we setλto 10e−5.
Multivariate whole brain maps
For the Gaussian process algorithms which consider all classes si-multaneously (i.e. ORGP and MCGP but not PMCGP) multivariate maps were constructed to visualise the spatial pattern driving the
re-gression or classification. For GP learning, this is achieved by
visualising the MAP estimate of the weight vector to provide a spatial representation of the decision boundary. This is analogous to the
weight vector used for mapping SVM discrimination (Marquand et
al., 2010). For both MCGP and ORGP we can extract a vector α, which is analogous to the weight vector in the function-space view of GP learning (Rasmussen and Williams, 2006), wherebyα=K−1f. To our knowledge, this is thefirst paper to introduce discrimina-tive mapping for ordinal regression using Gaussian processes. For ORGP, the maps are constructed by computing the posterior expecta-tionw^ of the weight vector in the weight-space
^
w¼ 1 s2X
T α:
For MCGP, the MAP expectation of the weights can be derived similarly for each class. Since multivariate techniques are sensitive to spatial correlation, and the performance of the classifier is based on the entire pattern rather than individual voxels, inference based on local regions should be avoided when interpreting these maps.
Implementation of pattern recognition techniques
All algorithms were trained in a leave-one-out cross-validated man-ner, whereby data from all but one of the participants were used to
train the model and thefinal (unseen) participant's data were used for testing.
As ordinal regression is used to predict the ordering of unseen data, we will present the results using familiar classification metrics (e.g. accuracy, confusion matrices) but also metrics that are designed to appropriately penalise the errors made when predicting rank (mean absolute error and Kendall's tau).
We use confusion matrices as visualisation tools. For confusion matrices, the rows represent the true class labels and the columns represent the labels predicted by the learning machine. The diagonal
elements represent correctly classified test cases whereas the
off-diagonal elements represent misclassifications. Thus, this matrix represents the performance of the learning machine on a per-class basis and also enables us to visualise the magnitude of the errors, i.e. errors between adjacent classes versus errors in more distal clas-ses. The accuracy is calculated from this matrix by dividing the sum along the diagonal by the sum of all cells. The per class sensitivities
are defined as the number of true positives divided by the sum of
the number of true positives and false negatives. The positive predic-tive value (PPV) the probability of belonging to a particular class given that class membership was assigned by the algorithm. It is cal-culated as the number of true positives divided by the number of true positives and false positives.
Mean absolute error (MAE) is the average deviation of the predict-ed label from the true label whereby MAE¼1
N∑
N
i¼1yi−ð Þyi
j;where
Nis the total number of samples and (y*)iis the predicted label for
samplei. Note, for RR MAE is calculated from the real-valued
predict-ed outputs to capture its behaviour in afine-grained manner. The
rank correlation coefficient between the predicted label and the true label was calculated using Kendall's tau statistic (Kendall, 1938).
In the context of probabilistic models, the theoretically optimal quantity for model comparison is the marginal likelihood, which
pro-vides an optimal trade-off between modelfit and complexity under
the assumptions of the model. However, to compare different models using the marginal likelihood it is necessary to also account for differ-ent numbers of hyperparameters by integrating them out or penalising models with a larger number of parameters. In GP models, the hyperparameters can only be integrated out using Markov chain Monte Carlo methods, which are relatively computationally demand-ing. Therefore, in the present work we adopt an alternative approach to compare the ordinal regression model to the explicitly multi-class
model (MCGP). Specifically, we penalise the marginal likelihood by
the number of parameters to construct both the Akaike information criterion (corrected forfinite sample size) (Akaike, 1974) and the Bayesian information criterion (Schwarz, 1978). Both of these mea-sures are widely used in neuroimaging and assess modelfit while ac-counting for model complexity (in this case, the number of hyperparameters) which is important here as ORGP has an additional hyperparameter relative to MCGP. However, the Bayesian informa-tion criterion penalises complexity more strongly. Note that the MCGP is parameterised using three hyperparameters (one per class). However, the constraint that the class probabilities must sum to one introduces a redundancy such that the likelihood can be
equiv-alently represented using two hyperparameters byfixing the latent
function values for one of the classes (the reference class) to one. Therefore, to be conservative we penalise the MCGP likelihood by two (rather than three) parameters to compute the information criteria although we note that both approaches lead to the same conclusions.
All algorithms were implemented in MATLAB (The MathWorks, Natick, Massachusetts). For ORGP, custom likelihood and inference scripts were written for compatibility with the GPML toolbox (Rasmussen and Nickisch, 2010). MCGP was implemented as
per the PRoNTo toolbox (Schrouff et al., in press). PMCGP was
implemented using customised scripts also from the PRoNTo toolbox.
Significance assessment
Statistical significance was assessed by testing if the accuracies achieved were greater than chance (33%) using permutation test-ing. The class labels were randomly permuted 1000 times and the learning algorithms (ORGP, PMCGP, MCGP and RR) were re-trained using these labels. The number of times the permuted accuracy was greater than the true accuracy was counted and di-vided by the number of permutations to produce a p-value. To as-sess the difference between the accuracy achieved for ORGP versus all other algorithms the permuted difference in accuracies was computed. The number of times the permuted difference was greater than the true difference was divided by the number of permutations to produce a p-value.
Ketamine study
Sixteen healthy male participants (mean age 25.8 years; SD = 5.7; range 20–37) with no previous neurological or psychiatric illness or his-tory of alcohol or drug abuse were recruited and completed four scan-ning sessions. All participants gave written informed consent. The study was approved by Wandsworth Research Ethics Committee (09/ H0803/48). Further details for the participants and experimental proce-dures are available in Doyle et al. (2013). The design is briefly summarised below.
This randomised placebo-controlled, double-blind, partial cross-over design involved screening and four scanning visits. For each scanning visit, participants received: placebo (ascorbic acid) and sa-line infusion, placebo and ketamine infusion, lamotrigine (300 mg) and ketamine infusion and risperidone (2 mg) and ketamine infusion. The oral drugs were administered in identical capsules approximately 3 h prior to ketamine infusion.
Image acquisition
Participants were scanned using a 3.0T General Electric Signa HDx scanner (GE Medical Systems, Milwaukee, WI, USA). A 15-minute eye-open resting-state BOLD phMRI scan was acquired using gradient-echo echo-planar imaging (EPI). 450 image volumes of 38 near-axial slices (3 mm thickness, interslice gap of 0.3 mm) were
ac-quired per session (TE/TR = 30/2000 ms, flip angle (FA) = 75°,
in-plane resolution = 3.3 mm, matrix size = 64 × 64,field of view = 21.1 cm × 21.1 cm). A higher resolution gradient echo scan was also acquired (43 3 mm-thick near-axial slices with 0.3 mm gap, TE/TR = 30/2000 ms, FA = 90°, in-plane resolution = 3.3 mm, matrix size = 128 × 128,field of view = 24 cm × 24 cm).
Image pre-processing and modelling
The data were pre-processed using SPM5 (www.fil.ion.ucl.ac.uk/
spm). This involved slice-timing correction, realignment, co-registration to the high-resolution image, spatial normalisation to the SPM EPI template using parameters derived from non-linear normalisation of the high-resolution image, and spatial smoothing (8 mm FWHM Gaussian kernel). A high-passfilter with a cut-off of 1200 s (twice the post infusion phMRI scan duration) was applied to the data to minimise the influence of very low frequency noise.
First-level modelling was performed in a general linear model
framework as described previously (De Simoni et al., 2013). The
design matrix comprised four regressors: 1) a gamma variate func-tion parameterised to capture the BOLD response to a ketamine infu-sion in an independent cohort (for further details seeDe Simoni et al. (2013)), 2) thefirst component of a singular value decomposition of the six head motion traces, 3) a regressor to capture variations in the shape of the phMRI regressor and 4) a linear drift term. The beta images from the contrast of the gamma variate regressor were used as inputs for the pattern recognition analysis. These images
contained 178,898 in-brain voxels across all 16 subjects. Here, we will apply our algorithms to the data using two configurations:
1. class 1: placebo–saline session, class 2: lamotrigine–ketamine and class 3: placebo–ketamine
2. class 1: placebo–saline session, class 2: risperidone–ketamine and class 3: placebo–ketamine.
For brevity, we will refer to configuration 1 as the lamotrigine case and configuration 2 as the risperidone case. As mentioned in the Introduction, we cannot rank lamotrigine and risperidone in a meaning-ful, principled manner, hence we will apply the algorithms separately.
Scopolamine
15 healthy male volunteers (mean age 24.9 years; SD = 6.6;
range 19–43) participated in a three period Latin-square design
study, and were administered oral placebo and saline (s.c.), placebo and scopolamine (0.2 mg s.c.; SCOP) or donepezil (5 mg p.o.) and scopolamine. The donepezil and placebo were administered in identi-cal capsules. Whole brain rCBF was measured using pulsed-continuous ASL (pCASL). Participants passed a screening period as described for the ketamine study above and the study was approved by the Institute of Psychiatry and South London and Maudsley NHS Trust Research Ethics Committee (06/Q0706/52).
Image acquisition
Subjects rested in the scanner while a single whole brain cerebral
bloodflow map was acquired using a pulsed-continuous ASL
se-quence (Dai et al., 2008). In this technique, arterial blood is labelled using a long (1.5 s) train of Hanning-shaped radio frequency pulses of 500μs duration and 500μs inter-pulse gap. This method labels the longitudinal magnetisation of arterial blood by means of a
flow-driven, adiabatic inversion in the presence of a net magnetic
field gradient of 0.07 G cm−1. After a post-labelling delay of 1.5 s,
the images were acquired with a 3D spiral multi-short readout (TE 4 ms, TR 5500 ms, ETL 64). CBF maps (in standard physiological units (millilitres of blood per 100 g of tissue per minute)) were comput-ed with a spatial resolution of 1 × 1 × 3 mm. Three pairs of taggcomput-ed–
untagged images were collected; which together with two reference volumes forflow quantification, required a total acquisition time of 6:08 min. A high-resolution, anatomical T2-weighted scan was also acquired. This scan was collected with a Fast-Spin echo protocol (echo train length 19, TE/TR of 54.48/4380 ms);field of view 24 cm, 72 near axial slices along the AC–PC axis with 2 mm thickness and zero gap,
were collected. The final in-plane resolution of the image was
1 × 1 mm.
Image pre-processing and region of interest definition
Extra-cerebral signal from the T2 structural scan was removed using the brain extraction tool included in FSL (Smith, 2002) and the skull-stripped T2 image and its corresponding binary mask were co-registered to each pCASL image using SPM5. Then the brain mask derived from the T2 image was applied to each pCASL image and the resulting skull stripped images were then co-registered back to the original T2 image. Finally, the high resolution T2 image was used to compute SPM5 normalisation parameters necessary to warp the image to the T2 MNI template provided with SPM5 and the resulting parameters were applied to the co-registered pCASL images in addition to the T2 image. Following normalisation, each whole-brain pCASL image was spatially smoothed (8 mm isotropic Gaussian kernel). Since, global basal rCBF values are potentially different between partic-ipants, each image was then mean-centred within participants.
To date, the authors are aware of only two studies describing the effect of donepezil pre-treatment on scopolamine in healthy volun-teers, both of which involve cognitive paradigms (Lenz et al., 2012; Snyder et al., 2005). Therefore, we use the literature on scopolamine
administered in healthy volunteers to guide our choice of ROIs (Grasby et al., 1995; Sperling et al., 2002). Following scopolamine administration,Grasby et al. (1995)reported sites of altered rCBF (measured using positron emission tomography) in the occipital cor-tex, thalamus, precuneus and premotor area. In keeping with the work ofGrasby et al. (1995)and studies in the primate (Asai et al., 2009; Yamamoto et al., 2011), we have selected the thalamus and occipital cortex as regions of interest. Additionally, we have selected the anterior cingulate cortex (ACC) which receives intense cholinergic innervation from a collection of cells in the basal forebrain (Mesulam, 1995) and therefore we hypothesized that rCBF in the ACC would be altered by scopolamine and its modulation with donepezil.
Here, we will apply our algorithms to the data using the configuration:
class 1: placebo–saline, class 2: donepezil–scopolamine and
class 3: placebo–scopolamine
For brevity, we will refer this configuration as the donepezil case.
Results
Ordinal regression (ORGP), multi-class classification (PMCGP and MCGP) and metric regression (RR) were applied to brain imaging data to provide predictions of class membership (probabilistic in the case of ORGP and MCGP). We compare the performance of these algorithms across pharmacological imaging data sets for which we expect an ordinal relationship to exist. For the BOLD data we use whole brain data from the placebo and ketamine sessions at the extremities with either lamotrigine or risperidone as the intermediate class. For the ASL data we explore the behaviour in three ROIs across the placebo and scopol-amine session at the extremities with donepezil as the intermediate class.
Ketamine Study
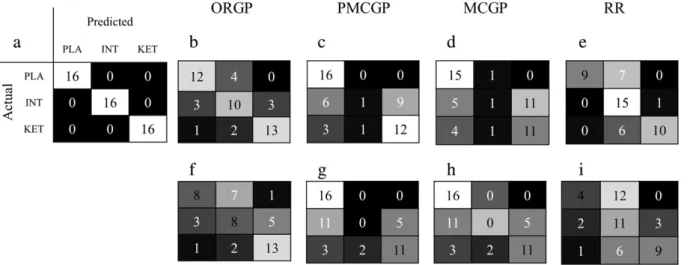
The performance of all techniques is displayed as confusion matrices inFig. 2and the accuracy, mean absolute error (MAE), Kendall's tau, model evidence and information criteria are reported inTable 2(note that the chance level for a three-class problem is 33.3%). For ORGP, con-sidering lamotrigine as the intermediate class resulted in a mean classi-fication accuracy across all three classes of 72.9% with sensitivities (PPV) of 5% (75%), 62.5% (62.5%) and 81.3% (81.3%) for placebo, lamotrigine and ketamine, respectively. InFig. 2, we can see that for the placebo class, four scans were misclassified. However, the errors were confined to the adjacent class—lamotrigine. For ketamine, three scans were misclassified two of which occurred for the adjacent class
with only one assigned to the more distant placebo class. The misclassi-fications for lamotrigine were distributed evenly across the adjacent classes. However, the misclassification errors tended to occur for the classes at the extremities with seven of placebo scans and 6 of the keta-mine scans misclassified. ORGP significantly outperformed all other techniques considering the MAE (p = 0.035, 0.014, 0.04, for PMCGP, MCGP and RR, respectively). Additionally, PMCGP and MCGP but not
RR were significantly less accurate than ORGP (p = 0.03 and p =
0.04, respectively, by permutation test) in discriminating the groups with overall accuracies of 60.4%, 56.3% and 70.8%, respectively. Crucial-ly, for both multi-class approaches only one of the scans belonging to the intermediate class was correctly labelled (Fig. 2). Similarly for RR, the misclassifications were less evenly distributed amongst classes than for ORGP.
Considering risperidone as the intermediate class, the mean ac-curacy across the three classes was 60.4% for ORGP which is similar to the mean accuracy for both multi-class approaches which was 56.3%. Additionally, similar levels of performance were observed
for MAE and Kendall's tau, Table 2. However, the distribution of
the errors across the classes sets the techniques apart: for both multi-class approaches none of the risperidone scans are labelled correctly, seeFig. 2. Unlike the multi-class schemes RR achieved cor-rectly identified 11 out of 16 of the risperidone scans however, the true positive for the placebo class was much reduced with ORGP
found to significantly outperform RR in terms of accuracy and
MAE, (p = 0.04 and p = 0.001, by permutation).
For ORGP and MCGP, the Akaike and Bayesian information criteria were lower for the ordinal regression models in both cases, indicating that these ordinal models were favoured over the multi-class ap-proach. Whole brain maps for the lamotrigine and risperidone cases can be observed inFig. 3. For ORGP, this map visualises the projection of the data along the function space weight vector (α) moving from the placebo state right through the ketamine state. Qualitatively, the maps generated by ORGP for both lamotrigine and risperidone are similar (seeFig. 3). For MCGP, none of the lamotrigine/risperidone classes were correctly classified, so the weight maps for these classes are not meaningful. Therefore, we only present the maps for the pla-cebo and ketamine classes.
Scopolamine study
Here, we focus on two cortical regions (anterior cingulate cortex and occipital lobe) and a sub-cortical region (thalamus). As before,
Fig. 2.Confusion matrices using both lamotrigine (LAM) and risperidone (RIS) as the intermediate class for ORGP, PMCGP, MCGP and RR. The greyscale which is provided for visualisation with bright colouring in the diagonal and dark colouring off-diagonal indicates good performance. (a) Visualisation of the ideal confusion, (b) placebo–lamotrigine–ketamine for ORGP, (c) placebo–lamotrigine–ketamine for PMCGP, (d) placebo–lamotrigine–ketamine for RR, (e) placebo–risperidone–ketamine for ORGP, (f) placebo–risperidone–ketamine for PMCGP, (g) placebo–risperidone–ketamine for MCGP and (h) placebo–risperidone–ketamine for RR.
the performance of all four techniques is displayed using confusion matrices in Figure S1 and using a collection of metrics inTable 3.
For the ACC ORGP was found to significantly outperform all other
techniques in terms of classification accuracy and also MAE. Notably, for the anterior cingulate, ORGP achieves over a 20% increase in classification performance relative to all other approaches. For the thalamus, ORGP outperformed PMCGP in terms of accuracy (p = 0.002) and both PMCGP and RR in terms of MAE (p = 0.007 and p = 0.039, respectively). Conversely, similar performance was observed across all techniques for the occipital lobe. A potential explanation for this result can be observed from Figure S2 which displays the average pCASL signal for each ROI. For both the ACC and thalamus, in a qualita-tive sense, we observe a decreasing rCBF ordinal response from placebo
to scopolamine with increased overlap between classes observed for the ACC. However, the group-level rCBF for the occipital lobe donepezil pre-treatment appears to have reversed the decrease in rCBF resulting in no visually obvious ordinal response.
Discussion
We have presented a multivariate ordinal regression methodology
for neuroimaging data. We have demonstrated the efficacy of this
novel analysis method in the context of two pharmacological imaging studies. Amongst the approaches evaluated, ORGP was the only ap-proach that performed well in all comparisons and produced higher or equivalent accuracy and mean absolute error to the optimal Table 2
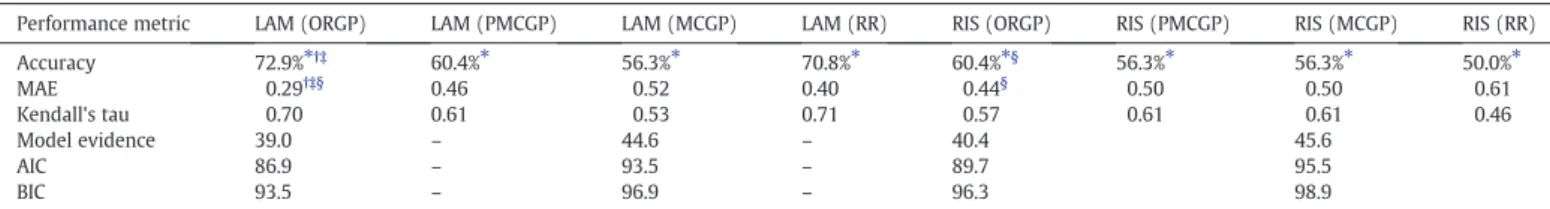
Performance metrics for ordinal regression (ORGP) and pairwise multi-class classification (MCGP), multi-class classification (MCGP) and ridge regression (RR). Model evidence is quantified using the negative marginal log likelihood computed using the entire data set. LAM: lamotrigine, RIS: risperidone, MAE: mean absolute error, AIC: Akaike information criterion, and BIC: Bayesian information criterion.
Performance metric LAM (ORGP) LAM (PMCGP) LAM (MCGP) LAM (RR) RIS (ORGP) RIS (PMCGP) RIS (MCGP) RIS (RR) Accuracy 72.9%⁎†‡ 60.4%⁎ 56.3%⁎ 70.8%⁎ 60.4%⁎§ 56.3%⁎ 56.3%⁎ 50.0%⁎ MAE 0.29†‡§ 0.46 0.52 0.40 0.44§ 0.50 0.50 0.61 Kendall's tau 0.70 0.61 0.53 0.71 0.57 0.61 0.61 0.46 Model evidence 39.0 – 44.6 – 40.4 45.6 AIC 86.9 – 93.5 – 89.7 95.5 BIC 93.5 – 96.9 – 96.3 98.9 ⁎Accuracy > chance (33%) pb0.05. † ORGP outperforms PMCGP pb0.05. ‡ ORGP outperforms MCGP pb0.05. § ORGP outperforms RR pb0.05.
Fig. 3.Multivariate maps extracted from both ORGP and MCGP. For ORGP, a single weight map is produced whereas, for MCGP a weight map can be computed per class. Only weight maps with significant classification accuracy were computed. For visualisation, each map is scaled so that its maximum (absolute) intensity is 1. ORGP:PLK—ordinal regression weight vector for all three classes. ORGP:PRK—ordinal regression weight vector for all three classes considering risperidone as the intermediate class. MCGP:PLALAM—multi-class classification weight vector for the placebo class considering lamotrigine as the intermediate class. MCGP:KETLAM—multi-class classification weight vector for the ketamine class considering lamotrigine as the intermediate class. MCGP:PLARIS—multi-class classification weight vector for the placebo class considering risperidone as the intermediate class. MCGP:KETRIS—multi-class classification weight vector for the ketamine class considering risperidone as the intermediate class.
approach in every comparison. For the ketamine study, multiclass classification, ordinal regression and metric regression were able to classify the ordinal groups with accuracies significantly above chance. The ORGP approach presented here considers all classes simulta-neously in a Bayesian framework affording probabilistic predictions and an elegant approach to model selection. Here, we draw particular comparison with an algorithmically similar multiclass approach: ordinal regression significantly outperformed the inherently multi-class approach for lamotrigine (72.9% vs. 56.3%, p = 0.014) while a similar performance across both techniques was observed for risper-idone (60.4% vs. 56.3%). Crucially, for the intermediate classes, the true positive rates obtained for ORGP were 62.5% and 50% for lamotrigine and risperidone (chance level is 33.3%) but in the case of MCGP they were reduced to 6.3% and 0%, respectively. Moreover, both the Akaike and Bayesian information criteria were lowest for the ordinal regression models having conservatively penalised for the number of hyperparameters. Metric regression (ridge regression) was found to perform similarly to ordinal regression for lamotrigine
whereas for risperidone the accuracy for ORGP was significantly
higher; recalling that for RR the approach to achieve categorical labels is ad-hoc. Additionally, for the scopolamine data set ORGP signifi cant-ly outperformed all other approaches for the anterior cingulate cor-tex. Note, we also implemented Gaussian process regression, however, the method did not perform in a stable manner which we attribute to the highly non-Gaussian nature of the encoded labels (i.e. a high degree of model mis-specification).
While our exemplar analysis is based on psychopharmacological data, many neuroimaging studies involve ordinal scales, for which we cannot explicitly quantify the distance between classes. As men-tioned in theIntroduction, this might include complexity of a cogni-tive task, clinical status, visual analogue scales (subjeccogni-tive states), pain intensity, disease progression/transition and genetic dosage to name some examples. To date, we are aware of only two other neuro-imaging studies that investigate the use of ordinal schemes for their
data.Fan and ADNI (2011)applied an ordinal ranking approach to
the ADNI data set with the hypothesis that an ordinal approach is
more appropriate for the automatic identification of the following
four class labels — healthy controls, mild cognitive impairment
non-converter, mild cognitive impairment converter and Alzheimer's disease. Fan proposed a method that divides the ordinal regression problem into a series of binary‘larger than’classifiers and compared it to a multi-class classifier formulated using one-against-one binary pairs of classifiers. While the overall accuracies for the ordinal and multi-class approaches did not differ, the distribution of the errors was evenly spread across all four classes for the ordinal approach but skewed towards both MCI classes in the case of the multi-class classifier. This trend is similar to the results reported here whereby for some cases the accuracy for the intermediate classes shows a
marked improvement on using an ordinal approach.Pedregosa et al.
(2012) investigated the use of presenting all possible class-wise pairs of images to a binary classifier in order to encode information about the ordinal relationship between the class labels. This approach was investigated using fMRI data acquired while subjects were listen-ing to sentences withfive increasing levels of complexity. The authors conclude that the analysis revealed a non-linear relationship between the BOLD signal response and the level of complexity. However, fur-ther validation is warranted to fully understand the potential of their technique. Moreover, Pedregosa's approach requires that test cases for each possible class be available in order to decode the rank-ing label.
Here, we have presented a novel whole brain approach to ordinal regression that considers all classes simultaneously, which is distinct from previous studies to date (Fan and ADNI, 2011; Pedregosa et al., 2012). The implementation provides an explicit probabilistic model, which is formulated in a Gaussian process framework that provides flexibility in quantifying the pair wise similarity between samples, e.g. linear and non-linear kernels. Kernel methods such as Gaussian process methods are computationally advantageous when the input features exist in a high dimensional space, as is the case for neuroim-aging data, because they enable us to work in dimensions of samples rather than features. While not explored here, kernel methods also provide an elegant method for the combination of multimodal data (Gonen and Alpaydin, 2011). The application of learning algorithms in a neuroimaging context is often an ill-posed problem, as the num-ber of features (voxels) generally greatly outnumnum-bers the numnum-ber of samples (scans). To help alleviate the possibility of overfitting, we have employed algorithms that incorporate regularisation examples which include penalising complexity and reducing the data to a sub-set of relevant features. Achieving an optimal balance betweenfitting the training data and penalising the magnitude of the coefficients is
paramount (Ashburner and Kloppel, 2011). The Bayesian framework
used here provides an elegant solution to regularisation by integrat-ing out the parameters of the model, instead of estimatintegrat-ing only the hyperparameters. Moreover, we have restricted the hypothesis space by choosing a linear classifier.
The multivariate whole brain maps computed for ORGP displayed patterns similar to a placebo vs. ketamine (visual inspection) response, as observed using binary Gaussian process classification (Doyle et al., 2013). Additionally, the MCGP maps extracted for the ketamine class are also highly similar to ORGP maps. This may indicate that a similar set of features are highly weighted in the context of multi-class/binary classification and ordinal regression across the continuum. Therefore, while both techniques weight the same set of features in a similar fashion, ordinal regression affords increased sensitivity over MCGP by explicitly modelling the ranking of the classes as evidenced by its supe-rior performance across a range of metrics—accuracy, mean absolute error and information criteria. One of the data sets employed here in-volves the administration of the compound ketamine, which is known to cause a widespread but selective activation across brain regions (De Simoni et al., 2013). Conversely, for the scopolamine data we anticipat-ed that alteranticipat-ed rCBF and its modulation with donepezil may only occur in areas rich in M2receptors and therefore we chose regions of interest
appropriately. However, when limited prior knowledge is available Table 3
Performance metrics for ordinal regression (ORGP) and pairwise multi-class classifi ca-tion (MCGP), multi-class classification (MCGP) and ridge regression (RR). Model evi-dence is quantified using the negative marginal log likelihood computed using the entire data set. MAE—mean absolute error, AIC: Akaike information criterion, BIC: Bayesian information criterion, and DON: donepezil.
Performance Metric DON (ORGP) DON (PMCGP) DON (MCGP) DON (RR) Anterior cingulate Accuracy 73.3%⁎†‡§ 40.0%⁎ 51.1%⁎ 42.4%⁎ MAE 0.29†‡§ 0.73 0.51 0.69 Kendall's tau 0.70 0.21 0.53 0.32 Model evidence 24.8 – 38.8 – AIC 58.6 – 86.6 – BIC 64.8 – 92.8 –
Occipital lobe Accuracy 64.4%⁎ 64.4%⁎ 60.0%⁎ 64.4%⁎
MAE 0.378 0.40 0.46 0.38 Kendall's tau 0.63 0.59 0.52 0.60 Model evidence 27.7 – 35.9 – AIC 64.4 – 80.8 – BIC 70.6 – 87.0 – Thalamus Accuracy 80.0%⁎† 60.0%⁎ 68.9%⁎ 66.7%⁎ MAE 0.20†§ 0.42 0.31 0.36 Kendall's tau 0.81 0.60 0.72 0.66 Model evidence 20.8 – 29.8 – AIC 50.6 – 68.6 – BIC 56.8 – 74.8 – ⁎ Accuracy > chance (33%) pb0.05. † ORGP outperforms PMCGP pb0.05. ‡ ORGP outperforms MCGP pb0.05. § ORGP outperforms RR pb0.05.
with regard to the spatial distribution of the response we suggest apply-ing ordinal regression locally usapply-ing a searchlight approach (Kriegeskorte et al., 2006) to provide the whole brain accuracy or mean absolute error maps. Given the local nature of their computation, local inference could be applied to these maps to establish where the imaging data is most re-lated to the ordinal target. Another interesting avenue for future work would be to develop an approach to enforce sparsity over the voxel coef-ficients, which may be useful to help localise discriminating brain regions.
In summary, we have presented an application of probabilistic multivariate ordinal regression to neuroimaging data. To rigorously validate this proposal we would need to apply this technique to addi-tional data sets that focus on varied applications such as disease pro-gression and cognitive decoding. However, using pharmacological
imaging data as an exemplar, we have confirmed that in some cases
presented here ordinal regression outperforms multi-class classifi ca-tion schemes as well as metric regression, particularly for the inter-mediate classes. This suggests that the methodology presented here may afford increased sensitivity for a wide range of neuroimaging applications.
Acknowledgments
We thank Gavin Kenny and Sarah Gregory for the collection of the ASL data and Sara De Simoni for the collection of the BOLD data as well as developing and applying the preprocessing pipeline along with Owen O'Daly. We thank the radiographers, research nurse and physicists at the Centre for Neuroimaging Sciences for their assistance during this research. We thank Dr David Alsop for facilitating the pCASL pulse sequence used in this work. Data collection was support-ed by a research grants from the Eli Lilly and Company and the GlaxoSmithKline awarded to MAM, FOZ and SCRW, and we thank Adam Schwarz and Vincenzo Libri for their assistance. Data analysis was supported by the Innovative Medicines Initiative Joint Undertak-ing under Grant Agreement No. 115008 (NEWMEDS). The Innovative Medicines Initiative Joint Undertaking is a public–private partnership between the European Union and the European Federation of Phar-maceutical Industries and Associations. AFM gratefully acknowledges support from the King's College London Centre of Excellence in Med-ical Engineering, funded by the Wellcome Trust and EPSRC under Grant No. WT088641/Z/09/Z. JA gratefully acknowledges the core funding for the Wellcome Trust Centre for Neuroimaging, which is provided by the Wellcome Trust (grant number 091593/Z/10/Z). We also wish to thank the NIHR Biomedical Research Centre for Men-tal Health at the South London and the Maudsley NHS Foundation Trust and Institute of Psychiatry, Kings College London for their on-going support of our translational imaging research programme.
Conflict of interest
MAM is a scientific advisor for Cambridge Cognition. In the past 5 years MAM has consulted for Lundbeck and UCB Pharmaceuticals and SCRW has consulted for UCB Pharmaceuticals. All other authors declare no conflicts of interest.
Appendix A. Supplementary data
Supplementary data to this article can be found online athttp:// dx.doi.org/10.1016/j.neuroimage.2013.05.036.
References
Akaike, H., 1974.Stochastic theory of minimal realization. Vet. Med. Small Anim. Clin. Ac19, 667–674.
Asai, M., Fujikawa, A., Noda, A., Miyoshi, S., Matsuoka, N., Nishimura, S., 2009. Donepezil-and scopolamine-induced rCMRglu changes assessed by PET in conscious rhesus monkeys. Ann. Nucl. Med. 23, 877–882.
Ashburner, J., Kloppel, S., 2011.Multivariate models of inter-subject anatomical vari-ability. NeuroImage 56, 422–439.
Bartus, R.T., Dean, R.L., Beer, B., Lippa, A.S., 1982.The cholinergic hypothesis of geriatric memory dysfunction. Science 217, 408–417.
Bishop, C.M., 2006.Pattern Recognition and Machine Learning. Springer, New York. Borgwardt, S., Koutsouleris, N., Aston, J., Studerus, E., Smieskova, R., Riecher-Rossler, A.,
Meisenzahl, E.M., 2013.Distinguishing prodromal fromfirst-episode psychosis using neuroanatomical single-subject pattern recognition. Schizophr. Bull. (in press) (11 Sept 2013, Electronic publication ahead of print).
Chu, W., Ghahramani, Z., 2005.Gaussian processes for ordinal regression. J. Mach. Learn. Res. 6, 1019–1041.
Chu, C., Mourao-Miranda, J., Chiu, Y.C., Kriegeskorte, N., Tan, G., Ashburner, J., 2011. Uti-lizing temporal information in fMRI decoding: classifier using kernel regression methods. NeuroImage 58, 560–571.
Dai, W.Y., Garcia, D., de Bazelaire, C., Alsop, D.C., 2008.Continuousflow-driven inver-sion for arterial spin labeling using pulsed radio frequency and gradientfields. Magn. Reson. Med. 60, 1488–1497.
De Simoni, S., Schwarz, A.J., O'Daly, O.G., Marquand, A.F., Brittain, C., Gonzales, C., Stephenson, S., Williams, S.C., Mehta, M.A., 2013.Test–retest reliability of the BOLD pharmacological MRI response to ketamine in healthy volunteers. NeuroImage 64, 75–90.
Deakin, J.F., Lees, J., McKie, S., Hallak, J.E., Williams, S.R., Dursun, S.M., 2008.Glutamate and the neural basis of the subjective effects of ketamine: a pharmaco-magnetic resonance imaging study. Arch. Gen. Psychiatry 65, 154–164.
Di Santo, S.G., Prinelli, F., Adorni, F., Caltagirone, C., Musicco, M., 2013.A meta-analysis of the efficacy of donepezil, rivastigmine, galantamine, and memantine in relation to severity of Alzheimer's disease. J. Alzheimer's Dis. 35, 349–361.
Dietterich, T.G., Bakiri, G., 1995.Solving multiclass learning problems via error-correcting output codes. J. Artif. Int. Res. 2, 263–286.
Doyle, O.M., De Simoni, S., Schwarz, A.J., Brittain, C., O'Daly, O.G., Williams, S.C.R., Mehta, M.A., 2013.Quantifying the attenuation of the ketamine phMRI response in humans: a valida-tion using antipsychotic and glutamatergic agents. J. Pharmacol. Exp. Ther. 345 (1), 151–160 (Apr).
Fan, Y., ADNI, 2011.Ordinal ranking for detecting mild cognitive impairment and Alzheimer's disease based on multimodal neuroimages and CSF biomarkers. Pro-ceedings of the First International Conference on Multimodal Brain Image Analysis. Springer-Verlag, Toronto, Canada, pp. 44–51.
Fan, Y., Shen, D.G., Gur, R.C., Gur, R.E., Davatzikos, C., 2007.COMPARE: classification of mor-phological patterns using adaptive regional elements. IEEE Trans. Med. Imaging 26, 93–105.
Filippone, M., Marquand, A.F., Blain, C.R.V., Williams, S.C.R., Mourao-Miranda, J., Girolami, M., 2013.Probabilistic prediction of neurological disorders with a statistical assessment of neuroimaging data modalities. Ann. Appl. Stat. 6 (4), 1883–1905.
Friston, K., Chu, C., Mourao-Miranda, J., Hulme, O., Rees, G., Penny, W., Ashburner, J., 2008.Bayesian decoding of brain images. NeuroImage 39, 181–205.
Fusar-Poli, P., Bechdolf, A., Taylor, M.J., Bonoldi, I., Carpenter, W.T., Yung, A.R., McGuire, P., 2013.At risk for schizophrenic or affective psychoses? A meta-analysis of DSM/ICD di-agnostic outcomes in individuals at high clinical risk. Schizophr. Bull. (in press) (15 May 2013, Electronic publication ahead of print).
Gonen, M., Alpaydin, E., 2011.Multiple kernel learning algorithms. J. Mach. Learn. Res. 12, 2211–2268.
Grasby, P.M., Frith, C.D., Paulesu, E., Friston, K.J., Frackowiak, R.S., Dolan, R.J., 1995.The effect of the muscarinic antagonist scopolamine on regional cerebral bloodflow during the performance of a memory task. Exp. Brain Res. 104, 337–348. Gutiérrez, P.A., Pérez-Ortiz, M., Fernández-Navarro, F., Sánchez-Monedero, J.,
Hervás-Martínez, C., 2012. An experimental study of different ordinal regression methods and measures. In: Corchado, E., Snášel, V., Abraham, A., Woźniak, M., Graña, M., Cho, S.-B. (Eds.), Hybrid Artificial Intelligent Systems. Springer, Berlin Heidelberg, pp. 296–307.
Hassabis, D., Chu, C., Rees, G., Weiskopf, N., Molyneux, P.D., Maguire, E.A., 2009. Decoding neuronal ensembles in the human hippocampus. Curr. Biol. 19, 546–554. Honer, W.G., Prohovnik, I., Smith, G., Lucas, L.R., 1988.Scopolamine reduces frontal
cor-tex perfusion. J. Cereb. Blood Flow Metab. 8, 635–641.
Jack, C.R., Bernstein, M.A., Fox, N.C., Thompson, P., Alexander, G., Harvey, D., Borowski, B., Britson, P.J., Whitwell, J.L., Ward, C., Dale, A.M., Felmlee, J.P., Gunter, J.L., Hill, D.L.G., Killiany, R., Schuff, N., Fox-Bosetti, S., Lin, C., Studholme, C., DeCarli, C.S., Krueger, G., Ward, H.A., Metzger, G.J., Scott, K.T., Mallozzi, R., Blezek, D., Levy, J., Debbins, J.P., Fleisher, A.S., Albert, M., Green, R., Bartzokis, G., Glover, G., Mugler, J., Weiner, M.W., Study, A., 2008.The Alzheimer's disease neuroimaging initiative (ADNI): MRI methods. J. Magn. Reson. Imaging 27, 685–691.
Jenatton, R., Gramfort, A., Michel, V., Obozinski, G., Eger, E., Bach, F., Thirion, B., 2012. Multiscale mining of fMRI data with hierarchical structured sparsity. SIAM J. Imag. Sci. 5, 835–856.
Kendall, M.G., 1938.A new measure of rank correlation. Biometrika 30, 81–93. Kriegeskorte, N., Goebel, R., Bandettini, P., 2006.Information-based functional brain
mapping. Proc. Natl. Acad. Sci. U. S. A. 103, 3863–3868.
Krystal, J.H., Karper, L.P., Seibyl, J.P., Freeman, G.K., Delaney, R., Bremner, J.D., Heninger, G.R., Bowers Jr., M.B., Charney, D.S., 1994.Subanesthetic effects of the noncompetitive NMDA antagonist, ketamine, in humans. Psychotomimetic, perceptual, cognitive, and neuroendocrine responses. Arch. Gen. Psychiatry 51, 199–214.
Lenz, R.A., Baker, J.D., Locke, C., Rueter, L.E., Mohler, E.G., Wesnes, K., Abi-Saab, W., Saltarelli, M.D., 2012.The scopolamine model as a pharmacodynamic marker in early drug development. Psychopharmacology (Berl) 220, 97–107.
Marquand, A., Howard, M., Brammer, M., Chu, C., Coen, S., Mourao-Miranda, J., 2010. Quantitative prediction of subjective pain intensity from whole-brain fMRI data using Gaussian processes. NeuroImage 49, 2178–2189.
Marquand, A.F., O'Daly, O.G., De Simoni, S., Alsop, D.C., Maguire, R.P., Williams, S.C.R., Zelaya, F.O., Mehta, M.A., 2012. Dissociable effects of methylphenidate, atomoxetine and placebo on regional cerebral bloodflow in healthy volunteers at rest: a multi-class pattern recognition approach. NeuroImage 60, 1015–1024. Mccullagh, P., 1980.Regression-models for ordinal data. J. R. Stat. Soc. Ser. B Methodol.
42, 109–142.
Mesulam, M.M., 1995.Cholinergic pathways and the ascending reticular activating sys-tem of the human brain. Ann. N. Y. Acad. Sci. 757, 169–179.
Mourao-Miranda, J., Reynaud, E., McGlone, F., Calvert, G., Brammer, M., 2006.The im-pact of temporal compression and space selection on SVM analysis of single-subject and multi-single-subject fMRI data. NeuroImage 33, 1055–1065.
Mourao-Miranda, J., Reinders, A.A.T.S., Rocha-Rego, V., Lappin, J., Rondina, J., Morgan, C., Morgan, K.D., Fearon, P., Jones, P.B., Doody, G.A., Murray, R.M., Kapur, S., Dazzan, P., 2012.Individualized prediction of illness course at thefirst psychotic episode: a support vector machine MRI study. Psychol. Med. 42, 1037–1047. Mueller, S.G., Weiner, M.W., Thal, L.J., Petersen, R.C., Jack, C.R., Jagust, W., Trojanowski, J.Q.,
Toga, A.W., Beckett, L., 2005.Ways toward an early diagnosis in Alzheimer's disease: the Alzheimer's Disease Neuroimaging Initiative (ADNI). Alzheimers Dement. 1, 55–66. Ogawa, M., Magata, Y., Ouchi, Y., Fukuyama, H., Yamauchi, H., Kimura, J., Yonekura, Y., Konishi, J., 1994.Scopolamine abolishes cerebral bloodflow response to somato-sensory stimulation in anesthetized cats: PET study. Brain Res. 650, 249–252. Pantazatos, S.P., Talati, A., Pavlidis, P., Hirsch, J., 2012.Decoding unattended fearful faces with
whole-brain correlations: an approach to identify condition-dependent large-scale func-tional connectivity. PLoS Comput. Biol. 8.
Pedregosa, F., Cauvet, E., Varoquaux, G., Pallier, C., Thirion, B., Gramfort, A., 2012. Im-proved brain pattern recovery through ranking approaches. Pattern Recognition in NeuroImaging (PRNI), 2012 International Workshop on, pp. 9–12.
Plant, C., Teipel, S.J., Oswald, A., Bohm, C., Meindl, T., Mourao-Miranda, J., Bokde, A.W., Hampel, H., Ewers, M., 2010.Automated detection of brain atrophy patterns based on MRI for the prediction of Alzheimer's disease. NeuroImage 50, 162–174. Powell, M.J.D., 1964.Efficient method forfinding minimum of function of
several-variables without calculating derivatives. Comput. J. 7, 155–162.
Prohovnik, I., Arnold, S.E., Smith, G., Lucas, L.R., 1997.Physostigmine reversal of scopolamine-induced hypofrontality. J. Cereb. Blood Flow Metab. 17, 220–228. Rasmussen, C.E., Nickisch, H., 2010.Gaussian Processes for Machine Learning (GPML)
toolbox. J. Mach. Learn. Res. 11, 3011–3015.
Rasmussen, C.E., Williams, C.K.I., 2006.Gaussian Processes for Machine Learning. MIT Press, Cambridge, Mass.
Schrouff, J., Kusse, C., Wehenkel, L., Maquet, P., Phillips, C., 2012.Decoding semi-constrained brain activity from fMRI using support vector machines and Gaussian processes. PLoS One 7.
Schrouff, J., Rosa, M.J., Rondina, J., Marquand, A.F., Carlton, C., Ashburner, J., Phillips, C., Richardi, J., Mourao-Miranda, J., 2013.PRoNTo: pattern recognition for neuroimaging toolbox. Neuroinformatics (in press) (Feb 16, Electronic publication ahead of print). Schwarz, G., 1978.Estimating dimension of a model. Ann. Stat. 6, 461–464. Smith, S.M., 2002.Fast robust automated brain extraction. Hum. Brain Mapp. 17, 143–155. Snyder, P.J., Bednar, M.M., Cromer, J.R., Maruff, P., 2005.Reversal of scopolamine-induced deficits with a single dose of donepezil, an acetylcholinesterase inhibitor. Alzheimers Dement. 1, 126–135.
Sperling, R., Greve, D., Dale, A., Killiany, R., Holmes, J., Rosas, H.D., Lake, S., Lange, N., Routledge, C., Albert, M., 2002.Functional MRI detection of pharmacologically induced memory impairment (vol 99, pg 455, 2002). Proc. Natl. Acad. Sci. U. S. A. 99, 455–460.
Tauscher, J., Jones, C., Remington, G., Zipursky, R.B., Kapur, S., 2002.Significant dissoci-ation of brain and plasma kinetics with antipsychotics. Mol. Psychiatry 7, 317–321. Tota, S., Hanif, K., Kamat, P.K., Najmi, A.K., Nath, C., 2012.Role of central angiotensin re-ceptors in scopolamine-induced impairment in memory, cerebral bloodflow, and cholinergic function. Psychopharmacology (Berl) 222, 185–202.
Tsukada, H., Kakiuchi, T., Ando, I., Ouchi, Y., 1997.Functional activation of cerebral blood flow abolished by scopolamine is reversed by cognitive enhancers associated with cho-linesterase inhibition: a positron emission tomography study in unanesthetized mon-keys. J. Pharmacol. Exp. Ther. 281, 1408–1414.
Williams, C.K.I., Barber, D., 1998.Bayesian classification with Gaussian processes. IEEE Trans. Pattern Anal. Mach. Intell. 20, 1342–1351.
Winblad, B., Engedal, K., Soininen, H., Verhey, F., Waldemar, G., Wimo, A., Wetterholm, A.L., Zhang, R., Haglund, A., Subbiah, P., Grp, D.N.S., 2001.A 1-year, randomized, placebo-controlled study of donepezil in patients with mild to moderate AD. Neurology 57, 489–495.
Yamamoto, S., Nishiyama, S., Kawamata, M., Ohba, H., Wakuda, T., Takei, N., Tsukada, H., Domino, E.F., 2011.Muscarinic receptor occupancy and cognitive impairment: a PET study with [C-11](+)3-MPB and scopolamine in conscious monkeys. Neuropsychopharmacology 36, 1455–1465.
Zheng, W., Ackley, E.S., Martinez-Ramon, M., Posse, S., 2013.Spatially aggregated multiclass pattern classification in functional MRI using optimally selected func-tional brain areas. Magn. Reson. Imaging 31, 247–261.