MONITORING BLUE-GREEN
ALGAE IN THE IJSSELMEER
USING REMOTE SENSING AND
IN-SITU MEASUREMENTS
MARY CHAWIRA
February, 2012
SUPERVISORS:
Dr. Ir. Mhd. Suhyb Salama Dr. Ir Rogier van der Velde
Thesis submitted to the Faculty of Geo-Information Science and Earth Observation of the University of Twente in partial fulfilment of the
requirements for the degree of Master of Science in Geo-information Science and Earth Observation.
Specialization: Water Resources and Environmental Management
SUPERVISORS:
Dr Ir. Mhd. Suhyb Salama Dr. Ir Rogier van der Velde THESIS ASSESSMENT BOARD: Prof., Dr. Ir. W. Verhoef (Chair)
Dr. H. J. van der Woerd; Institute for Environmental Studies, University of Amsterdam, The Netherlands (External Examiner)
MONITORING BLUE-GREEN
ALGAE IN THE IJSSELMEER
USING REMOTE SENSING AND
IN-SITU MEASUREMENTS
MARY CHAWIRA
DISCLAIMER
This document describes work undertaken as part of a programme of study at the Faculty of Geo-Information Science and Earth Observation of the University of Twente. All views and opinions expressed therein remain the sole responsibility of the author, and do not necessarily represent those of the Faculty.
Remote sensing and in-situ measurements are of paramount importance for providing information on the state of water quality in turbid inland water bodies. The formation and growth of cyanobacteria is of serious concern to inland aquatic life forms and human life. The main cause of water quality deterioration stems from anthropogenic induced eutrophication. The goal of this study was to quantify and determine the spatial distribution of cyanobacteria concentrations in IJsselmeer in the Netherlands using remote sensing techniques. In this study we developed an algorithm to derive phycocyanin intensity index as a proxy for estimating cyanobacteria concentrations. The development of the index was based on the reflectance difference between MERIS band 620 nm and 665 nm. Semi-empirical band ratio model was applied in MEdium Resolution Imaging Spectrometer (MERIS) images for the derivation of phycocyanin pigment concentration and distribution maps. The semi-empirical band ratio model used on MERIS bands centered at 620, 665, 709, and 778.75 nm to derive the absorption coefficients of phycocyanin, chlorophyll_a and phycocyanin pigment concentrations. Atmospheric correction was performed first by removing adjacency effects with ICOL processor model followed by Case 2 water regional processor (C2R) model in BEAM VISAT software. In-situ Spectroradiometric reflectance was matched with MERIS reflectance and a stronger correlation was obtained for 28 September MERIS scene with R2 >0.89 for the six sampled locations. Two in-situ datasets were used to validate MERIS derived phycocyanin concentrations and these were WISP-3 Spectroradiometric, from a field campaign and averaged real-time phycocyanin fluorescence from two geographic locations in the lake. The first dataset gave a good correlation with R2 = 0.73 and MAE 4.67 mg/m3 whilst fluorescence gave a much strong linear correlation with R2 = 0.92 and 0.91 respectively for the two points. Phycocyanin absorption coefficient derived from the semi-empirical band ratio model correlated well with both predicted and measured phycocyanin concentrations with R2 = 0.983 and 0.71 respectively. Generally, the index represented well the cyanobacteria populations. It correlated well with 28 September derived concentration with R2 = 0.903. But a weaker relationship was observed for example image of 18 April R2 was 0.48. Nevertheless, the combined 14 MERIS scenes from March to September provided a good correlation R2 = 0.55 and RMSE= 7.61mg/m3 regardless the fact that in some images the index could not perform well as a result of chl_a concentrations that under estimated PC concentrations. The developed index was found to be a useful tool for monitoring cyanobacteria bloom. In addition, this study found that Lake IJsselmeer had cyanobacteria concentration above “high level” category set by WHOM for recreational water bodies. Daily, Monthly and seasonal variations cyanobacteria blooms investigations indicated that the PC pigment was dynamic in the lake. The spatial distribution seemed to be controlled by a number of factors which included wind, temperature and nutrient levels.
Key words: remote sensing, cyanobacteria blooms, phycocyanin intensity index, Chlorophyll_a and seasonal variability.
I am truly and deeply indebted to my supervisors who contributed to this dissertation in various ways. First, my sincere appreciation goes to my primary supervisor Dr Suhyb Salama for his support and guidance he showed me throughout my dissertation writing. With his eagerness, his encouragement, and his great efforts to explain things clearly and simply, he helped to trouble shoot physics in remote sensing of water quality domain. Throughout my thesis-writing period, he provided support, sound advice, and lots of good ideas that framed my thesis. Honestly, would have been lost without him. It was a great pleasure to work with him.
Secondly, my deepest sincere and gratitude goes to my second supervisor Dr Rogier van der Velde for his motivation and encouragement. He granted me vast knowledge that shaped my work. Rogier is a warm hearted and awesome person to work with. He offered advice and insight throughout this challenging period.
I owe sincere and earnest thankfulness to Water Insight organization for making my research a success by providing WISP-3 spectrometer for field measurements. My special thanks go to Dr Steef Peters from Water Insight for his unwavering support in providing and developing my research skills, rich knowledge in optical water quality and advice throughout my thesis work. I would also want to thank you for enabling me to use your offices for two weeks, and providing me with MERIS images. It is an honor for me to express my gratitude to Dr Marnix Laannen from Water Insight for all the logistics he put in place arranging ferry boats for field measurements and transport to Lake IJsselmeer. Your support made this thesis a success, you did not restrict me in your offices during my time at Water Insight and I am heartily thankful. In my daily work at Water Insight I have been blessed with a friendly and cheerful Lady Semhar Ghebrehiwot Ghezehegn. Without your help and patience it was going to be difficult to complete this study. I appreciate the help you offered me on how to deploy WISP-3. Your assistance and support from the initial to the final period enabled me to develop an understanding of the subject.
I would like to show my gratitude to Rijks Waterstaat of the IJsselmeer for providing the Fluorescence data. The data added a lot of value to my work!
My deepest gratitude goes to European Space Agency (ESA) who provided MERIS images to make this research complete. The contribution you made to this research is greatly appreciated.
Many thanks go to ITC staff members from Water Resources and Environmental Management department for facilitating with best environment and knowledge to successfully complete my studies. I know that this research would not have been possible without the financial assistance from Netherlands Fellowship programme (NUFFIC). I greatly appreciate for granting me the opportunity. I would also like to thank my family members for the support they provided me through my entire period at University of Twente (ITC) in The Netherlands and most importantly, I must acknowledge my dad, mom, my sister Fungai and children Karen and Apollonia for their encouragement. Your prayers were thunderous otherwise I would have fallen especially after the loss of my husband Joe, you stood by my side.
Lastly, I offer my honors and blessings to Zimbabwe Environmental Law Association Staff for all the support they offered which contributed to further my education at ITC and all of those who supported me in any respect during the entire period.
1. INTRODUCTION ... 1 1.1. Background ...1 1.2. Research Problem ...3 1.3. Research Objectives ...4 1.3.1. Specific Objectives ... 4 1.3.2. Tasks ... 4 1.3.3. Research Questions ... 4 1.4. Research outline ...4 2. LITERATURE REVIEW ... 5
2.1. Eutrophication In Lake IJsselmeer ...5
2.2. Cyanobacteria Adaptations ...5
2.3. Cyanobacteria Seasonal Variability ...6
2.4. Temporal and Spatial variability of Cyanobacteria ...6
2.5. Recreational Water Quality indices ...7
2.6. Remote Sensing of Cyanobacteria blooms ...7
2.6.1. Relationship between Spectral Reflectance and Inherent Optical Properties ... 8
2.7. MERIS Sensor Characteristics and Water Quality Applications ...9
3. STUDY AREA AND MATERIAL USED ... 10
3.1. The Geography of the Study Area ... 10
3.2. Climate ... 11
3.2.1. Soils ... 11
3.2.2. Economic significance of Lake IJsselmeer ... 11
3.3. Field Measurements ... 11
3.3.1. Datasets ... 11
3.3.2 Field Sampling and Data Collection... 11
3.3.3 General Description ... 12
3.4 In-situ Measurements ... 12
3.4.1 Measurements Performed within this Study ... 12
3.4.2 Real –time Measurents Data Collected by the Rijwaterstaat in the IJsselmeer ... 14
3.4.3 Data Processing ... 15
3.5 Satellite Data ... 15
3.4. In-situ and MERIS Data Match-up ... 15
4 METHODOLOGY ... 17
4.1 Proposed Approach ... 17
4.2 Computation of Above and Subsurface Irradiance Reflectance ... 18
4.3 Case II Water Atmospheric Correction Algorithms ... 18
4.3.1 Adjacency Effects ... 19
4.3.2 Case 2 Regional Processor ... 19
4.3.3 Water Processor (WeW) ... 20
4.4 Semi-empirical Band Ratio Model ... 20
4.5 Statistical Error Analysis ... 22
4.5.1 Root Mean Square Error ... 22
4.5.2 Mean Absolute error... 23
5.1.1 MERIS Reflectance versus in- situ Reflectance ... 26
5.2 Atmospheric Correction Evaluation ... 26
5.2.1 Case 2 Regional Processor ... 26
5.2.2 Improve Contrast over Ocean and Land for Adjacency Effects and C2R ... 27
5.2.3 Water Processor WeW ... 27
5.3 Atmospheric Correction and Validation ... 29
5.4 Phycocyanin Concentration from MERIS image ... 33
5.4.1 Phycocyanin Absorption ... 34
5.5 Phycocyanin Intensity Index ... 35
5.5.1 Cyanobacteria Distribution ... 39
5.5.2 Three-tier Alert System ... 40
5.6 Phycocyanin Fluorescence ... 41
5.6.1 Diurnal and Monthly Variations of Cyanobacteria ... 41
5.6.2 Seasonal Variability of Cyanobacteria blooms ... 43
5.6.3 Comparisons of PC Concentrations and Chl_a from MERIS and Real-time Measurements ... 43
5.7 Seasonal Succession of Cyanobacteria and chl_a ... 45
5.8 Limitations ... 46
6 CONCLUSIONS AND RECOMMENDATIONS ... 47
6.1 Conclusions ... 47
6.2 Recommendations ... 48
LIST OF REFERENCES ... 49
Figure 2.2: The concept of remote sensing of water; Adopted from Sampsa Koponen (2009) ... 8
Figure 3.1: Location Map of Lake Ijsselmeer showing sampled sites during the field campaign. ... 10
Figure 3.2: Wisp-3 optical spectrometer sensors ... 13
Figure 3.3: Spectroradiometric measurements in Lake IJsselmeer. ... 14
Figure 4.1: The schematic procedures taken for Atmospheric correction, derivation of PC concentrations and PC intensity Index ... 17
Figure: 5.1: a, b and c: Subsurface Irradiance reflectance spectra for day 23, 25 and 28 September ... 25
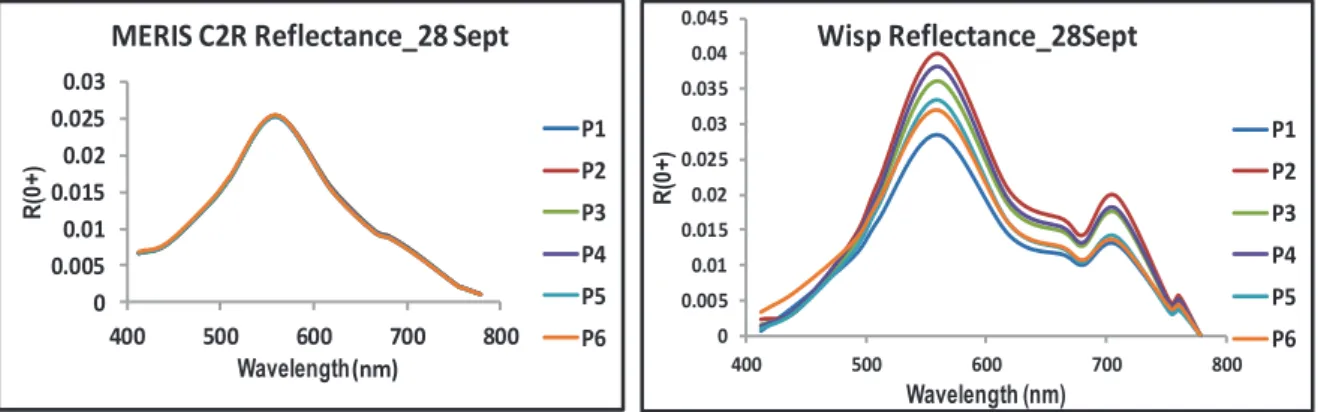
Figure 5.2: MERIS predicted and WISP-3 measured reflectance spectra typical of Lake IJsselmeer ... 26
Figure 5.3: Comparison between C2R MERIS Reflectance and In-situ Reflectance. ... 27
Figure 5.4: Comparisons between ICOL- C2R MERIS reflectance and In-situ reflectance. ... 27
Figure 5.5: Comparisons between ICOL-WeW Reflectance and In-situ measured Reflectance ... 28
Figure 5.6: a, b: Comparison between ICOL-WeW and ICOL-C2R spectra with In-situ reflectance ... 28
Figure 5.7: Accuracy assessment of Atmospheric Correction for the 6 sampled geographical locations in Lake Ijsselmeer. The left panel indicates C2R without ICOL and the right panel indicates C2R with ICOL. MERIS centered bands are displayed ... 30
Figure 5.8: Correlation of Atmospheric matchup points of In-situ and MERIS before and after implementation of ICOL. Plots on the left panel indicates C2R without ICOL whilst the right panel indicates C2R with ICOL ... 31
Figure 5.9: Correlation of the Spectral match-ups of WeW – ICOL and In-situ Reflectance Spectra ... 32
Figure 5.10: Correlation between WISP-3 measured and MERIS predicted PC concentrations. ... 34
Figure 5.11: a, b: Scatter plots showing relationship between predicted PC concentration versus PC absorption and (b) Observed PC concentration versus PC absorption. ... 35
Figure 5.12: a, b, c: Relationship between PC.I.I and PC concentration for 28 September 2011, 10 May and 18 April. The PC.I.I plotted values were log transformed before they were plotted. ... 36
Figure 5.13: Scatter plot of PC.I.I versus PC concentrations for 14 maps. The PC.I.I plotted values are log transformed ... 37
Figure 5.14: Scatter plot of PC.I.I versus chl_a concentrations for 14 maps ... 37
Figure 5.15: A and B: Distribution maps of PC concentration and PC Intensity Index. ... 39
Figure 5.16 a, b: Daily averages of PC Fluorescence variation between 8:00 am and 15:00 pm for 6 July and 28 September. PC Fluorescence values were log transformed before they were plotted. ... 42
Figure 5.17: Monthly Variations of Oxygen, Temperature, Turbidity, chl_a and PC ... 42
Figure 5.18: Seasonal variations of turbidity, temperature, Oxygen, PC fluorescence and chl_a. Log transformed PC fluorescence and Oxygen are displayed on secondary axis. ... 43
Figure 5.19: Scatter plots of PC fluorescence and MERIS PC concentrations. PC Fluoresce is given in (RFU) units ... 44
Figure 5.20: Comparisons between PC fluorescence and MERIS chl_a concentrations ... 44
Figure 5.21a, b: Time series of PC and chl_a from in-situ measurements and MERIS image for pole 46 and 47. PC fluorescence is displayed on the secondary axis and its values were log transformed before they were plotted. ... 45
Table 2-1 MERIS Spectral Bands and Applications... 9
Table 2-2 MERIS sensor characteristics ... 9
Table 3-1: MERIS Full Resolution Level 1b Metadata ... 15
Table 3-2: MERIS Match-up Sites in Lake IJsselmeer. Coordinates are in Decimal Degrees (DD) ... 16
Table 4-1 Constants for Semi -empirical Band Ratio Model ... 22
Table 5-1 Summary Statistics of atmospheric correction: n = 6. ... 32
Table 5-2 Retrieved PC Concentrations and absorption coefficients from MERIS and measured PC concentrations ... 34
AC Atmospheric Correction AOPs Apparent Optical Properties BGA Blue Green Algae
CDOM Colored Dissolved Organic Matter C-PC Cyanophyceae Phycocyanin C2R Case 2 Regional
DD Decimal Degree
ENVI Environment for Visualizing Images ENVISAT Environment Satellite
EOLISA Earth Observation Link-Stand Alone ESA European Space Agency
FOV Field of View FR Full Resolution
GPS Global Positioning System
ICOL Improve Contrast over Ocean and Land IOPs Inherent Optical Properties
NIR near Infra-Red NN Neutral Network PC Phycocyanin
PC.SI Phycocyanin Severity Index MAE Mean Absolute Error
MERIS Medium Resolution Imaging Spectrometer MOMO Matrix Operator Method
RMSE Root Mean Square Error R-PC Rhodophyceae Phycocyanin RR Reduced Resolution
SIOPs Specific inherent optical properties TOA Top of Atmosphere TSM Total Suspended Matter
WHO World Health Organization WISP-3 Water Insight SPectrometer
Symbol Description Unit
a
phAbsorption coefficient of phytoplankton m
-1a
pcAbsorption coefficient of phycocyanin m
-1a*
pcSpecific absorption coefficient of phycocyanin m
2/mg
a
wAbsorption of water molecules m
-1b
bBack scattering coefficient m
-1Chl_a Chlorophyll
a
pigment mg/m
3Chl_b Chlorophyll
b
pigment mg/m
3E
dDownwelling irradiance reflectance Wm
-2nm
-1E
uUpwelling irradiance reflectance
Wm
-2nm
-1L
wuUpwelling
radiance reflectance
Wm
-2nm
-1sr
-1L
skyWater leaving
Radiance
Wm
-2nm
-1sr
-1K
dDiffuse attenuation coefficient
m
-1Rrs Remote sensing reflectance sr
-1R(0-) Subsurface irradiance reflectance Dimensionless
R(0+) Above surface irradiance reflectance Dimensionless
R_Lw Water leaving radiance ReflectanceWm
-2nm
-1sr
-11.
INTRODUCTION
1.1.
BackgroundWater quality monitoring of blue- green algae (BGA) is a global growing concern and Lake IJsselmeer is among inland fresh water facing this problem. Lake IJsselmeer is recognized by the Dutch government for its socio- economic and ecological importance yet it is vulnerable to eutrophication resulting from human related activities. Lake IJsselmeer is a very important conservation area and supports a diversity of aquatic bird species, fish, and mussels among other aquatic organisms. In drought periods the water is used for drinking purposes mostly in the Northern provinces of Netherlands. It stands as the largest fresh water lake in Western Europe and offers recreational activities to both local and regional visitors. Unfortunately, it faces a challenging problem of pollutants from a number of countries which include; Switzerland, Germany, Austria, Belgium, Italy, France, Luxembourg, Lichtenstein and Netherlands. The pollutants are transported through river Rhine into a tributary IJssel river which then discharges 15% into Ketemeer and then IJsselmeer (Raat, 2001). The main sources of pollutants include; industrial effluent, agricultural fertilizers (phosphates, nitrates and animal manure) as well as municipal waste water from the countries mentioned above. This situation subjects Lake IJsselmeer to serious eutrophication problems which in turn triggers BGA formation and consequently adversely affecting aquatic ecosystems and human health from toxins produced by this algae (Rijkswaterstaat, 2011). Water management authorities have been confronted with the problems of efficiently quantifying the intensity of blue green algae. Traditional in-situ methods lack high spatial and temporal coverage needed for regular and timely warnings in case of intense blooms. One way to overcome this information gap is to integrate remote sensing techniques with conventional methods in management tools so as to improve water quality monitoring. Therefore, the aim of this study to derive indicators of blue green algae and develop a proxy to measure the intensity of blue- green algae using remote sensing techniques coupled with in- situ measurements.
We use term blue green algae interchangeably with cyanobacteria and these are photosynthetic bacteria that have similar properties with algae and are inhabitants of inland water bodies as described in (Chorus et al., 1999). They are a common feature in highly eutrophic water bodies. Owing to nutritional enrichment of Lake IJsselmeer, occurrences of cyanobacteria blooms in surface waters are becoming a growing problem. Their adaptations to changing environment make them more ubiquitous than any other phytoplankton species of algae and exposes humans and ecosystems at risk. A bloom in the context of this study means the accumulation of blue green algae biomass at the surface of the water. Like many lakes in the Netherlands, IJsselmeer is highly eutrophic and supports dense cyanobacterial blooms (Ibelings, 2005). Blue green algae hereafter referred to as cyanobacteria constitute some of the most hazardous toxins of water borne biological substances in IJsselmeer. They have a tendency of proliferating during spring and summer seasons notably around May and between July and September as noted by (Simis et al., 2005b). During this period, temperature, and light increases and rains are more intense resulting enormous nutrient loads in the lake particularly phosphates as aforementioned. Besides, anthropogenic related activities attributed to eutrophication in IJsselmeer, it is believed that natural phenomenon such as global warming is alleged to accelerate cyanobacteria dominance over phytoplankton population as also posited by (Kanoshina et al., 2003; Paerl et al., 2011).
Cyanobacteria are widely discredited for their undesirable effects in water bodies especially when they form surface scums. In given situations like this, recreational activities which range from, fishing boating, diving, and yachting become hampered (Hunter et al., 2010; Simis et al., 2005b). Natural ecosystems are disrupted and in worse cases they dwindle and vulnerable species go extinct for example Otter in the IJsselmeer (Laane et al., 1993). This leads to loss of economic and aesthetic value of the water body. Cyanobacteria are well known to produce toxins which include neurotoxins, hepatoxins and cytotoxins Ibelings et al (2007). Hepatoxins are associated with ill functioning of the liver, kidney and other gastrointestinal illness if accidentally ingested or swallowed by humans and animals as (Backer, 2002). Cytotoxins are associated with dermal diseases such as skin irritations and blistering whilst neurotoxins affect the nervous system of animals. Fatal cases have been reported in inland waters and coastal areas in which large populations of shell fish have been killed (Hunter et al., 2010; Hunter et al., 2008; Kutser et al., 2006; Mishra et al., 2009; Romay et al., 1998). A more recent and pathetic issue reported in the IJsselmeer is of the two dogs which died from cyanobacteria ingestion after drinking the water from this lake (Hoyer, 2010). Given a situation like this, it really demands very effective monitoring methods to be put in place like remote sensing techniques we have proposed.
In this study we assess the presence of cyanobacteria using a pigment called phycocyanin and the assumption is that, pigment concentration increases with increasing cyanobacteria biomass. Phycocyanin is defined in (Dingtian. et al., 2006; Duan et al., 2010) as a functional protein found in cyanobacteria, with characteristic absorption peak around wavelength 620 nm. Two phycocyanin pigments Cyanophyceae (C-PC) and Rhodophyceae (R-(C-PC) exist, and these can be optically and biologically distinguished from each other. The pigment C-PC has a distinct spectral absorption at 620 nm whilst R-PC peak absorption is measured at 550 nm (Jiang et al., 2001) thus, we are able to detect it using satellites from space.. Biologically C-PC falls in the blue-green cyanobacteria group whilst R-PC pigment belongs to a family of red harmful algae and these are more common in Florida coastal area in the United States of America. Phycocyanin (C-PC) hereafter re -abbreviated (PC) forms the central core subject of this study. Previous researchers employed known optical properties of PC and evaluated the usefulness of field collected spectral response patterns for determining concentrations of PC pigments and ultimately blue-green algal abundance (Randolph et al., 2008). Light absorption properties of PC pigment makes it a good candidate for optical detection methods, such as remote sensing. Thus this study utilized the spectral properties of this pigment to quantify cyanobacteria in the lake.
Monitoring cyanobacteria blooms is critical in the IJsselmeer as we have already highlighted earlier on. This study realized that, one of the most effective ways to communicate information on water quality is with indices. Therefore, this study’s main objective is to develop a PC Intensity Index (PC.I.I) of cyanobacteria concentrations from MERIS imagery. Bartram et al. (1999) concurred that, health impairments from cyanobacteria in recreational waters has to be distinguished from mild symptoms to severe hazardous exposure to high concentrations. This can be achieved through development of guidance levels with set thresholds according to international standards such as the European and World Health Organization (WHO) for recreational water according to incremental severity of the cyanobacteria. The probability of the adverse effects of cyanobacteria were classified in three levels in which each category will have a threshold set according to the concentration of cyanobacteria stipulated by the WHO recreational water standards Bartram and Ballance (1999).
We explore Seasonal variability of PC concentration and distribution using relationships between phycocyanin and turbidity, dissolved oxygen, temperature, and chl_a concentrations as did Vincent et al.
(2004) in Lake Eire. Investigation on the dynamics and spatial variability of cyanobacteria blooms taking into consideration variables such as wind, temperature, turbidity and oxygen is of paramount importance in order to determine peak seasons of the blooms However in this study wind data was not available for analysis therefore, we rely on information from literature.
The existing conventional monitoring programs provide a more general assessment of the ecological quality of Lake IJsselmeer yet human health is at high risk and many aquatic animals succumb in the waters. Traditional in-situ monitoring methods cannot provide complete information on the state of the water body since these techniques provide very low temporal and spatial coverage. Furthermore, recreational water users are more vulnerable especially during the summer time when the demand for recreational facilities increases, a time that coincides with high cyanobacteria blooms. To circumvent these problems, remote sensing based methods are proposed to be used for the detection of cyanobacteria blooms. Maps showing the distribution and concentrations of the blooms are also going to be produced. MEdium Resolution Imaging Spectrometer (MERIS) was chosen for this research because its spectral band at 620 nm facilitates the discriminate phycocyanin from other photosynthetic pigments. Algorithm developed by Simis (2005b) semi-empirical band ratio model for the Dutch lakes make it possible to map and detect PC pigment concentrations. This model has been used for purpose of this research. In-situ Spectroradiometric measurements shall be conducted for checking atmospheric correction accuracy and validating remotely sensed derived PC concentrations. Furthermore, PC fluorescence data from real time measurements will be used to validate different MERIS scenes acquired from March to September 2011.
1.2.
Research ProblemLake IJsselmeer is of significant and intrinsic economic value for the Netherlands yet it is vulnerable to eutrophication which in turn has led to cyanobacteria blooms. Cyanobacteria blooms perpetuate due to eutrophication induced by anthropogenic related activities. The situation is further exacerbated by the climate change which has seen a rise in temperature in recent years. As a result recreational activities have been hampered and many populations of aquatic organisms are under threat. Additionally, people who visit the lake for recreational activities are susceptible to health risks. Ibelings (2005) postulated that monitoring cyanobacteria in Netherlands is problematic and potentially exposes the public health to risks. Whilst cyanobacteria bloom in IJsselmeer has been investigated using various point in-situ measurements coupled with remote sensing methods, water resources authorities lack a comprehensive and quick monitoring tool capable of providing information on the severity of cyanobacteria blooms in the entire lake at once. Traditional approaches which are largely applied for example, phycocyanin pigment cell counting are laborious and time consuming considering that cyanobacteria blooms are very dynamic in both time and space. Furthermore, cell counts can differ significantly depending entirely upon the proficiency and subjective decision of an individual. Cell counting and other in-situ methods based on point sampling do not represent the entire lake. Thus the realization of the necessity to develop methods that complement the existing monitoring approaches. To circumvent these shortcomings, this study developed from remote sensing techniques a phycocyanin intensity index (PC.I.I) and concentration PC maps from MERIS images as fast a monitoring tool. Seasonal variability was assed using 14 MERIS images from March to September 2011 in order to see which months of the year pose the greatest risk to human life and aquatic ecosystems.
1.3.
Research ObjectivesThe main objective of this study is to derive indicators of cyanobacteria (blue-green algae) and develop an index to measure the intensity of cyanobacteria blooms.
1.3.1. Specific Objectives
x To derive absorption coefficient of phycocyanin pigment and using MERIS data.
x To derive phycocyanin pigment distribution and concentration maps of Lake IJsselmeer from MERIS data
x To investigate seasonal variation of cyanobacteria blooms.
1.3.2. Tasks
x To carry out in situ radiometric measurements.
x To perform atmospheric correction for MERIS images.
x To validate MERIS derived PC concentrations with Wisp-3 in-situ measurements and real-time PC fluorescence.
1.3.3. Research Questions
x Can we develop Intensity index of phycocyanin pigment concentration from remote sensing techniques?
x Is it possible to derive absorption coefficient of phycocyanin from the image?
x Can phycocyanin concentration maps provide information useful for monitoring cyanobacterial blooms?
x Can PC absorption coefficient be related to model derived PC concentrations and in-situ measured PC concentrations?
x Is there any seasonal variability of cyanobacteria blooms in IJsselmeer?
1.4.
Research outlineThis document is structured in the following manner; first, we provide background on blue green algae and remote sensing. We also provide the research problem, objectives, tasks and research questions. Chapter two provides literature on cyanobacteria; its formation, variability and usefulness of remote sensing techniques for mapping it. Chapter 3 provides a description of the study area and data sets used in this study while chapter 4 describes the methodologies applied to achieve the objectives of this study. In chapter 5 we provide results and discussion on atmospheric correction methods used, phycocyanin retrieval and validation with in-situ measurements. We also discuss the phycocyanin intensity index with respect to PC concentration. In chapter 5 we provide results and discussion. Chapter 6 provides conclusions and recommendation on the findings of this study. Finally, chapter 7 provides list of references used in this study followed by appendices.
2.
LITERATURE REVIEW
2.1.
Eutrophication In Lake IJsselmeerEutrophication is a phenomenon caused by high nutrient concentration, notably phosphates, nitrates resulting from anthropogenic related activities. The exterior input to the lakes of phosphorus and nitrogen and of polluted waters from waterways as rivers have been the major cause of eutrophication as noted in (Gulati et al., 2002). In addition to this, climate change, habitat division and biotic exploitation of many of waters bodies have probably led to loss of resilience and thus have speeded up eutrophication Gulati et al. (2002). Eutrophication is associated with number of adverse effects such as bloom of cyanobacteria, which in turn depletes available oxygen in water leading to the death of aquatic organisms. Gulati and van Donk (2002) argued that, lake eutrophication is manifested mainly in the low under-water light climate with high turbidity for example a Secchi-disc depth of between 20 and 40 cm caused usually by phytoplankton algal blooms. There exist very challenging problems in the Netherlands with intensive agriculture and animal husbandry which has led lead to Lake Eutrophication despite the fact that the source of pollutants originates from a number of other nations as already mentioned.
2.2.
Cyanobacteria AdaptationsCyanobacteria are natural and cosmopolitan inhabitants of inland fresh, brackish and turbid coastal waters. They are known to contain phycocyanin, one of the phycobiliproteins as important accessory pigments in photosynthesis of Rhodophyceae, Cyanophyceae and Cryptophyceae (B. W. Ibelings et al., 2008; Otsuki et al., 1994). They are particularly well adapted for growth in nutrient-enriched inland lakes as well as slow flowing inland waters. They often form mass populations (as blooms, scums or biofilms) during summer
and autumn in temperate latitudes Hunter et al. (2010). Similarly, (Newcombe et al., 2010) established that cyanobacteria are adapted to turbulent mixing by enlarged gas vesicles and it takes a few
days to decrease their buoyancy in order to adapt to more calm conditions. Furthermore, literature points out that cyanobacterial possess a unique character of energy balance. They need small amount of energy to sustain cell function and structure and, they are able to survive well under low nutrient conditions Chorus and Bartram (1999).
Like many species of algae, cyanobacteria contain phycocyaninas a major pigment for gathering light and performing photosynthesis. In actual fact they contain three pigments with phycobiliproteins which include allophycocyanin (blue), phycocyanin (blue) and phycoerythrine (red) as envisaged by (Chorus andBartram, 1999; Lürling et al., 2011). These pigments of cyanobacteria gather light in the green, yellow and between green and red (orange) part of the spectrum (500 nm - 650 nm) which is rarely exploited by other phytoplankton species. The accessory pigments of phycocyanin are able to efficiently use a region of the light spectrum between the absorption crests of Chl_a and the carotenoids for photosynthetic metabolism.
Adaptations such as gas-filled cytoplasmic inclusions enable buoyancy regulation and the vesicles optimize their upright position in the water column to find a proper place for survival and growth as Codd et al (2005) and Chorus and Bartram (1999) highlighted thus, they are more dominant in inland waters than other photosynthetic phytoplankton species. Owing to their extensive spectrum of life strategies, “cyanobacteria represent a significant component of virtually all photosynthetic assemblages, colonizing
different types of lakes over the whole trophic range” (Salmaso, 2000). These complex forms of adaptations expose human life and ecosystems at risk. Thus there is need for constant and frequent monitoring with remote sensing techniques so people can be timely alerted in case of a fatal bloom.
Chorus and Bartram (1999) maintained that, in suitable environmental conditions, cyanobacteria experiences high growth rate resulting in formation of large blooms. In environments where they are exposed intermittently to high light intensity for example, an intensity roughly less than half of what would be at the surface of a lake, they promulgate at a maximum rate. Cyanobacteria at higher surfaces are tolerant of high light intensities do not require it for bloom formation Chorus and Bartram (1999).
2.3.
Cyanobacteria Seasonal VariabilityIn this study we attempt to explore the changes in cyanobacteria intensity with respect to different seasons. Seasonal patterns in cyanobacterial abundance have been observed to be affected substantially by, solar irradiance, nutrient supply and temperature. A study by Mihaljević et al. (2011) in temperate climatic environments indicated that cyanobacteria form during all seasons of the year. This is expected to be the same situation in the IJsselmeer as it lies in the temperate climactic zone. However, (Graham et al., 2008) observed in their study in USA that cyanobacterial populations tend to peak in spring and summer months. One interesting feature to note is that in light limiting conditions cyanobacterial growth rates are greater than that of other phytoplankton species, and this coupled with their buoyancy allows them to out-compete other algae in highly turbid waters (Vincent et al., 2004). Other research has indicated that high water temperature leads to an increase in cyanobacteria density (Lehman et al., 2008) with a significant growth for temperature above 15oC. Nevertheless, maximum growth rates attained at temperatures above 25oC Newcombe et al. (2010). Mass blooms of cyanobacteria are generally associated with high nutrient concentrations, particularly phosphorus but their growth and biomass is unlimited by phosphate availability for they can store sufficient phosphorus to make two to four cell divisions corresponding to a four to thirty -two folds increase in biomass Newcombe et al. (2010). A recent study by Xie et al. (2011) in USA has shown that cyanobacteria maintain a viable population and are correlated with turbidity in Muskegon Lake. Based on these dynamism characteristics of cyanobacteria, point based quantification methods are not adequate enough and need to be replaced by high spatial and temporal remote sensing methods.
Topçu et al. (2004) and Simis et al. (2007) maintained that, seasonal changes of nutrients are strongest during spring, leading to phytoplankton spring bloom spring blooms a situation which has been observed in the Dutch lakes particularly in IJsselmeer. Oxygen is saturated in winter seasons a season when most organisms are in a torpor state and proliferation of cyanobacteria coupled with other phytoplankton species leads to its depletion. Weather changes from stormy to fine conditions result in excessive colonies accumulating at the surface.
2.4.
Temporal and Spatial variability of CyanobacteriaCyanobacteria vary on short time scales as in hours or days and their vertical migration, entrainment in temporary circulation cells, or wind movement of surface accumulations may changes quickly in a water column but not its overall abundance (Graham et al., 2008). Under light wind conditions cyanobacteria is moved towards the shoreline of area lakes and bays, where they form thick scums (Graham et al., 2008; P. W. Lehman et al., 2005). In extreme cases, such clusters may become very thick and even acquire a sticky consistency (Nõges et al., 2010). Cyanobacteria changes rapidly with changing hydrological conditions for example ‘circulation patterns or inflow events’ Graham et al. ( 2008). Under calm weather conditions
cyanobacteria has been observer to spreads evenly throughout reservoirs however, currents and prevailing winds may lead to irregular distribution.
2.5.
Recreational Water Quality indicesA water quality index forms a basis of a framework for monitoring potentially toxic cyanobacterial blooms for monitoring. WHO and European Water framework established alert guidance levels framework for recreational waters which have been universally adopted by many nations, Bartram and Ballance (1999) and these were essentially developed for monitoring cyanobacteria. These are developed based on cell counting methods from water samples taken from certain points not representative of the whole water body. Development of methods to detect potentially toxic cyanobacterial blooms in water bodies are crucial (Vardaka et al., 2005). Figure 2.1 illustrates structural development of standard recreational water guidelines thresholds (Ibelings, 2005).
Suspicion xComplaints xDirect Observation
Reputation
Water body Surface Scums
No? Determine PC (Microcystins) < 10 μg/l > 20μg/l 10-20 μg/l No further action Ban Swimming Issue warning
Figure 2.1: Structure of Guidelines for Recreational Waters; adopted from (Ibelings, 2005)
2.6.
Remote Sensing of Cyanobacteria bloomsPoint based methods are insufficient for monitoring cyanobacteria distribution and concentrations as these are known to change rapidly in space and time for example, with wind speed and direction. Observations from fixed stations or along established divides could be unrepresentative of cyanobacteria distribution and abundance. Remote sensing based techniques bridge this gape by offering rapid detection of cyanobacteria distribution and concentrations in the whole lake. It is macroscopic remote observation ability which makes remote sensing a more superior platform. Furthermore these advances have led to the development of algorithms specifically for mapping phytoplankton pigments and in case of this study PC. The concentrations of phytoplankton pigments are retrieved form the column of the water using mathematical algorithms that estimate the concentrations based on the spectral amount of light emerging from the water as maintained by (Gons et al., 2005a; Hunter et al., 2010). Simis et al. (2007) demonstrated this prospect by developing a model which they termed semi-empirical band ratio model based on the absorption feature of at 620 nm and it was tested in this study for the derivation of PC concentrations in Lake IJsselmeer. It is important to note that inherent optical properties of a water body differs notably case 1 waters (largely ocean) and case 2 (turbid coastal and inland waters). Case 2 waters have optical properties strongly influenced by high concentrations of mineral particles as well as CDOM and these do
not co-vary with phytoplankton biomass (Hunter et al., 2010). The following are some of the algorithms that have been specifically developed for the quantification PC based on its absorption feature at 620 nm; single band ratio algorithm by (Schalles et al., 2000) and semi-empirical algorithm by Dekker(1993). These algorithms quantify PC from remote sensing reflectance (Rrs) and employ different wavelengths in the NIR.
2.6.1. Relationship between Spectral Reflectance and Inherent Optical Properties
The above mentioned algorithms makes use of the relationship that exists between the IOPs that is absorption and back scattering coefficients of water constituents and subsurface irradiance reflectance R(0-) (Gordon et al., 1975). Subsurface irradiance reflectance as described in Dekker et al (2002) is the ratio of upwelling to downwelling light. These relationship have been found to be valid as argued by (Rijkeboer et al., 1997) because R(0-) is relatively stable under varying solar angles, as well as and nature of the water surface and the condition of the atmosphere. Figure 2.2 illustrates an overview of how water quality parameters are retrieved from a water column using remote sensing techniques.
Figure 2.2: The concept of remote sensing of water; Adopted from Sampsa Koponen (2009)
The semi-empirical band ratio algorithm developed by (Simis et al., 2005b), was adopted for estimating cyanobacteria concentration in this study
. The model
uses a band ratio 709 nm to 620 nm to estimate PC pigment. It was selected based on the fact that it considers the influence of Chl_a absorption at 620 nm and it includes the impact of variable PC: Chl_a ratio. The semi-empirical band ratio was specifically developed for MERIS band configurations and relates PC to the absorption coefficient at band positioned at 620 nm, Ruiz-Verdu (2008), which is retrieved from the ratio of the 620 nm band and a near infra-red band, centered at 709 nm, as reference. Medium Resolution Imaging Spectrometer (MERIS) sensor which is on board the European Space Agency's ENVISAT, has good temporal and spectral resolution needed acquire imagery for cyanobacteria blooms in many inland waters (Gómez et al., 2011). That’s we found it imperative for our study.2.7.
MERIS Sensor Characteristics and Water Quality ApplicationsMERIS has a 68.5° field-of-view push-broom imaging spectrometer which measures the solar energy or radiation that is reflected by the Earth, at a spatial resolution of 300 m on the ground, in 15 spectral bands. The bands are programmable in width and position, in the visible and near infrared wavelengths (ESA, 2006). It was the first sensor to offer the combination of several narrow spectral wavebands targeting both Chl_a and other accessory pigments absorption in the red and NIR, at a spatial resolution of 260 m across track sufficient for medium-sized water bodies. The sensor’s signal-to-noise ratio is acceptable as posited by (Simis et al., 2007). MERIS allows global coverage of the Earth in 3 days (ESA, 2006) thus it was found to be crucial for this study in providing high temporal resolution data.
Table 2-1 MERIS Spectral Bands and Applications
Band number Band center (nm) Band width (nm) Application
1 412.5 10 Yellow substance and detrital pigments
2 442.5 10 Chlorophyll absorption maximum
3 490 10 Chlorophyll and other pigments
4 510 10 Suspended sediment, red tides
5 560 10 Chlorophyll absorption minimum
6 620 10 Suspended sediment
7 665 10 Chlorophyll absorption & fluorescence reference
8 681.25 7.5 Chlorophyll fluorescence peak
9 708.75 10 Fluorescence peak reference, atmosphere
corrections
10 753.75 7.5 Vegetation, cloud
11 760.625 3.75 O2 R- branch absorption band
12 778.75 15 Atmosphere corrections
13 865 20 Vegetation, water vapor reference
14 885 10 Atmosphere corrections
15 900 10 Water vapor, land
Source: MERIS User Guide Version 2 http://earth.esa.int/pub/ESA_DOC/ENVISAT/MERIS/meris Table 2-2 MERIS sensor characteristics
Sensor
characteristics
Spectral Spatial Orbital
MERIS -Vis-NIR 15 bands -Across range 390nm to 1040nm -Ocean 1040-1200m reduced resolution -Coastal, 260- 300m Full resolution -Polar orbital-Sun synchronous -FOV 68.5o -Swath width 1150km
3.
STUDY AREA AND MATERIAL USED
3.1.
The Geography of the Study Area
Lake IJsselmeer is the largest inland water body in Netherlands covering an area of 1190 km2 and it is about 8 meters above the sea level.It is situated at 52o 49’ N latitude and 5o 15’ E longitude. It can be described as a shallow eutrophic freshwater lake, which was reclaimed from the Wadden Sea in 1932 by a dike and with an average depth of 4.4 meters Dekker (2004). Previously the lake had a total area of 3,440 km2 and the area was reduced by reclamation projects that were aimed at increasing the land area of Netherlands Dekker (2004) through constructing enclosing dikes and pumping the water out. The lake area is surrounded with about 600 km of shore and it is nearly 30 km long. The surrounding land is largely used for agricultural purposes notably large scale market gardening and cattle ranching.
Lake IJsselmeer has favorable conditions for the occurrence of floating layers of blue-green algae. The river IJssel (a branch of the river Rhine) supplies continuously enormous amounts of nutrients mostly phosphates nitrates and animal waste products into the lake. Simis et al. (2005a) noted that lake is shallow and as a result the water temperature rises quickly. Thus, during summer sunny season, cyanobacteria blooms are expected to be high and more frequent. The figure 3.1 illustrates map of the study area.
Figure 3.1: Location Map of Lake Ijsselmeer showing sampled sites during the field campaign. Source of plain map: http://geography.about.com/library/blank
Besides the adverse ecological impacts, buoyant layers of blooms also impacts greatly on economic uses of the water in particular recreational activities such as boating, yachting, swimming and boat skiing among others.
3.2.
ClimateThe predominant wind in the Netherlands is mostly from South-west direction and it results in moderate maritime climate. Precipitation is experienced throughout the year and it is relatively equally shared in each month. However summer and autumn season tend to gather a bit more precipitation than other months mainly due to the intensity of the rainfall rather than frequency of the rain days (Wikipedia, 2012). The following climate data which are long-term averages between 1981 to 2010 recorded at De Bilt weather station a forecasting substation for Lake IJsselmeer was obtained from (StatLine, 2011). The average temperature for the whole period of 30 years was 7.7oC and average summer temperature for same period was 17oC. Precipitation for the same period was 997.5mm.
3.2.1. Soils
The soil profile is made up of a layer of mainly fine to very soft Holocene sediments (mineral) and peat overlying sandy Pleistocene subsoil Glopper (IJsselmeer polders Development Authority, Scientific Department) unpublished work.
3.2.2. Economic significance of Lake IJsselmeer
IJsselmeer has a severe problem of cyanobacteria yet it plays a significant role in the economy of Netherlands Gulati and van Donk (2002). The water is mostly used for irrigation and drinking purposes during drought seasons (Huitema, 2002). It also attracts a wide range of recreational activities yet it poses danger to human health and aquatic life forms.
3.3.
Field Measurements3.3.1. Datasets
The in-situ datasets mainly consisted of WISP-3 Spectroradiometric measurements and real-time PC fluorescence, temperature, oxygen chl_a and turbidity measurements. Satellite data consisted of MERIS images and these are explained in detail in the sections below.
3.3.2 Field Sampling and Data Collection
In-situ measurements were carried out during a field campaign on the 23rd, 25th and 28th of September 2011 in Lake IJsselmeer. Radiometric measurements were recorded using Water Insight SPectrometer (WISP-3) issued by Water Insight. The first and second field compaign for collecting spectra of water leaving reflectance was carried between Enkhuizen and Stavoren on 23 and 25 September 2011 with total number of 15 samples. On 28 september the spectral reflectance measurements were taken on the other side of the Lake from Enkhuizen to Den Oever with 6 sampled sites. The spatial coordinates of each site from the lake were recorded using a Garmin etrex global positioning system (GPS). The measurements were taken concurrently with MERIS satellite overpass for 28 September. For 23 and 25 september measurements were taken an hour before and after the satellite overpass.
WISP-3 spectroradiometer instrument was used to collect downwelling sky and upwelling radiances from water as well as sky irradiance. The flexible hand held instrument provided instant preliminary water quality parameters which included; chl-a, PC concentration, CDOM, and Total suspended particulate matter (TSM diffuse attenuation coefficient (Kd) from embbeded formulas. However, for the purpose of
this study chl-a and PC concentrations were considered. Ancilliary data were also collected on water temperature, wind speed, secchi depth and sea level pressure on 28 September 2011. See appendix A table 4. The sample sites were selected based on factors listed below;
x The distance of about 2 km away from the lake shore line to avoid land adjacency effects.
x The Lake bathymetry was considered to avoid bottom effects.
x Measurements were taken at 5 minutes intervals however, clouds inhibited consistancy.
x The distance chosen between the measuring points was based on the spatial resolution of MERIS sensor of 300m to avoid repeated measurements on one pixel.
3.3.3 General Description
Day 23 and 25 September was characterized by partly cloudy conditions. As a result, most of the measurements were taken when clouds had dispersed. Fine weather conditions persisted on 28 Septermber and reflectance spectra collected on this day were considered for matchup with MERIS image reflectances. The sampled points/sites where measurements were taken on the 23rd, 25th and 28th of September 2011 respectively are illustrated on figure 3.1. The total number of sampled points for all 3 days with defined geographic coordinates were 22, (n = 22). The information is provided in table 3.2.
3.4 In-situ Measurements
3.4.1 Measurements Performed within this Study
The field campaign followed the protocols described in the WISP-3 manual (Peters et al., 2005). The wavelength of the instrument ranges of 380 to 780 nm, with a spectral resolution of 4 nm and 3o field of view (FOV) aperture. The 0.3 nm spectral intervals were interpolated to 1 nm interval in a database created in excel so that we could match MERIS centerd bands. The signal to noise ratio of the spectrometers is 250:1. The hand held optical device has three channels which measures three optical properties simultaneously. At each site the spectrormeter on the top measured downwelling sky irradiance (Ed), the other two spectrometers sensors pointing at angles of 42o measured downwelling sky radiance (Lsky ) and upwelling radiance (Lwu) from the water. In order to avoid sun glint, the instrument was held about 135o away from the sun. Figure 3.2 illustrates the Wisp-3 spectrometer sensors positions. To ensure proper measurements the instrument was calibrated at Water Insight before the field campaign.
Spectroradiometric measurements were made concurrent to MERIS satellite overpass for the purpose of checking accuracy atmospheric correction for remote sensed data according to Simis et al. (2005b). Ground truth samples and field reflectance spectra with total of 5, 10 and 6 were collected on 23, 25 and 28 September 2011 respectively. The first two were measured between Ekhuizen and Stavoren and on 28 September the field spectra were collected between Ekhuizen and Den Over.
Figure 3.2: Wisp-3 optical spectrometer sensors
We measured subsurface irradiance reflectance because it provides characteristics of the true features of the water color as claimed by (Morel, 2006). Field-based Spectroradiometric instruments are mostly used for remote sensing projects as suggested by Schalles and Yakobi (2000) because they offer high spectral resolution suitable for water quality monitoring needs in this case, phytoplankton pigments. WISP-3 was desired as it computes instant preliminary data for chl_a and PC concentrations. The formulas for deriving these parameters including subsurface irradiance reflectance are all embedded in the instrument.
As aforementioned, the measurements were taken from the side of the boat as illustrated on middle field photographs on figure 3.3, to mimic the satellite which observes from above the water surface. Figure 3.4 shows the activities involved during field measurements. The general water color was green an indication that the lake is eutrophic and these observation were also made by (Gons et al., 2005a). Green algal colonies were visually observed floating near the surface.
The photographs on (fig 3.4) shows the water colour and measurements setups. The middle and bottom shows Wisp-3 deployment and data collection including recording of geographic points and aerosol optical thickness data from Sunphotometer.
Sky Irradiance
(Ed refer to fig 2.2)Sky Radiance
(Lsky refer to fig 2.2)
Upwelling Water
Radiance (Lw refer to
Figure 3.3: Spectroradiometric measurements in Lake IJsselmeer.
3.4.2 Real –time Measurents Data Collected by the Rijwaterstaat in the IJsselmeer
A second independent dataset was acquired from lake IJsselmeer from two geographic points (longitude 5.492902; latitude 52.70991 and longitude 5.223987; latitude 52.91201) that is, pole 46 and 47 respectively and they are illustrated on (fig 2.1). The data was issued by Rijwaterstaat an arm of the Dutch Ministry of Transportation and Water Management. These points which are fixed poles/stations were chosen by the Rijwaterstaat to represent the whole lake and the data was made available for this study by Water Insight. The data collected included, turbidity, water temperature, oxygen chl_a and PC fluorescence. Phycocyanin pigment was measured using fluorimeter probe called YSI 6131 Phycocyanin Blue-green Algae Sensor. Turbidity was measured using YSI 6136 fouling-resistant sensor. Oxygen was measured using a ROX optical sensor. Chlorophyll was measured using YSI 6025 sensor and lastly temperature was measured using 130 EcoSense Temperature Sensor.
The MERIS 14 scenes for 22, 27, 29 March, 10, 18, 20, 21, 23, 25 April, 01 May, 03, 27 June, 06 July and 28 September 2011 PC concentrations were validated using Chl_a and PC fluorescence measured on days that coincided with the satellite overpass for the respective days. The images were also made available for this study by Water Insight. These data were crucial for investigating seasonal variability of cyanobacteria blooms and chl_a concentrations. The images were all atmospherically corrected prior to model implementation. PC fluorescence has a characteristic absorption peak and fluorescence emission peak, is often used as the indicator for cyanobacteria detection, Becker et al. (2009). Thus, PC fluorescence was
found imperative in this research for validating MERIS derived PC concentrations. Besides PC fluorescence data, we also collected other data which included turbidity, dissolved oxygen, water temperature and chl_a. We considered diurnal measurements recorded between 8:00 am and 15:00 hours for analysis purposes based on the fact that more recreational activities are conducted during day time. For five variables, averages were taken per day between 8:00 and 15:00 hours and likewise per month. The PC fluorescence and chl_a monthly averaged and standard deviation values are provided in Appendix (A) in tables 2 and 3.
3.4.3 Data Processing
Data collected from the field had some outliers and these were filtered out from the used dataset. At certain occasions, two or three measurements were taken on a single pixel and these extra recordings were discarded so that only one measurement could be retained for matching with MERIS. Furthermore, the data was filtered based on weather conditions (clear skies) and images for 23 and 25 September were not considered for atmospheric correction as the days were cloudy.
3.5 Satellite Data
MERIS was used to derive the final maps of PC concentrations and PC intensity index. MERIS has high spectral resolution and has a revisit period of 2–3 days (latitude dependent). It has a dual spatial resolution of 300 m full resolution (FR) and 1200 m reduced resolution (RR). However, FR level 1b top of atmosphere radiance (TOA) are used and presented in this study. The FR images were obtained from ESA through Water insight. The satellite data were useful in this study for interpreting PC concentrations from in situ measurements by providing large spatio-temporal coverage images that in situ data cannot (CEARAC, 2007). Phycocyanin pigment has a distinct spectral signature at 620 nm, picked up by MERIS sensor. Owing to these features, MERIS was chosen for mapping cyanobacteria distributions (Gons et al., 2005a; Mittenzwey et al., 1992).
The three images metadata is provided on table 3.1. The image of 28 September had the clearest atmosphere as such it was considered for match-up purposes with in situ measurements and it is highlighted on table 3.1.
Table 3-1: MERISFull Resolution Level 1b Metadata
Date Metadata of available images Sensing start time Track Orbit 23/09/2011 MER_FRS_1PNPDE20110923_101942 12:36:40 80 50094 25/09/2011 MER_FRS_1PNPDE20110925_104627 12:46:31 37 50051 28/09/2011 MER_FRS_1PNPDE20110928_103627 12:20:07 8 50022
3.4.
In-situ and MERIS Data Match-upA match-up is a time related sampled location in the field and image pixel with same geographic coordinates. The match-up is crucial for validating developed models and in this case, the semi empirical band ratio model for deriving water quality parameters such as PC and chl_a concentrations from remotely sensed satellite data (Campbell et al., 2011). Table 3.2 provides in-situ measured sites, time and geographic locations that were matched with MERIS data.
Table 3-2: MERIS Match-up Sites in Lake IJsselmeer. Coordinates are in Decimal Degrees (DD)
Date Sampled
points/ sites Sensing start time Latitude (DD) Longitude (DD) Time (GMT)
23/09/2011 P1 12:20:07 52.78606 5.31159 11:10 P2 52.79768 5.31225 11:18 P3 52.81106 5.31506 11:22 P4 52.82641 5.31992 11:29 P5 52.84235 5.32773 11:34 25/09/2011 P1 12:46:31 52.71158 5.31003 12:49 P2 52.72663 5.31195 12:53 P3 52.75067 5.31291 12:59 P4 52.76459 5.31124 13:04 P5 52.77754 5.31075 13:09 P6 52.79201 5.31117 13:14 P7 52.80566 5.30754 13:19 P8 52.83618 5.3093 13:31 P9 52.84887 5.31581 13:36 P10 52.86170 5.32726 13:42 28/09/2011 P1 12:36:40 52.86424 5.14974 11:38 P2 52.88106 5.13437 12:38 P3 52.88112 5.13433 12:40 P4 52.88037 5.13397 12:54 P5 52.87196 5.14295 13:24 P6 52.86682 5.14799 13:44
4
METHODOLOGY
4.1 Proposed Approach
This study aimed at deriving indicators of cyanobacteria as a proxy to measure the intensity of cyanobacteria blooms from remote sensing data. First, field spectra were used to validate the atmospheric correction. A semi empirical nested band ratio model by Simis et al. (2005a) was then applied to the corrected images for deriving PC concentrations. Furthermore, the MERIS derived PC concentrations were validated with in-situ real-time fluorescence measurements. Figure 4.1 illustrates a summary of the procedures that was followed to achieve the objectives of this research.
MERIS Images Atmospheric Correction Rrs (sr^1) Transformatiom of Rrs to R(0+) Wisp-3 Field Spectrometer measurements Real-time in-situ Measurements Yes 1. R(0+) 2. R(0-) 3. PC concentrations R(0+) PC concentrations Water temperature Turbidity Dissolved Oxygen Chl_a conentrations Averaging the Variables Match -up In-situ and MERIS
Reflectance
Implementation of Semi Empirical Band Ratio Model
Derived PC Concentrations, Chl_a Concentrations PC Absorption Coefficients PC Distribution and Concentration Maps Implementation of Developed Index Algorithm PC .Intensity index Validation of PC concentrations Error Validation of PC Fluorescence, Chl_a with MERIS PC concentration and Chl_a concentration Assessment of Seasonal Variability of PC Fluorescence (Concentrations) Procedure 1. C2R 2. ICOL + C2R 3. ICOL+ WeW NO
Figure 4.1: The schematic procedures taken for Atmospheric correction, derivation of PC concentrations and PC intensity Index
4.2 Computation of Above and Subsurface Irradiance Reflectance
At each sampled point, three optical properties, upwelling radiance from water, Lwu, and the downwelling radiance, Lsky, and downwelling sky irradiance (Ed), were measured simultaneously above the water. Two other spectrometers Lsky and Lwu were pointed at angles of 42o to measure radiance from respectively the sky and the water respectively (Gons et al., 2005b). The zenith angle of 42° was maintained to avoid instrument from boat shadow and self-shading. An azimuth angle of 135° to minimize sun glint effects maintained in order to adhere to NASA ocean optics protocols (Mueller et al., 2003). Angles of 90o – 180o were avoided. WISP-3’s embedded formula computed above irradiance reflectance as follows;
ܴሺͲ ሻ ൌ ൬ሺೢೠషכಽೞೖሻா ൰ כ ݊௪
ଶ כ ܳ Equation (1)
Where; Lsky = downwelling sky radiance (
Wm
-2nm
-1sr
-1)
Lwu = upwelling water radiance from water (Wm
-2nm
-1sr
-1)
Ed = downwelling sky irradiance (Wm
2nm
-1)
σ = direct surface reflectance with value taken 0.022
nw = index of refraction at water/ air interface and (value taken = 1.33)
. Q = conversion coefficient for Lwu to Eu in (equation 2)and is taken as pi (π)isotropic light field. The Subsurface irradiance reflectance is approximated from equation 1 as follows;
Upwelling subsurface irradiance
ܧ௨ሺͲ ሻ ൌ ݊௪ଶ כ ܳ כ ൣܮ௪௨ሺͲ ሻ െ ߪ כܮ௦௬ሺͲ ሻ൧ כ ሺͳ െ ߪ െ ݓሻ Equation (2)
ܧௗሺͲ െሻ ൌ ܧௗሺͲ ሻ ͲǤͷ כ ܧ௨ሺͲെሻ Equation (3) Finally, subsurface irradiance was computed simply as follows;
ܴሺͲ െሻ ൌ ாೠሺିሻ
ாሺିሻ Equation (4) Where; Eu(0-) = Upwelling subsurface irradiance.
4.3 Case II Water Atmospheric Correction Algorithms
MERIS satellites observe the water body from an altitude of almost 800 km. The water leaving radiance thus is expected to travel very long distances through interactions with the atmosphere before it gets recorded by the sensor (Kirk 1994). A bigger fraction (0.8) of the signal recorded by the satellite originates from the atmosphere. About 0.1 interacts with the water surface and the remaining 0.1 with the water column (Marnix, 2007). Consequently, some corrections had to be applied on attenuation of the upwelling radiance between the surface and the sensor by the atmosphere to remove the radiance path. Guanter et al. (2010) postulated that AC is a pre-requisite for quantitative remote sensing method requiring images to be calibrated to surface reflectance. Unwanted signal from atmospheric scattering is dominant causing drastic change in the spectral composition light received by the remote sensor sensor (Guanter et al., 2010) and as such need to be removed. First adjacent effects were removed using Improve contrast over land and ocean (ICOL) then case2 regional processor (C2R) and water processor (WeW) were applied to remove
the influence of the atmosphere. C2R and WeW were applied to MERIS images FR level 1b to compare the performance of the two and determine one which simulates PC absorption trough at 620 nm.
4.3.1 Adjacency Effects
Improve Contrast over Ocean and Land (ICOL) is a processing tool developed by (Sante, 2007). It was implemented in BEAM VISAT command line routine (D. Odermatt et al., 2008) to correct for adjacency effects. The images retrieved from spectrometers such as MERIS, are prone to an increase in the radiances, (Gao et al., 2009; Kratzer et al., 2010) mainly in the near infrared bands. Based on the fact that land areas that border lakes have typically higher reflectance than water in the NIR such that some photons reflected by the land surface are scattered in the atmosphere and these get recorded by the satellite sensor which is acquiring data over land pixels (Guanter et al., 2010). If not considered, the effect can lead to an overestimation of atmospheric radiance and subsequent underestimation of the water leaving radiance, Kratzer and Vinterhav (2010); Ruiz-VerdúKoponen et al. (2008). In this study ICOL was implemented as a pre-processing step and C2R and WeW were later applied. The reason for implementing the tool was to see if there would be possible improvements in lake surface reflectance. The inputs to the algorithm were 14 MERIS level 1b images. The output products are 8 water leaving reflectance bands and these include; 412.5, 442.5, 490, 510, 560, 620, 665 and 708.75 nm bands. Band 761 nm and 900 nm remained unchanged after the correction. Adjacency effects correction is applied only up to 30 km from the land (Sante, 2007). Lake IJsselmeer is less than 30 kilometers across and because of this was necessary to implement ICOL.
The processor calculates adjacency effects for surface reflectance, (ߩ ) as follows;
ߩ ൌ ߩ௨௧՛
௧՛ೝሾߩ
௨െ ߩҧሿ Equation (5)
Where, ߩ௨ = target reflectance before adjacency correction,
ߩҧ = the background reflectance calculated as distance- weighted average reflectance of neighboring pixels and
ݐ ՛ௗǡ ݐ ՛ௗ= atmospheric transmittance functions between the surface and sensor for direct and
diffuse radiation Guanter et al. (2010) and Doron et al. (2011)
.
4.3.2 Case 2 Regional Processor
Case 2 Regional Processor (C2R) is a processor for BEAM software and it executes batch processing type of routine. This tool was developed by Doerffer et al. (2007). In this study the tool was applied prior to ICOL as well as after ICOL. We used this processor because it was developed for coastal and Case 2 inland turbid waters and it describes the inherent properties of these waters as asserted by (Giardino et al., 2010). It is a two-step algorithm, which include neutral-network based atmospheric correction process and retrieval of water constituents. The two are performed as separate tasks as claimed by (Koponen, 2006; D. Odermatt et al., 2008). The processing steps are shown on figure 2 under appendix B.
MERIS L1b was used in C2R, to compute path radiances and transmittances of bands 412 nm -708 nm derived from the TOA directional radiance reflectance of 4 MERIS bands in the NIR spectral range band 708 -870 nm by using neural network (NN) algorithm (Guanter et al., 2010). The processor has a number of output products and the one necessary for the study were water leaving reflectance and water quality parameters for example, chl_a concentrations. The water leaving reflectance from the first 12 bands of MERIS were transformed to above surface irradiance reflectance in order to check for the accuracy of atmospheric correction.
4.3.3 Water Processor (WeW)
WeW like C2R is a processor and stand-alone module for the BEAM VISAT software developed by Freie Univesitat Berlin (FUB) Kratzer et al. (2008). The atmospheric correction algorithm is based on two large databases generated by a radiative transfer code based on the Matrix Operator Method (MOMO) code (Harff et al., 2011; Kratzer et al., 2008). It was important for the retrieval water quality parameters such as chl_a but more significant for this study was water-leaving reflectance. Within the processor itself, MERIS data were first masked for glint risk, land, bright and invalid pixels. The output water leaving radiance reflectances were produced from the image. We transformed water leaving radiance reflectances to above surface irradiance reflectance for atmospheric correction accuracy checking. The retrieval process followed the steps listed and summarized in (fig 3) appendix B. This task was only performed on image of 28 September. Based on these characteristics, semi empirical band ratio model was applied on MERIS image for derivation of absorption coefficients of PC and Chl_a as well as back scattering coefficient.
4.4 Semi-empirical Band Ratio Model
The semi empirical band ratio model was developed by (Simis et al., 2007) and the model assumes that phycocyanin and chl_a pigments are major light absorbers in a water column in red and NIR bands. The model is based on the relationship between subsurface irradiance reflectance and the absorption as well as backscattering coefficients of the optically active water constituents in the water column (Gordon et al., 1975). These IOPs are physically related to the subsurface irradiance reflectance an apparent optical property (AOP) which are a key parameter linking optical properties to the remotely sensed radiance data (Hunter et al., 2010; Mishra et al., 2009). The algorithm was developed for the band configuration of MERIS channel 6, 7, 9 and 12 centered at 620, 665, 709 and 778.75 nm respectively. It is assumed that absorption at 620 and 665 nm is dominated by phytoplankton pigments PC and chl_a Hunter et al. (2008) and Dekker (1993). Band 620 nm is dominated by both PC and chl_a, and 665nm by chl_a alone whilst 709nm and 778.75 are dominated by water alone Ruiz-Verdu et al (2008). Back scattering was retrieved at 778.75 nm, a wide 15 nm band and it is assumed to be spectrally neutral thus lambda (λ) was ignored. Simis (2005b) model will be used as described hereafter.
The IOPs and AOPs are related to each other in given water column as defined by Gordon et al (1975). The spectral reflectance just beneath the surface of water, R(0–, ߣ), is thus related to IOPs which are, absorption a(λ) and bb (λ) through a factor (ƒ) a coefficient that is dependent on the geographic latitude and longitude and light field according to (Morel, 2006).
The relation was derived as follows;
ܴሺͲିǡ ᢵሻ ൌ ݂Ǥ ್ሺఒሻ
ሺᢵሻା್ሺᢵሻ Equation (5)
Where, ƒ is an empirically determined scale factor dependent on the ambient light field and a(λ) and bb(λ) are t