Comparison of Three Methods of
Measuring Corneal Thickness and Anterior
Chamber Depth
WOLF BUEHL, MD, DANIJELA STOJANAC, MD, STEFAN SACU, MD,
WOLFGANG DREXLER, MD, AND OLIVER FINDL, MD
● PURPOSE: To compare three different methods of measuring corneal thickness (CT) and anterior chamber depth (ACD).
● DESIGN:Prospective clinical trial (Medical University of Vienna, Austria).
● METHODS: Central CT (CCT), CT at four peripheral points, and central ACD were measured in 88 eyes of 44 healthy subjects with the Pentacam (rotating Scheimpflug camera; Oculus, Wetzlar, Germany), Orbscan I (scanning-slit topography system; Orbtek Inc, Salt Lake City, Utah, USA), and AC-Master (partial coherence interferome-try; Zeiss Meditec, Jena, Germany), and the results were compared.
● RESULTS: The upper (lower) limits of agreement for CCT measurements were 7.9 (ⴚ22.2)m between AC-Master and Pentacam, 17.6 (ⴚ32.5) m between AC-Master and Orbscan, and 25.2 (ⴚ25.9) m between Pentacam and Orbscan. Correlation was high between all three methods (rⴝ0.94 to 0.97). The upper and lower limits of agreement for ACD were 0.174 (ⴚ0.251) mm between AC-Master and Pentacam, 0.406 (ⴚ0.004) mm between AC-Master and Orbscan, and 0.384 (0.095) mm between Pentacam and Orbscan. Correlation was high between the three methods (r ⴝ 0.96 between Orbscan and Pentacam; others 0.92). Correlation was lower for the CT measurements at the four peripheral points.
● CONCLUSIONS: The CCT and ACD values obtained by Pentacam, Orbscan, and AC-Master measurements correlated well and showed few outliers. The two new systems (Pentacam, AC-Master) provide a reliable, easy-to-use, noncontact method of measuring CCT and ACD. Larger differences occurred only when measuring
periph-eral CT values, especially between AC-Master and the other two methods. (Am J Ophthalmol 2006;141: 7–12. © 2006 by Elsevier Inc. All rights reserved.)
P
ARALLEL TO THE DEVELOPMENTS OF SURGICALtechnique in cataract and refractive surgery, the accurate measurement of corneal topography, ante-rior chamber depth, thickness of the crystalline or artificial lens, and eye length has gained in importance. Until recently, ultrasound biometry has been a common method for measuring corneal thickness (CT) and anterior chamber depth (ACD). However, this method is operator depen-dent.1,2 The most common method is applanation
ultra-sound, requiring corneal contact, which may lead to false results due to indentation of the cornea.3 The measuring
results also depend on the exact axial placement of the probe relative to the center of the cornea. Like all contact methods, it may be uncomfortable for the patient or even lead to damage of the corneal epithelium.4Thus,
noncon-tact methods are preferred for biometry of the eye.5,6
An accurate noncontact ocular biometry technique, based on the dual laser beam partial coherence interferom-etry (PCI) principle, has been developed in the past decade.7–10The PCI technology has been used for precise
axial length measurements and resulted in the commer-cially available IOL Master (Carl Zeiss Meditec, Jena, Germany). However, the IOL Master uses a photographic (not PCI) technique for measuring ACD.11Therefore, the
AC-Master (Zeiss Meditec) has been developed for PCI measurements of central corneal thickness (CCT) and ACD as well as lens thickness. The precision of this technique is in the micron region, and it is highly reproducible.5,12
In addition, several other optical (non-PCI) methods for imaging and measuring the corneal surface and the ante-rior chamber of the eye have been developed recently and are already commercially available.13–15One of these is the
Pentacam (Oculus, Wetzlar, Germany), which uses a rotating Scheimpflug16camera to image the anterior
seg-ment of the eye. It is also a noncontact method, and it is
Accepted for publication Aug 22, 2005.
From the Departments of Ophthalmology (W.B., D.S., S.S., O.F.) and Medical Physics (W.D.), Medical University of Vienna, Vienna, Austria.
W.D. is a consultant for Carl Zeiss Meditec (Jena, Germany). Inquiries to Oliver Findl, MD, Department of Ophthalmology, Medical University of Vienna, Währinger Gürtel 18-20, 1090 Wien, Austria; fax:
specifically designed to calculate a three-dimensional model of the anterior segment, including data for corneal topography (also of the posterior corneal surface), CT (pachymetry), ACD measurements, and measurements of lens opacity and lens thickness.
An already established instrument for analysis of cornea and anterior chamber, which does not make use of the Scheimpflug principle, is the Orbscan (I) scanning-slit topography system (Orbtek Inc, Salt Lake City, Utah, USA).1,17 It uses a horizontally moving slit beam to
produce multiple slit images of the anterior segment and provides data for (anterior and posterior) corneal topogra-phy and ACD.
However, little is known about the reliability of the different measuring techniques. In particular, it is not entirely clear whether the results of the different methods (PCI, scanning-slit, Scheimpflug method) are comparable and whether they can be used interchangeably. The purpose of this study was to compare CT and ACD measurements by the AC-Master with those of the Penta-cam and the Orbscan in a number of healthy subjects.
METHODS
EIGHTY-EIGHT EYES OF 44 YOUNG VOLUNTEERS WERE
IN-cluded in this prospective study. The subjects had to be healthy except for myopia/hyperopia and/or astigmatic ametropia. Exclusion criteria were other ocular diseases such as glaucoma and retinal pathology, or any history of ocular surgery, including (refractive) laser surgery. The volunteers were informed about the purpose of the study and had to give informed consent before inclusion. The study was performed in adherence to the Declaration of Helsinki. Ethics committee approval was not required for this study.
First, the refraction of each eye was determined with an automated refractometer (Zeiss Meditec, Jena, Germany). Contact lenses had to be removed at least 12 hours before the measurements. Both eyes of every subject were mea-sured with the Pentacam, the Orbscan, and finally the AC-Master. Thirty minutes were scheduled for the exam-ination time for each subject. All examexam-inations were performed by the same experienced examiner.
The Pentacam system consists of the Pentacam itself and a personal computer. The software is almost fully automated. After the patient’s data are entered, the pro-gram changes to imaging mode. The subject sits in front of the camera and places the chin on a chin rest. He or she is asked to fixate on a fixation target in the center of the camera. The examiner sees a real-time image of the patient’s eye on the computer screen. The image must be focused and cen-tered manually by moving the Pentacam in the respective directions. Markings on the screen indicate the direction the operator should move the joystick of the camera. As soon as the image is perfectly aligned, the patient is asked
not to move and to keep his or her eye open, and the scan is started.
The rotating camera takes multiple (25 or 50, depending on the user settings) slit images of the anterior eye segment in approximately 2 seconds with 500 true elevation points incorporated in each slit image. For this study, the “25 images per scan” option was chosen. After completing a scan, the software calculates a three-dimensional image of the anterior segment, including anterior and posterior corneal surface and lens surface as well as lens opacities. The quality of the lens data depends on the pupil size; of course, only the part of the lens visible in the pupillary aperture can be examined with the Scheimpflug camera. In this study, we did not use mydriatic eyedrops because we were mainly interested in central axial biometric data. The center of the cornea is measured in each of the single images of a scan. It is therefore possible to calculate very precise values for the CCT and the (central) ACD. In the Pentacam, ACD is defined as the distance between the posterior surface of the cornea and the anterior surface of the lens.
One high-quality scan per eye was saved on hard disk. The CCT and central ACD readings were noted for each eye. Additionally, peripheral CT measurements in the 3, 6, 9, and 12 o’ clock positions at a distance of 1.5 mm from the corneal center (corresponding to a circle around the center with a diameter of 3 mm) were noted.
Similar to the Pentacam, the Orbscan, the horizontally moving camera, produces multiple slit-lamp images of the eye to calculate a mathematical model of the cornea and the anterior lens surface with computer software. A real-time image of the eye is visible on the screen and has to be centered and aligned manually. The operator uses the reflec-tions of the slit-lamp light as orientation for the correct alignment. Then the subject is asked to keep the eyes open and not to move while the scan is started. Artifacts due to eye movement during the measurement lead to an error message, and the scan has to be repeated.
Again, we noted CCT, central ACD (which is again defined as distance between posterior corneal surface and anterior lens surface), and four additional values for pe-ripheral CT (again in the horizontal and vertical meridians of the cornea, at 1.5 mm distance from the corneal center). The AC-Master measures CT, ACD, and lens thickness from a single point of the cornea (usually the center) in one step by the PCI method. The white-to-white distance is determined from an image of the iris before performing biometry.
The principle of the dual-beam version of PCI has been reported previously.7,8The method requires that
measure-ments are performed along the optical axis (except for peripheral CT measurements). In the AC-Master, the patient fixates on a fixation target visible on a liquid crystal display, which serves to control the direction of gaze of the eye. The ideal position of the fixation target is calculated by the AC-Master, but can be adjusted
manu-ally. To measure along the optical axis, the four Purkinje images that result from reflections of the intraocular interfaces must be superimposed during the measurement. This can be controlled by the observer on the real-time image of the patient’s eye shown on the computer screen and, if necessary, adjusted by moving the fixation target. Each measurement consists of one or—preferably—more PCI A-scans (approximately 1 second per scan).
With the AC-Master, CT can also be measured periph-erally in four meridians at distances of 1.5, 3, and 4.5 mm from the center. The patient is then asked to look at additional fixation lights incorporated in the equipment. In the AC-Master, ACD is defined as the distance between theanteriorsurface of the cornea and the anterior surface of the lens. Thus, CCT must be subtracted from that result before comparing the ACD values with the results of Pentacam or Orbscan.
In this study, we measured CCT and central ACD of both eyes of all subjects. Additionally, peripheral CT was measured at the 3, 6, 9, and 12 o’clock positions at a distance of 1.5 mm from the corneal center. For each measurement, several scans were performed (at least 20 for the central measurements and at least five for each peripheral point) and the mean values calculated by the AC-Master software were noted. The precision of measure-ments was assessed by using the standard deviation of all consecutive scans in each eye. This is our standard proce-dure for AC-Master measurements; however, the standard deviation is usually smaller than 2m for CCT measure-ments and smaller than 11 m for ACD measurements, and a single scan would be sufficient in most cases.18
All data were entered into a Microsoft Excel spread-sheet. Paired differences were calculated for all
compar-isons (AC-Master vs Pentacam, AC-Master vs Orbscan, and Pentacam vs Orbscan) and are presented as mean and maximum values, standard deviation, coefficient of variation, median absolute differences, and upper and lower limits of agreement (ie, 95% Wald confidence intervals of the differences).19,20 The level of statistical
significance and the correlation between the three methods were calculated by the Wilcoxon matched-pairs signed rank test and Pearson correlation coeffi-cients. Bland-Altman plots were used to find a potential dependency between differences and means of two measurements.19P values of less than .05 were
consid-ered to be statistically significant. Statistical analysis was performed by Microsoft Excel and SPSS 12.0 software (SPSS Inc, Chicago, Illinois, USA).
RESULTS
THE MEAN AGE OF THE 44 SUBJECTS WAS 23.6 YEARS
(range, 21–32 years). The mean spherical equivalent was ⫺2.15 D (range, ⫺8.5 to ⫹3.0 D). 13. There were seven contact lens wearers who removed the lenses at least 12 hours before the study. Both eyes of all subjects (88 eyes) could be measured with the three instruments. Mean total examination time was 25 minutes per subject (approximately 15 minutes for Pentacam and Orbscan, and 10 minutes for the AC-Master measurements in-cluding scan evaluation). The Pentacam turned out to be the quickest examination, followed by the Orbscan topographer. Because measurements of the peripheral CT with the AC-Master must be performed step by step
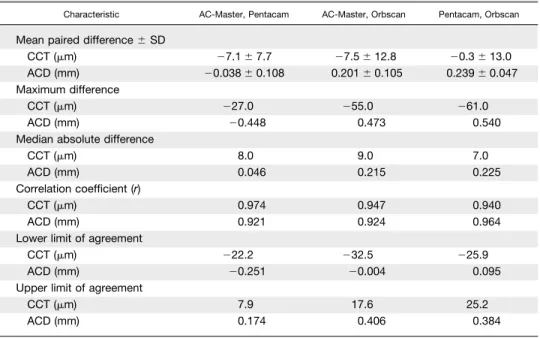
TABLE 1.Comparison of Central Corneal Thickness (CCT) and Central Anterior Chamber Depth (ACD) Values Between Three Methods of Measuring Corneal Thickness
Characteristic AC-Master, Pentacam AC-Master, Orbscan Pentacam, Orbscan
Mean paired difference⫾SD
CCT (m) ⫺7.1⫾7.7 ⫺7.5⫾12.8 ⫺0.3⫾13.0 ACD (mm) ⫺0.038⫾0.108 0.201⫾0.105 0.239⫾0.047 Maximum difference
CCT (m) ⫺27.0 ⫺55.0 ⫺61.0
ACD (mm) ⫺0.448 0.473 0.540
Median absolute difference
CCT (m) 8.0 9.0 7.0
ACD (mm) 0.046 0.215 0.225
Correlation coefficient (r)
CCT (m) 0.974 0.947 0.940
ACD (mm) 0.921 0.924 0.964
Lower limit of agreement
CCT (m) ⫺22.2 ⫺32.5 ⫺25.9
ACD (mm) ⫺0.251 ⫺0.004 0.095
Upper limit of agreement
CCT (m) 7.9 17.6 25.2
in different directions of gaze, these were the most time-consuming.
Mean ⫾ SD CCT was 534.6 ⫾ 33.4 m with the Pentacam, 535.0 ⫾ 37.8 m with the Orbscan, and
527.5 ⫾ 31.9 m with the AC-Master. Mean ⫾ SD ACD was 3.35 ⫾ 0.28 mm with the Pentacam, 3.12⫾ 0.27 mm with the Orbscan, and 3.32 ⫾ 0.24 mm with the AC-Master. The differences between the results of the three instruments were all statistically significant (P
⬍.01), except for CCT between Pentacam and Orbscan (P ⫽ .81).
Mean and maximum paired differences, median abso-lute differences, correlation coefficients, and upper and lower limits of agreement between the three methods are shown in Table 1. Bland-Altman plots of the paired ACD differences against the mean values are shown in the Figure. We found no dependency between paired differences and mean values in ACD (or CCT) mea-surements. CCT correlated best between Pentacam and AC-Master (r ⫽ 0.97). ACD correlated best between Pentacam and Orbscan (r ⫽ 0.96). CCT values were higher with the Pentacam than with the AC-Master in 80% of cases (median difference: 7.0 m) and higher with the Orbscan than with the AC-Master in 76% of cases (median difference: 7.0 m). The Orbscan ACD values were lower than the Pentacam results in all cases (median difference: 0.23 mm) and lower than the AC-Master results in 95% of cases (median difference: 0.22 mm). There was no marked offset between mea-surements of right and left eyes.
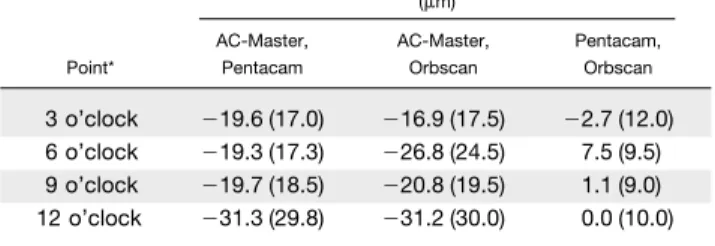
The same statistics were performed for the peripheral CT measurements (four points in the 3, 6, 9, 12 o’clock positions at 1.5 mm distance from the center of the cornea). Mean CT values ⫾ SD at those points are shown in Table 2. Mean paired differences and median absolute differences between the three methods are shown in Table 3. The values correlated best between Pentacam and AC-Master (r ⫽ 0.93– 0.94). However, the median differences between AC-Master and Penta-cam (Orbscan) were significantly larger than those of the CCT measurements (median differences between 17.0 and 30.0m), whereas median differences between Pentacam and Orbscan did not differ so greatly (0.3 to 5.8m). The highest difference was⫺86.0m between AC-Master and Orbscan at the 6 o’clock position.
FIGURE. Bland-Altman plots comparing mean anterior chamber depth (ACD) and ACD difference between AC-Master and Pentacam (top), AC-Master and Orbscan (middle), and Orbscan and Pentacam (bottom). ACD values in millimeters.
TABLE 2.Mean Corneal Thickness (CT) Values Measured With Three Systems at Four Peripheral Points
Point*
Mean Peripheral CT⫾SD (m) Pentacam Orbscan AC-Master
3 o’clock 551⫾35 549⫾41 532⫾33 6 o’clock 549⫾34 557⫾34 530⫾33 9 o’clock 551⫾34 552⫾39 532⫾32 12 o’clock 568⫾34 568⫾38 537⫾31
DISCUSSION
ACCURATE MEASUREMENT OF CT AND ACD HAS BECOME
important with the rapidly increasing popularity of corneal refractive surgical procedures and with the implantation of new (phakic) intraocular lenses. In this study, we have compared three different noncontact optical methods of measuring CT and ACD. Two of these instruments, the AC-Master and the Pentacam, have been made commer-cially available only quite recently. The Orbscan is an already established method and was made commercially available several years ago. However, the two new meth-ods, which are based on different optical measuring tech-niques, have potential advantages. These new instruments have already been shown to have a high repeatability and interexaminer reproducibility18 (Lackner B, unpublished
data, presented at the 19th meeting of the DGII [DGII⫽ Deutschsprachige Gesellschaft für Intraokularlinsen-Im-plantation und Refraktive Chirurgie (German Speaking Society for Intraocular Lens Implantation and Refractive Surgery)], February 2005). Still, it is not clear whether the results of different systems match well and can be used interchangeably. Significant differences in CCT values between different systems have already been shown in previous studies—for example, between ultrasound and Orbscan pachymetry.5
Partial coherence interferometry was shown to be the method with the least intraobserver or interobserver variability for CCT measurements compared with ultra-sound pachymetry and the Orbscan system.6 In this
study, we used a prototype version of the AC-Master. Although CCT measurements are highly accurate with this method, measurement of peripheral CT is more sensitive because it depends on the subject’s direction of gaze and the ability to fixate on the corresponding fixation light in front of the AC-Master. We found higher standard deviations (⬎5m) between repeated scans in the corneal periphery. These results are there-fore less reliable and reproducible than the CCT values. Differences between AC-Master values and Pentacam and Orbscan values were highest for these peripheral
points. Whether this is a result of erroneous measure-ments with the AC-Master or of the different measuring techniques, resulting in a bias between central and peripheral measurements, is uncertain.
The Pentacam is an easy-to-use biometry system for analysis of the anterior segment. Measurements with the Pentacam proved to be very simple, user-independent and quick (approximately 2 seconds per scan). Measure-ments with the Orbscan turned out to be a little more complicated and time-consuming than with the Penta-cam because measurements had to be repeated more often, at least with our setup.
Apart from a few outliers, from a practical point of view, the limits of agreement between the three meth-ods show acceptable ranges for both CCT and ACD. CCT values tend to be lower with the AC-Master than with the other two methods (mean, 7.3 m), whereas ACD values are lower with the Orbscan than with Pentacam and AC-Master (mean, 0.22 mm). As men-tioned above, differences between AC-Master and the other two methods were considerably larger for the peripheral CT measurements (mean, 16 to 31 m). However, the differences between Orbscan and Penta-cam remained low. Contrarily, correlation was higher between Pentacam and AC-Master than between Pen-tacam and Orbscan for the peripheral CT values.
In this study, we measured only normal corneas of healthy subjects. Therefore, we do not have data con-cerning the agreement between the three methods when measuring corneas with pathological alterations, or postoperative corneas. The differences between the three systems might be larger in such cases.
In summary, both the AC-Master and the Pentacam proved to be excellent noncontact methods for measur-ing CCT and (central) ACD in the healthy eye. Considering the different measuring techniques of the two novel devices and the Orbscan, the measurement differences between the three systems were quite small. Bigger differences appeared only when measuring pe-ripheral CT values that might be related to the fact that the AC-Master was primarily designed to measure cen-trally along the optical axis with high precision and requires different directions of gaze for measuring pe-ripheral CT values.
REFERENCES
1. Marsich MW, Bullimore MA. The repeatability of corneal thickness measures. Cornea 2000;19:792–795.
2. Miglior S, Albe E, Guareschi M, et al. Intraobserver and interobserver reproducibility in the evaluation of ultrasonic pachymetry measurements of central corneal thickness. Br J Ophthalmol 2004;88:174 –177.
3. Solomon OD. Corneal indentation during ultrasonic pa-chometry. Cornea 1999;18:214 –215.
TABLE 3.Comparison (Differences) of Corneal Thickness Values at Four Peripheral Points Between Three Methods
Point*
Mean Paired CT Difference (mean absolute difference) (m) AC-Master, Pentacam AC-Master, Orbscan Pentacam, Orbscan 3 o’clock ⫺19.6 (17.0) ⫺16.9 (17.5) ⫺2.7 (12.0) 6 o’clock ⫺19.3 (17.3) ⫺26.8 (24.5) 7.5 (9.5) 9 o’clock ⫺19.7 (18.5) ⫺20.8 (19.5) 1.1 (9.0) 12 o’clock ⫺31.3 (29.8) ⫺31.2 (30.0) 0.0 (10.0)
4. Kawana K, Tokunaga T, Miyata K, et al. Comparison of corneal thickness measurements using Orbscan II, non-contact specular microscopy, and ultrasonic pachymetry in eyes after laser in situ keratomileusis. Br J Ophthalmol 2004;88:466 – 468.
5. Rainer G, Petternel V, Findl O, et al. Comparison of ultrasound pachymetry and partial coherence interferometry in the measurement of central corneal thickness. J Cataract Refract Surg 2002;28:2142–2145.
6. Rainer G, Petternel V, Findl O, et al. Central corneal thickness measurements with partial coherence interferom-etry, ultrasound, and the Orbscan system. Ophthalmology 2004;111:875– 879.
7. Drexler W, Findl O, Menapace R, et al. Partial coherence interferometry: a novel approach to biometry in cataract surgery. Am J Ophthalmol 1998;126:524 –534.
8. Findl O, Drexler W, Menapace R, et al. High precision biometry of pseudophakic eyes using partial coherence inter-ferometry. J Cataract Refract Surg 1998;24:1087–1093. 9. Hitzenberger CK. Optical measurement of the axial eye
length by laser Doppler interferometry. Invest Ophthalmol Vis Sci 1991;32:616 – 624.
10. Vogel A, Dick HB, Krummenauer F. Reproducibility of optical biometry using partial coherence interferometry: intraobserver and interobserver reliability. J Cataract Refract Surg 2001;27:1961–1968.
11. Lam AK, Chan R, Pang PC. The repeatability and accuracy of axial length and anterior chamber depth measurements from the IOLMaster. Ophthalmic Physiol Opt 2001;21:477– 483.
12. Drexler W, Baumgartner A, Findl O, et al. Submicrometer precision biometry of the anterior segment of the human eye. Invest Ophthalmol Vis Sci 1997;38:1304 –1313.
13. Modis L, Langenbucher A, Seitz B. Scanning-slit and spec-ular microscopic pachymetry in comparison with ultrasonic determination of corneal thickness. Cornea 2001;20: 711–714.
14. Suzuki S, Oshika T, Oki K, et al. Corneal thickness mea-surements: scanning-slit corneal topography and noncontact specular microscopy versus ultrasonic pachymetry. J Cataract Refract Surg 2003;29:1313–1318.
15. Koranyi G, Lydahl E, Norrby S, Taube M. Anterior chamber depth measurement: a-scan versus optical methods. J Cata-ract RefCata-ract Surg 2002;28:243–247.
16. Holmen JB, Ekesten B, Lundgren B. Anterior chamber depth estimation by Scheimpflug photography. Acta Ophthalmol Scand 2001;79:576 –579.
17. Liu Z, Huang AJ, Pflugfelder SC. Evaluation of corneal thickness and topography in normal eyes using the Orbscan corneal topography system. Br J Ophthalmol 1999;83:774 – 778.
18. Sacu S, Findl O, Buehl W, et al. Optical biometry of the anterior eye segment: inter- and intra-examiner reliability of the ACMaster. J Cataract Refract Surg, in press.
19. Bland JM, Altman DG. Measuring agreement in method comparison studies. Stat Methods Med Res 1999;8:135–160. 20. Bland JM, Altman DG. Statistical methods for assessing agreement between two methods of clinical measurement. Lancet 1986;2:307–310.
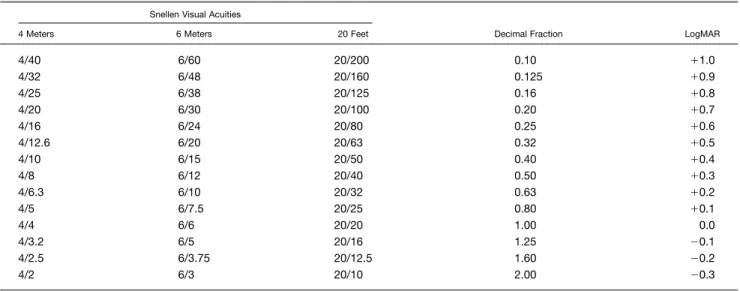
REPORTING VISUAL ACUITIES
The AJO encourages authors to report the visual acuity in the manuscript using the same nomenclature that was used in gathering the data provided they were recorded in one of the methods listed here. This table of equivalent visual acuities is provided to the readers as an aid to interpret visual acuity findings in familiar units.
Table of Equivalent Visual Acuity Measurements
Snellen Visual Acuities
Decimal Fraction LogMAR 4 Meters 6 Meters 20 Feet
4/40 6/60 20/200 0.10 ⫹1.0 4/32 6/48 20/160 0.125 ⫹0.9 4/25 6/38 20/125 0.16 ⫹0.8 4/20 6/30 20/100 0.20 ⫹0.7 4/16 6/24 20/80 0.25 ⫹0.6 4/12.6 6/20 20/63 0.32 ⫹0.5 4/10 6/15 20/50 0.40 ⫹0.4 4/8 6/12 20/40 0.50 ⫹0.3 4/6.3 6/10 20/32 0.63 ⫹0.2 4/5 6/7.5 20/25 0.80 ⫹0.1 4/4 6/6 20/20 1.00 0.0 4/3.2 6/5 20/16 1.25 ⫺0.1 4/2.5 6/3.75 20/12.5 1.60 ⫺0.2 4/2 6/3 20/10 2.00 ⫺0.3
Biosketch
Wolf BUEHL, MD
Department of Ophthalmology Medical University of Vienna
Waehringer Guertel 18-20, Vienna 1090, Austria wolf.buehl@meduniwien.ac.at
phone:⫹43-1-40400-7944 Date of birth: 24.5.1974
2000: PhD Thesis (⬙Fully automated analysis of PCO⬙)
2000 –2002: Research fellow in Ophthalmology, Medical University of Vienna Since 2002: Clinical fellow in Ophthalmology, Medical University of Vienna Primary research interests:
● Cataract surgery ● Intraocular lenses
● Posterior capsule opacification (PCO) ● Biometry