Automatic Classification of Acquisition Problems
Affecting Fingerprint Images
in Automated Border Controls
Ruggero Donida Labati, Angelo Genovese, Enrique Mu˜noz, Vincenzo Piuri, Fabio Scotti, Gianluca Sforza
Department of Computer Science, Universit`a degli Studi di Milano, Italy.
Email:
{
ruggero.donida, angelo.genovese, enrique.munoz, vincenzo.piuri, fabio.scotti, gianluca.sforza
}
@unimi.it
Abstract—Automated Border Control (ABC) systems aretechnologies designed to increase the speed and accuracy of identity verifications performed at international borders. A great number of ABCs deployed in different countries use fingerprint recognition techniques because of their high accuracy and user acceptability. However, the accuracy of fingerprint recognition methods can drastically decrease in this application context due to user-sensor interaction factors. This paper presents two main contributions. The first of them consists of an experimental evalu-ation performed to search the main aspects that could negatively affect the usability and accuracy in ABCs based on fingerprint biometrics. The second contribution consists in a novel approach for automatically identifying the type of user-sensor interaction that caused quality degradations in fingerprint samples. This method uses a specific feature set and computational intelligence techniques to detect non-idealities in the acquisition process and to suggest corrective actions to travelers and border guards. To the best of our knowledge, this is the first method in the literature designed to detect problems in user-sensor interaction different from improper pressures on the acquisition surface. We validated the proposed approach using a dataset of 2880 images simulating different scenarios typical of ABCs. Results showed that the proposed approach is feasible and can obtain satisfactory performance, with a classification error of 0.098.
I. INTRODUCTION
Automated Border Control (ABC) systems are promising solutions that use biometrics to facilitate border crossings and to increase the accuracy of the identity verifications performed by border guards. Biometric recognition has many potential benefits for border controls [1]: reducing border processing time, diminishing travelers’ frustration, increasing throughput, improving security, reducing costs and discharging border guards from tedious controls.
A great number of ABC systems use fingerprint recognition technologies. In particular, out of the 67 ABCs considered by the EU project ABC4EU [2], [3], [4], 41 of them (61.2%) employed fingerprints (also combined with other biometric traits) to verify the identity of the travelers. Moreover, the International Civil Aviation Organization selected fingerprint as one of the biometric traits that shall be included in the new generation of biometric passports [5].
However, the use of fingerprint biometrics in ABC envi-ronments poses several challenges that need to be addressed to guarantee satisfactory recognition performance. Among them, one of the most important issues is the user-sensor interaction in fingerprint recognition systems. In this context, the study
presented in [6] presented a detailed analysis of negative factors in user-sensor interaction. These factors include both operational aspects and environmental conditions. Based on this classification, we propose an analysis of the most im-portant user-sensor interaction factors that can decrease the performance of fingerprint recognition technologies in ABCs. The most relevant causes of accuracy decreasing are the operational conditions. Among them we highlight the follow-ing aspects as the most important ones:
• Inexperienced travelers: individuals who are not fa-miliar with fingerprint recognition systems can have trouble performing biometric acquisitions.
• Stress: for many travelers, the border cross can be a stressing experience.
• Luggage: most of the travelers carry hand luggage with them, which can both create problems in the fingerprint placement and temporarily modify the characteristics of the fingertip due to the pressure on the finger skin.
• Dirty hands: frequently, travelers consume food or use hand creams, which can deposit grease and dirt on the acquisition surface of the biometric acquisition device and affect the quality of the fingerprint images. • Sensor cleaning: the repeated use of the sensors can
provoke the presence of latent fingerprints on the acquisition surface. In order to avoid this problem, trained operators should periodically clean the acqui-sition device.
• Lack of feedback: in absence of a proper feedback, users cannot understand the problems that caused the acquisition of low quality images. Feedback on the acquisition quality can simplify the acquisition process and increase the quality of the acquired samples [7]. • Lack of supervision by an operator: if the system does
not provide the correct indications, the users can fail in the interaction with the sensor. The assistance of an operator that explains the sensor functioning can help in acquiring good quality samples [7].
Environmental factors also influence the biometric recognition performance, and can be classified as follows:
• Temperature: this factor can affect skin properties. © 2015 IEEE. Personal use of this material is permitted. Permission from IEEE must be obtained for all other uses, in any current or future media, including reprinting/republishing this material for advertising or promotional purposes, creating new collective works, for resale or redistribution to servers or lists, or reuse of any copyrighted component of this work in other works.
• Moisture level: high humidity conditions can produce images affected by smudged ridges in different zones of the image, background noise, latent fingerprints, significant breaks in the ridge structure and artifacts between ridges. On the other hand, a dry environment can induce a non-uniform contrast of the ridges or a weak impression of the ridge structure [8].
Considering the previously described aspects, it is neces-sary to design acquisition procedures that help the users to provide good quality samples, thus increasing the biometric recognition performance of ABCs.
In this context, one of the contributions of this paper consists in experimental evaluations of the behavioral and environmental conditions that could result in the decrease of the fingerprint quality during the recognition step in ABC systems, with the consequent reduction of the recognition accuracy. Moreover, we evaluated methods for compensating these factors. In particular, we analyzed fingerprint samples acquired under different conditions that can be present in ABC gates, including swollen hands, dirt on fingers, greased hands, and clean hands. These conditions are related to the contact with food and creams and to the pressure of the handles of the luggage and bags on the hands.
In order to mitigate effects of user-sensor interaction fac-tors, this paper introduces an approach to propose corrective actions for improving the quality of the acquisition process. Our approach automatically recognizes a set of relevant acqui-sition problems that can potentially occur during actual ABC operations by analyzing fingerprint images acquired with a standard resolution of 500 DPI. Our approach uses a set of optimized features and computational intelligence techniques designed to learn the distinctive characteristics of the samples introduced by different classes of acquisition problems. The final output consists of corrective actions to be performed by both travelers and the border guards.
Other authors have proposed techniques that help the user to control the amount of pressure applied to the sensor platen or the position of the fingers [7], [8], [9]. However, to the best of our knowledge, this paper is the first study in the literature focused on important problems that may appear in an ABC environment.
The paper is structured as follows. Section II presents related studies in the literature. Section III describes the performed experiments aimed at searching the main causes of performance degradation of fingerprint recognition technolo-gies in ABCs. Section IV details our approach for detecting problems in user-sensor interaction from fingerprint samples. Section V describes the experiments performed to validate our approach and presents the obtained results. Finally, Section VI concludes the work.
II. RELATED WORK
Given its important impact on the recognition perfor-mance, the literature presents many works aimed at improving the user-sensor interaction in fingerprint recognition systems. HBSI [10] is a method for evaluating the repeatability of the presentation of the biometric trait to the sensor. This evaluation then permits defining corrective actions for improving the
system accuracy and usability. Other works focus on the study of how different usability parameters can affect the quality of fingerprint images. For instance, the height and inclination of the fingerprint sensor [11], the use of different instructional methods [12], or the system’s feedback and the user’s experience [13].
As stated in [6], another approach that can be of great help to improve the robustness of fingerprint recognition systems to non-ideal acquisitions is the use of quality assessment methods that permit to discard low quality images [14], [15]. The standard ISO/IEC TR 29794-4 [16] analyzes aspects of fingerprint image quality, which include: usual important defects of fingerprint images; a common interpretation of quality scores; a terminology that can be used to specify, use and test fingerprint image quality metrics; and global and local features that can affect the performance of fingerprint recognition systems. These specifications are complemented by the standards ISO/IEC 2 [17] and ISO/IEC 19794-4 [18], which define aspects as minutiae quality and zonal quality.
The work in [19] divides quality assessment algorithms for fingerprint images into three classes: 1) those that employ local features of the image, 2) those that analyze the global features of the image, 3) and those that consider quality assessment as a classification problem. The last class of algorithms is the most commonly used in the literature.
In general, classifier-based methods combine local and global features to predict the matching performance that can be achieved using a fingerprint image. NIST NFIQ [20], one of the most commonly used quality assessment algorithms, adopts this approach. NFIQ uses features computed from a local quality map and the quality of the minutiae points. The computation of the local quality map analyzes the ridge orientation map and detects regions with low contrast, low ridge flow, and high curvature. The output of the classifier is a discrete value between 1 (highest quality) and 5 (lowest quality), which is a predictor of the accuracy that can be achieved by the software NIST NBIS [21] for the evaluated image.
NFIQ 2.0, the evolution of NFIQ, which is now under development, also applies classifier-based techniques. In par-ticular, the authors have proposed an open methodology [22] that divides the process into two steps. In the first step, they propose to gather a set of features that convey discriminative information about the quality of the image. In the second step, they propose to create a machine learning technique model that relates matching performance to the previously extracted features.
In the literature, there are other studies on quality assess-ment techniques for fingerprint samples. As an example, [23] proposes to employ self-organizing maps to calculate a set of features that are used by a random forest classifier to predict matching performance. Moreover, the works presented in [24], [25] use neural networks to deal with the quality assessment of fingerprint images acquired using touchless sensors [26], [27]. The aforementioned works only discriminate images based on their quality, but they are not capable of giving any information about what was the problem that caused a low quality score. To improve the repeatability of the presentation
to the sensor, algorithms should explain to the user what she is doing wrong, so that she can correct the problem. The work described in [7], [8] explores this path proposing an image analysis method that detects a set of problems that caused wrong acquisitions. This system can detect issues regarding finger positioning and pressure against the acquisition surface, and provide corrective messages accordingly. More recently, the work in [9] explored the same approach, but providing a graphical feedback. Nonetheless, none of the previously introduced approaches can detect frequent problems that may appear in ABCs, like swollen or dirty fingers. This paper covers this aspect. To the best of our knowledge, it is the first study in the literature on this topic.
III. ANALYSIS OF COMMON SITUATIONS INABCGATES THAT MAY IMPACT FINGERPRINT RECOGNITION
This section presents an experimental evaluation that aims at determining the negative aspects in user-machine interaction that have a greater impact on the accuracy of fingerprint recognition systems in ABCs.
In this context, we simulated different scenarios in our laboratory that represent a set of common situations in real ABCs. For each scenario, we computed the quality of each fingerprint sample and we computed the Student’s t-test to determine if the sets of data are statistically different one to each other.
Results showed that dirty fingers present poor image quality, which causes an important decrease in recognition accuracy. Differently, the presence of grease has a limited influ-ence in recognition performance but favors the appearance of latent fingerprints over the acquisition surface. Moreover, the presence of luggage reduces recognition accuracy only in the cases in which it makes the acquisition process uncomfortable. This section is organized as follows. First, we present the considered scenarios and the acquired image dataset. Second, we analyze the results obtained by applying different quality assessment methods in the literature in the considered scenar-ios.
A. Studied scenarios
We collected a dataset composed of 4320 fingerprint images simulating 6 scenarios typical of ABCs. For each simulated scenario, we collected 4 samples of the 10 fingers of 18 volunteers. We collected the samples in a single session from males and females in a range from 20 to 50 years old. The involved volunteers are students, professors and manual workers. We acquired the fingerprint images using a Dermalog ZF1 sensor. This is an optical plain fingerprint scanner capable of acquiring one fingerprint at a time. Table I resumes ZF1s technical specifications.
The acquisition procedure simulated a real ABC scenario. A traveler can face many situations that can affect her hands, producing an impact in the fingerprint recognition accuracy. For instance, travelers usually carry a luggage in their hands or on their shoulders, or eat food while they are at the airport. In order to simulate these situations, we acquired the fingerprint of our volunteers in the following conditions:
TABLE I. SCANNER CHARACTERISTICS
Dermalog ZF1
Scanning area 24mm x 16 mm Scan resolution 500 dpi Grey scale 8 bit, 256 grey levels Certifications FBI EFTS/F, BSI TR-PD, CE, EMV and GS
• Normal: This scenario represents normal acquisitions. The users presented their fingers with no special behavioral or environmental conditions.
• Hand-bag: This scenario represents a case in which the user carries a hand-bag. This is a quite common sce-nario, especially in airports, which can cause swollen or sweaty hands. To simulate it, we performed each acquisition after the user has hand-carried a bag of 4 kg for two minutes.
• Shoulder-bag: This scenario presents a situation in which the user carries a bag on the shoulder. This is a frequent situation in airports that can cause swollen hands and make uncomfortable the acquisition pro-cess. To reproduce it, we acquired fingerprint samples while the user was carrying a 4 kg bag on the shoulder. • Dirt: This scenario illustrates a case in which the traveler has dirtied her fingers with some kind of powder, like flour or dust. This scenario is usual in airports. For example, when the traveler touches a dirty surface or when she eats food covered with flour or powdered sugar (e.g., sandwiches/panini, donuts, croissant). In order to reproduce it, the user dirtied her fingers with flour and then cleaned them by clapping her hands.
• Grease: This scenario simulates a case in which the user’s fingerprints are greasy after she has touched a greasy substance. This scenario is frequent in airports. For example, when the user eats food like pizza or sandwiches, mayonnaise, ice cream or when she uses hand cream. To simulate it, we acquired the fingerprint samples after the user had used hand cream.
• Cleaned: This scenario illustrates how the cleaning of the hands using diverse products can help to alleviate problems introduced by dirty and greasy hands. To simulate it, we acquired fingerprint images after the user had cleaned her hands using wet wipes and a disinfecting substance.
Fig. 1 illustrates how the different scenarios influence the quality of fingerprint images.
B. Impact on fingerprint quality
To study how the different scenarios impact the fingerprint image quality, we used two well-known quality assessment methods and evaluated the quality of the acquired fingerprint images:
• NFIQ quality index: computed using the quality as-sessment method developed by the NIST [20]. This is one of the most commonly used quality indexes in the literature. This index ranges from 1 (maximum quality) to 5 (minimum quality).
Fig. 1. Examples of the fingerprint images acquired under the different scenarios. Each column illustrates a sample obtained from the same user and finger. It is possible to observe that non-ideal acquisition scenarios introduce different kinds of artifacts in the fingerprint images, thus reducing the sample quality and the overall accuracy of the biometric recognition process.
TABLE II. QUALITY RESULTS OBTAINED Dermalog NFIQ Mean Std. dev. Mean Std. dev. Normal 31.01 18.45 1.76 0.88 Hand-bag 30.61 18.61 1.78 0.88 Shoulder-bag 27.06 16.71 1.93 0.81 Dirt 17.13 9.44 3.13 1.03 Grease 31.94 19.14 1.84 1.05 Cleaned 30.89 17.58 1.64 0.81
• Dermalog quality index: computed using the quality assessment method developed by the sensors producer. This index ranges from 0 (minimum quality) to 100 (maximum quality).
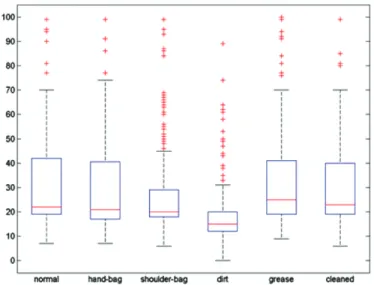
Figure 2 presents the boxplots of the quality distributions for Dermalog quality index, and Figure 3 presents the same results for NFIQ. Table II shows the obtained quality values for each scenario, indicating the average fingerprint image quality and its standard deviation. Table III presents the obtained p-values with Student’s t-test when comparing normal scenario with other ones. The values that represent a significant differ-ence, with a threshold of 0.05, are highlighted in bold.
We extracted the following conclusions from the obtained results:
• Hand-bag scenario: The results indicate that carrying a bag in a hand does not significantly affect the
Fig. 2. Boxplot that compares the different scenarios using Dermalog quality index. On average, the quality worsened 0.4 points when the user carried a bag in hand, 3.95 points when he/she carried the bag on the shoulder, 13.88 points when her fingers were dirtied with a powder and 0.12 points after cleaning her hands. On the other hand, the average quality increased 0.93 points with greasy fingers.
Fig. 3. Boxplot that compares the different scenarios using NFIQ quality index. On average, the quality went down 0.02 points when the user had carried a bag in hand, 0.17 points when the bag was on the shoulder, 1.37 when the user dirtied her fingers with powder and 0.08 points with grease. The mean quality improved in 0.12 points after the user cleaned her hands.
quality of fingerprint images, independently from the employed quality index.
• Shoulder-bag scenario: according to the statistical study, carrying a bag on the shoulder has a negative impact on the quality of the fingerprint image for both the considered quality indexes. Several volun-teers complained about the inconvenience of using the sensor while carrying the bag. The uncomfortable ac-quisition procedure can justify the decrease in quality. • Dirt scenario: the presence of dirt on the finger skin has significantly reduced the quality of the samples. The images presented in Figure 1 show the great
TABLE III. STATISTICAL STUDY OF QUALITY VALUES Dermalog NFIQ Normal vs. Hand-bag 0.75 1.00 Normal vs. Shoulder-bag 9.10E-04 8.99E-03
Normal vs. Dirt 1.44E-40 6.15E-79
Normal vs. Grease 0.46 0.55 Normal vs. Cleaned 0.93 0.01
impact of this issue in the acquired images. With respect to images acquired in a normal scenario, the acquired samples are smaller, present reduced ridge-valley contrast and include a higher number artifacts. In addition, each acquisition deposits dust on the acquisition surface, which also reduces the quality of later acquisitions.
• Grease scenario: with respect to acquisitions per-formed in normal conditions, the presence of grease on the fingertip does not produce significant differences in the image quality. However, we observed that the sensor gets dirty after a few acquisitions. This favored the appearance of latent fingerprints in the images. • Cleaned scenario: cleaning hands removes negative
effects introduced by dirt and grease. Fingerprint im-ages acquired after cleaning hands present very similar quality with respect to samples acquired in normal scenarios.
IV. USING COMPUTATIONAL INTELLIGENCE TO CORRECT FINGERPRINT ACQUISITION PROBLEMS
A. Required feedback to improve fingerprint acquisition pro-cess
The proposed approach aims at detecting those situations that can reduce the image quality or that may affect subsequent acquisitions. After the study performed in Section III, we isolated three situations that can affect the acquisition quality. These situations correspond to the scenarios Shoulder-bag, Dirt and Grease. If all these situations are correctly identified, the acquisition system can indicate the user how to behave in order to obtain a better fingerprint image.
Considering the aforementioned observations, we defined the following feedback messages for the considered acquisition scenarios:
• Correct acquisition. This message corresponds to the class Normal scenario.
• Remove the bag from your shoulder. This message should be displayed when the system detects that the user is carrying a bag on the shoulder (Shoulder-bag scenario).
• Clean the finger and the sensor. The system should recommend this action when it detects that the finger is dirty with powder (Dirt scenario).
• Clean the sensor. This output should be shown when the system detects that the user has her hands dirtied with grease (Grease scenario).
The approach to detect these problems is divided into three steps. The first one performs a segmentation of the fingerprint
image. The second step extracts different sets of features from the fingerprint sample. The final step estimates if a problem affected the acquisition process and determines its type by using neural classifiers.
B. Feature extraction
The proposed approach extracts the following sets of features:
• Features related to the shape of the Region of Interest
(FS): this set is composed by 4 features that evaluate the presence of deformations in the fingerprint image. These features are the length, width and area of the ROI, and the eccentricity of the ROI shape.
• Hog Features (FH): this set contains cw ×ch ×cb features. Their values summarize the information con-tained in a set of Histogram of Oriented Gradients (HOG) applied to the area of the image I belonging to the ROI. To compute these features we use the algorithm described in [28]. In particular, first we compute the gradient module imageGM(x, y)and the gradient phase imageGP(x, y)of the imageI. Then, we divide each image intocw×ch blocks. For each block, we quantize the orientation G˜P(x, y) into cb orientation bins, which are weighted by its magnitude
GM(x, y). For each cell, we compute a histogram with the cb orientations.
• Local Mean (FM): this set includes lw×lh features that summarize the gray level values of the image. In particular, we partition the image intolw×lh blocks. For each block, we compute the mean gray level value. • Local Variance(FV): this set includeslw×lhfeatures that summarize the standard deviation of the gray level values of the image. In particular, we partition the image intolw×lhblocks. For each block, we compute the standard deviation of the gray level value. • Gray-level co-occurrence matrix features (FC): this
set contains2×mw×mhfeatures that summarize the information contained in the Gray-level co-occurrence matrix. We divide the image intomw×mhblocks. For each block we compute the homogeneity and energy of the gray level co-occurrence matrix.
• Ridge orientation features (FR): This set comprises
ow ×oh features that describe the ridge orientation across the image. We divide the image into ow×oh blocks. For each block, we compute the mean orien-tation reliability.
C. Dimensionality reduction
If all the features studied in the previous section are included in the final learning dataset, the number of features can be very high. However, if this number is too big the efficiency and effectiveness of the learning algorithm can be undermined. Hence, we apply a dimensionality reduction tech-nique to obtain a more discriminative dataset. We consider two methods, feature selection and linear dimensionality reduction. For feature selection we use Sequential Forward Selection based on Linear Classifier [29]. This is a greedy algorithm
Fig. 4. Neural networks’ topology. We use one neural network per acquisition situation. We choose the final class as the one with the highest score.
that sequentially adds a feature that minimizes classification error given the current set of features. The algorithm terminates when the adding of any feature does not improve error. In order to estimate the error we use linear discriminant analysis. The model uses the pseudo inverse of the covariance matrix to avoid errors.
In the case of linear dimensionality reduction, we apply Principal Component Analysis (PCA) [30]. PCA aims at con-verting a set of observations that possibly contains correlated variables, into a set of values of linearly uncorrelated variables, called principal components. To do that it uses an orthogonal transformation.
D. Learning technique
To detect the acquisition issues, we use classifiers based on feed-forward neural networks. Fig. 4 presents the topology of the neural networks. The proposed classification method consists of a set of n neural networks and of a score fusion algorithm. Considering n classes representing n acquisition conditions, the classifier uses n trained feed-forward neural networks FFNNi. Each neural network FFNNiis a two-classes classifier, which considers the acquisition condition i as the positive class and returns a valueoi∈[0,1]. Our method uses the score fusion strategy class= argmaxi=1...n(oi)to obtain the final class representing the acquisition issue.
Each FFNNiconsists of a linear node as output layer, and a hidden layer composed by an empirically determined number of tan-sigmoidal nodes. The method used for the training of the neural networks is the Levenberg-Marquardt algorithm [31]. In order to properly estimate the generalization capability of the trained neural networks, we used a N-fold cross validation technique with N= 10[32].
V. EXPERIMENTS
This section analyzes the ability of the proposed approach to detect problematic situations during the acquisition of fingerprint samples.
We tested the proposed method by using a subset of the dataset introduced in Section III. This dataset is composed by 2880 samples pertaining to the scenarios Normal, Shoulder-bag, Dirt, and Grease. We selected only those samples be-cause we experimentally proved that the considered scenarios
TABLE IV. RESULTS USING NEURAL NETWORKS WITH10HIDDEN UNITS AND DIFFERENT FEATURE SETS.
Feature set Mean error Standard deviation Learning time All features 0.136 0.027 186 s
PCA 20 0.252 0.044 33.3 s PCA 40 0.159 0.019 49.7 s PCA 60 0.152 0.024 71.6 s LSFS 0.138 0.022 46.8 s
Notes: PCA-x= Principal Component Analysis withxdimensions; LSFS = Sequential Feature Selection based on Linear Classifier.
presenting more acquisition problems are Shoulder-bag, Dirt, and Grease (Section III).
First, we analyzed the need of applying dimensionality reduction strategies. Successively, we evaluated different learn-ing topologies. Finally, we compared the proposed approach with other classification techniques.
A. Feature set evaluation
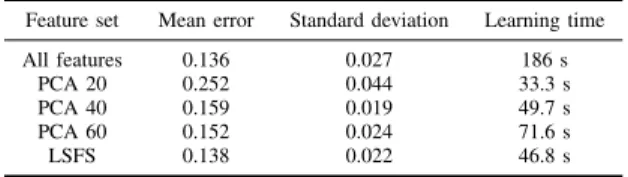
We analyzed the performance of the proposed method using different feature sets, dimensionality reduction algo-rithms and a neural network composed of 10 hidden nodes. In this test, we compared the performance of the proposed learning technique using the full dataset, the dataset after applying Sequential Forward Selection, and the dataset after applying PCA. Sequential Feature Selection achieved the best performance using a set of 58 features.
The complete feature set included the following 160 fea-tures:
• FS: 4 features describing the ROI.
• FH: 81 HOG features. The parameters cw,ch andcb took the values 3, 3 and 9, respectively.
• FM: 15 local mean features. The parameters lw and
lh took the values 3 and 5, respectively.
• FV: 15 local standard deviation features. The param-eters lw andlh took the values 3 and 5, respectively. • FC: 30 gray-level co-occurrence matrix features. The parameters mw and mh took the values 3 and 5 respectively.
• FR: 15 ridge orientation features. The parametersow andoh took the values 3 and 5, respectively.
The reduced dataset obtained after applying Sequential Forward Selection contained a total of 58 features, which include: 2 features fromFS; 26 features fromFH; 7 features from FM; 6 features from FV; 11 features from FC; and 6 features fromFR.
Moreover, we tested three configurations of PCA transfor-mation: 20, 40, and 60 features.
Table IV presents the results obtained for each feature set. Tests indicate that the feature set that obtained the best performance is the one containing all the features. However, the feature set obtained by LSFS was capable of achieving a very similar result in much less time. Hence, we decided to use it for the rest of the experiments.
TABLE V. RESULTS USING A DIFFERENT NUMBER OF HIDDEN UNITS IN TERMS OF MEAN ERROR,STANDARD DEVIATION AND LEARNING TIME.
Hidden units Mean error Standard deviation 5 0.168 0.027 10 0.138 0.022 30 0.112 0.017 50 0.098 0.026 70 0.103 0.019
TABLE VI. RESULTS USING DIFFERENT TOPOLOGIES IN TERMS OF MEAN ERROR AND STANDARD DEVIATION.
Topology Mean error Standard deviation S-FFNN-1 0.259 0.059 S-FFNN-4 0.131 0.025 V-FFNN 0.112 0.019 M-FFNN 0.098 0.026
Notes: S-FFNN-1 = single feed-forward neural network with one output node; S-FFNN-4 = single feed-forward neural network with four output nodes; V-FFNN = voting approach based on K(K1)/2feed-forward neural networks; M-FFNN = approach based on multiple feed-forward neural networks (Section IV-D).
B. Tuning of the neural networks
This section studies the number of nodes in the hidden layer that needs to be used in order to achieve the best results. We tested five configurations: 5, 10, 30, 50 and 70 hidden units. Table V presents the results obtained for each configuration. We obtained the best results with 50 hidden units, achieving a mean error of 0.098.
C. Learning topology evaluation
To search the best configuration of our proposed method, we evaluated the performance of four topologies of classifiers. Results validated the choice of the approach described in Section IV-D.
The evaluated topologies are the following:
• S-FFNN-1: a single feed-forward neural network with single hidden layer and one node in the output layer. The output is a number from 1 to 4, which corresponds to the output class.
• S-FFNN-4: a single feed-forward neural network with single hidden layer and four nodes in the output layer, one for each class. The output node with the highest score determines the output class.
• V-FFNN: a set of n(n−1)/2 feed-forward neural networks, where n indicates the number of classes. Each neural network is trained to distinguish between two classes. The final output is the class with the highest number of votes.
• M-FFNN: The approach proposed in Section IV-D. Table VI presents the results obtained by using each topology of classifier. The results include the mean error and the standard deviation. The topology that obtained the best accuracy was M-FFNN, achieving a mean error equal to 0.098. On the other hand, S-FFNN-1 was not capable of differentiating between the different classes, achieving a mean error equal to 0.259. These results endorse the choice of the topology M-FFNN.
TABLE VII. RESULTS USING DIFFERENT LEARNING TECHNIQUES IN TERMS OF MEAN ERROR AND STANDARD DEVIATION.
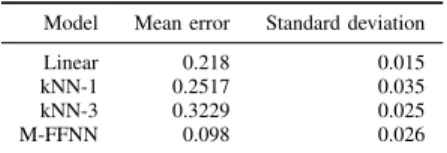
Model Mean error Standard deviation Linear 0.218 0.015 kNN-1 0.2517 0.035 kNN-3 0.3229 0.025 M-FFNN 0.098 0.026
D. Comparison with other classifiers
This section compares the results obtained by the proposed neural classifier in its best configuration and other well-known techniques in the literature. In particular, we compared the performance of the proposed classification method with
knearest neighbor and linear classifier. Table VII presents the obtained results.
Table VII shows that neural classifiers outperformed all the compered methods on the considered dataset. Moreover, simple classifiers did not obtain satisfactory accuracy on the considered problem. However, classifiers able to approximate more complex functions, like a neural network with a large number of hidden units, obtained a significant reduction of the classification error. The analysis of which computational intel-ligence technique obtains the best results is out of the scope of this paper, since it is also dependent on the specific data of the studied application. Other computational intelligence techniques, like support vector machines, could be analyzed in future research studies.
VI. CONCLUSIONS
This paper presented a study on the human-sensor inter-action factors that mainly affect the accuracy of fingerprint recognition technologies used in Automated Border Control (ABC) systems. We presented two main contributions. First, we experimentally evaluated the effect of different acquisition scenarios on the sample quality. Second, we presented a novel approach for automatically detecting non-idealities in the user-sensor interaction from fingerprint samples. Our approach uses computational intelligence techniques and detects different classes of problems that frequently affect ABCs. The final output consists of a message describing corrective actions to be performed by travelers and border guards. To the best of our knowledge, this is the first method in the literature designed to detect problems in user-sensor interaction different from improper pressures on the acquisition surface.
To evaluate negative factors in user-sensor interaction, we collected a dataset of 4320 images describing 6 frequent scenarios in ABCs. We evaluated the quality of the collected samples using well-known quality assessment methods in the literature. From the obtained results, we derived the following conclusions: uncomfortable acquisitions performed wearing a shoulder bag obtained poor quality images; the presence of dirt on the finger skin drastically reduced the visibility of the ridge pattern and caused latent fingerprints on the acquisition surface; the presence of grease on the fingertip did not affect the image quality but introduced problems due to the release of latent fingerprints; cleaning hands can reduced problems due to the dirt and grease.
We validated the proposed approach for estimating the type of eventual acquisition problems on a set of 2880 fingerprint
samples, which included the images of the collected dataset pertaining to those scenarios that produced a decrease in fingerprint image quality. Results showed that the proposed approach is feasible and obtained a classification error equal to 0.098 on the used dataset.
Future studies should regard the analysis of data collected from real ABCs and to study the impact of our approach on the usability of fingerprint recognition systems applied in ABCs.
ACKNOWLEDGMENT
This work was supported in part by: the EC within the 7FP under grant agreement 312797 (ABC4EU); the EC within the H2020 program under grant agreement 644597 (ESCUDO-CLOUD); and the Italian Ministry of Research within the project “GenData 2020” (2010RTFWBH).
REFERENCES
[1] Frontex Agency, Best Practice Technical Guidelines for Automated Border Control (ABC) Systems. European Agency for the Management of Operational Cooperation at the External Borders of the Member States of the European Union, 2012.
[2] European Commission, “Automated border control gates for Europe (ABC4EU),” 2014, http://abc4eu.com.
[3] R. Donida Labati, A. Genovese, E. Mu˜noz, V. Piuri, F. Scotti, and G. Sforza, “Advanced design of automated border control gates: bio-metric system techniques and research trends,” in Proc. of the 2015 IEEE Int. Symp. on Systems Engineering (ISSE 2015), Rome, Italy, September 2015, pp. 412–419.
[4] R. Donida Labati, A. Genovese, E. Mu˜noz, V. Piuri, F. Scotti, and G. Sforza, “Automated border control systems: bometric challenges and research trends,” inProc. of the 11th International Conf. on Information Systems Security (ICISS 2015), Kolkata, India, December 2015. [5] International Civil Aviation Organization (ICAO),Doc 9303, Machine
readable travel documents. Part 1, 2006, vol. 2.
[6] F. Alonso-Fernandez, J. Fierrez, and J. Ortega-Garcia, “Quality mea-sures in biometric systems,”IEEE Security Privacy, vol. 10, no. 6, pp. 52–62, Nov. 2012.
[7] H. Guan, M. F. Theofanos, Y.-Y. Choong, and B. Stanton, “Real-time feedback for usable fingerprint systems,” inProc. of the Int. Joint Conf. on Biometrics, 2011, pp. 1–8.
[8] Y.-Y. Choong, M. F. Theofanos, and H. G. Uan, “Fingerprint self-captures: usability of a fingerprint system with real-time feedback,” in
Proc. of the 5th IEEE Int. Conf. on Biometrics: Theory, Applications and Systems, 2012, pp. 16–22.
[9] Y.-Y. Choong and M. Theofanos, “Ten-print fingerprint self-captures: graphics-only user guidance without language,” inProc. of the IEEE Int. Joint Conf. on Biometrics, 2014, pp. 1–8.
[10] E. Kukula, M. Sutton, and S. Elliott, “The human-biometric-sensor interaction evaluation method: Biometric performance and usability measurements,” IEEE Trans. on Instrumentation and Measurement, vol. 59, no. 4, pp. 784–791, Apr. 2010.
[11] M. Theofanos, B. Stanton, C. Sheppard, R. Micheals, N. Zhang, J. Wydler, L. Nadel, and W. Rubin, “Usability testing of height and angles of ten-print fingerprint capture,” Tech. Rep. NISTIR 7504, Jun. 2008. [12] Mary Theofanos, Brian Stanton, Shahram Orandi, Ross Micheals, and
Nien-Fan Zhang, “Usability testing of ten-print fingerprint capture,” National Institute of Standards and Technology, Tech. Rep. NISTIR 7403, 2007.
[13] M. Theofanos, B. Stanton, R. Micheals, and S. Orandi, “Biometric systematic uncertainty and the user,” inProc. of the 1st Int. Conf. on Biometrics: Theory, Applications, and Systems., 2007, pp. 1–6. [14] D. Maltoni, D. Maio, A. K. Jain, and S. Prabhakar,Handbook of
Fin-gerprint Recognition, Second Edition. Springer Publishing Company, Incorporated, 2009.
[15] R. Donida Labati and F. Scotti, “Fingerprint,” in Encyclopedia of Cryptography and Security (2nd ed.), H. van Tilborg and S. Jajodia, Eds. Springer, 2011, pp. 460 – 465.
[16] International Organization for Standardization,ISO/IEC 29794-4:2010, Information Technology - Biometric sample quality: Finger image data, ser. International Standard. ISO, 2011, no. pt. 4.
[17] International Organization for Standardization,ISO/IEC 19794-2:2011, Information Technology - Biometric Data Interchange Formats: Finger minutiae data, ser. International Standard. ISO, 2011, no. pt. 2. [18] International Organization for Standardization,ISO/IEC 19794-4:2011,
Information Technology - Biometric Data Interchange Formats: Finger image data, ser. International Standard. ISO, 2011, no. pt. 4. [19] F. Alonso-Fernandez, J. Fierrez, J. Ortega-Garcia, J.
Gonzalez-Rodriguez, H. Fronthaler, K. Kollreider, and J. Bigun, “A comparative study of fingerprint image-quality estimation methods,”IEEE Trans. on Information Forensics and Security, vol. 2, no. 4, pp. 734–743, Dec. 2007.
[20] E. Tabassi, C. L. Wilson, and C. I. Watson, “Fingerprint Image Quality NISTIR 7151,” Tech. Rep., 2004.
[21] C. I. Watson, M. D. Garris, E. Tabassi, C. L. Wilson, R. M. Mccabe, S. Janet, and K. Ko, “User’s guide to NIST biometric image software (NBIS),” 2007.
[22] O. Bausinger and E. Tabassi, “Fingerprint sample quality metric NFIQ 2.0,” inProc. of BIOSIG, 2011, pp. 167–171.
[23] M. A. Olsen, E. Tabassi, A. Makarov, and C. Busch, “Self-organizing maps for fingerprint image quality assessment,” in Proc. of the IEEE Conf.on Computer Vision and Pattern Recognition Workshops, 2013, pp. 138–145.
[24] R. Donida Labati, V. Piuri, and F. Scotti, “Neural-based quality mea-surement of fingerprint images in contactless biometric systems,” in
Proc. of the 2010 IEEE-INNS Int. Joint Conf. on Neural Networks, Barcelona, Spain, July 2010, pp. 1–8.
[25] R. Donida Labati, A. Genovese, V. Piuri, and F. Scotti, “Quality measurement of unwrapped three-dimensional fingerprints: a neural networks approach,” inProc. of the 2012 IEEE-INNS Int. Joint Conf. on Neural Networks, Brisbane, Australia, June 2012, pp. 1123–1130. [26] R. Donida Labati, V. Piuri, and F. Scotti,Touchless Fingerprint
Bio-metrics. CRC Press, 2015.
[27] R. Donida Labati, A. Genovese, V. Piuri, and F. Scotti, “Toward unconstrained fingerprint recognition: A fully touchless 3-D system based on two views on the move,”IEEE Trans. on Systems, Man, and Cybernetics: Systems, 2015.
[28] D. G. Lowe, “Distinctive image features from scale-invariant keypoints,”
Int. Journ. of Computer Vision, vol. 60, no. 2, pp. 91–110, 2004. [29] J. Kittler, “Feature selection and extraction,” Handbook of Pattern
Recognition and Image Processing, pp. 59–83, 1986.
[30] I. Jolliffe,Principal component analysis. Wiley Online Library, 2002. [31] J. J. Mor´e, “The Levenberg-Marquardt algorithm: implementation and
theory,” inNumerical analysis. Springer, 1978, pp. 105–116. [32] R. O. Duda, P. E. Hart, and D. G. Stork,Pattern Classification. John